

Bitcoin (BTC) has managed to stay above the $26,000 support but has failed to initiate a significant upward movement.
Despite there being a lack of a bullish structure, Bitcoin has managed to hold on well above support.
Bitcoin Weakness Could Lead to Drop
BTC followed up a shooting star candlestick from Dec. 27 by creating a small bullish candlestick the next day. This move didn’t come close to the prior day’s highs, however.
The daily RSI has also begun to show weakness in the form of bearish divergence. However, neither the MACD nor Stochastic oscillator has generated any type of bearish signals.

The six-hour chart shows a more pronounced bearish divergence, visible in both the RSI and the MACD. In addition, we can see that BTC has been following an ascending support line, which is currently just above $25,000.
The weakness visible in both the daily and six-hour charts suggests that BTC could drop and validate this line before moving higher.

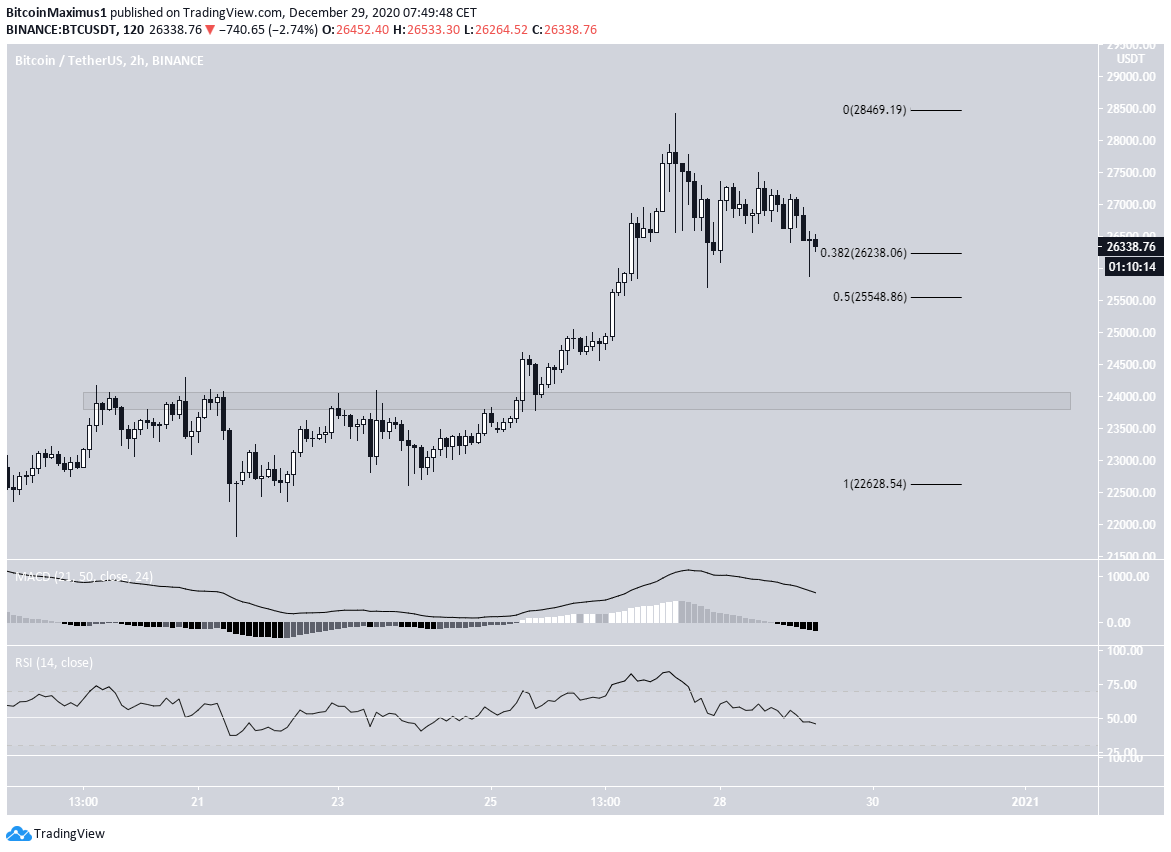
Future Movement
Lower time-frames reveals that BTC is trading above a minor support level at $26,250 (0.382 Fib retracement level). Up to this point, BTC has created a few long lower wicks that also touched the 0.5 Fib retracement level at $25,550.
So far, there are no bullish reversal signs in the two-hour time-frame. A breakdown below these support levels could trigger a sharp drop to $24,000.
However, as evidenced in the previous section, BTC is trading just above a crucial support level. This has created two long lower wicks, making it more likely that BTC bounces from the current price level.
BTC Wave Count
In yesterday’s wave count analysis, BeInCrypto stated that BTC is likely in the final sub-wave (black) of wave 5 (orange), which is expected to end near $29,800.
Despite yesterday’s decrease, the count still remains the same.

A closer look reveals that it’s possible that BTC just completed sub-wave 4 — or will do so after a slightly lower low.
However, the invalidation level of this count just above sub-wave 1 at $24,661, remains the same.

Conclusion
Bitcoin is expected to soon reverse its trend and make another attempt at creating a new all-time high price. A decrease below $24,661 would invalidate this particular scenario.
For BeInCrypto’s latest Bitcoin (BTC) analysis, click here!
Disclaimer: Cryptocurrency trading carries a high level of risk and may not be suitable for all investors. The views expressed in this article do not reflect those of BeInCrypto.
Trusted
Disclaimer
In line with the Trust Project guidelines, this price analysis article is for informational purposes only and should not be considered financial or investment advice. BeInCrypto is committed to accurate, unbiased reporting, but market conditions are subject to change without notice. Always conduct your own research and consult with a professional before making any financial decisions. Please note that our Terms and Conditions, Privacy Policy, and Disclaimers have been updated.
