


The Bitcoin (BTC) price continued its ascent last week, reaching another new all-time high of $28,422 on Dec. 27.
Short-term readings suggest that a top has not yet been reached and that another upward move could occur.
New Bitcoin High Creates Shooting Star
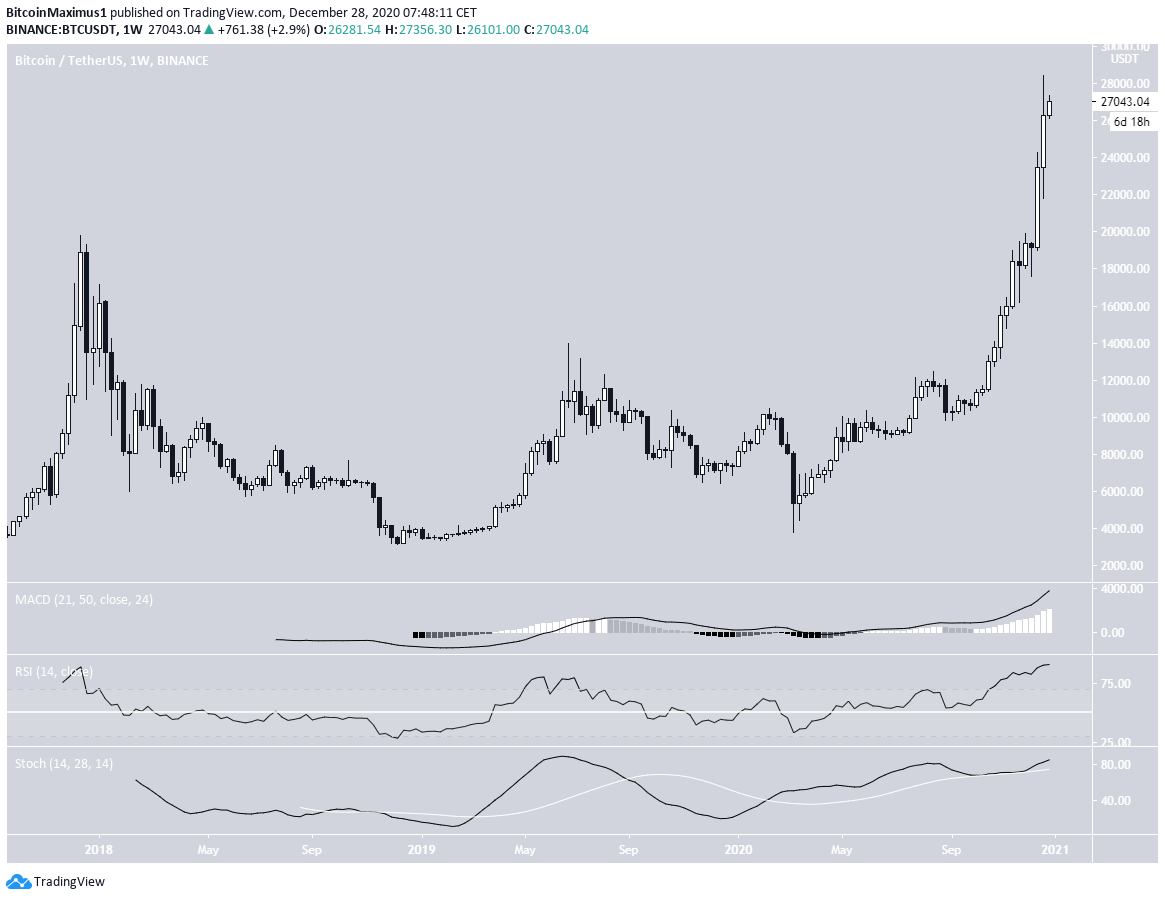
The BTC price continued its ascent during the week of Dec 21-27, reaching yet another new all-time high of $28,422 on Dec. 27.
Despite a relatively long upper wick, the weekly candlestick still looks bullish.
Furthermore, technical indicators do not yet show any weakness, suggesting that the trend is still bullish.
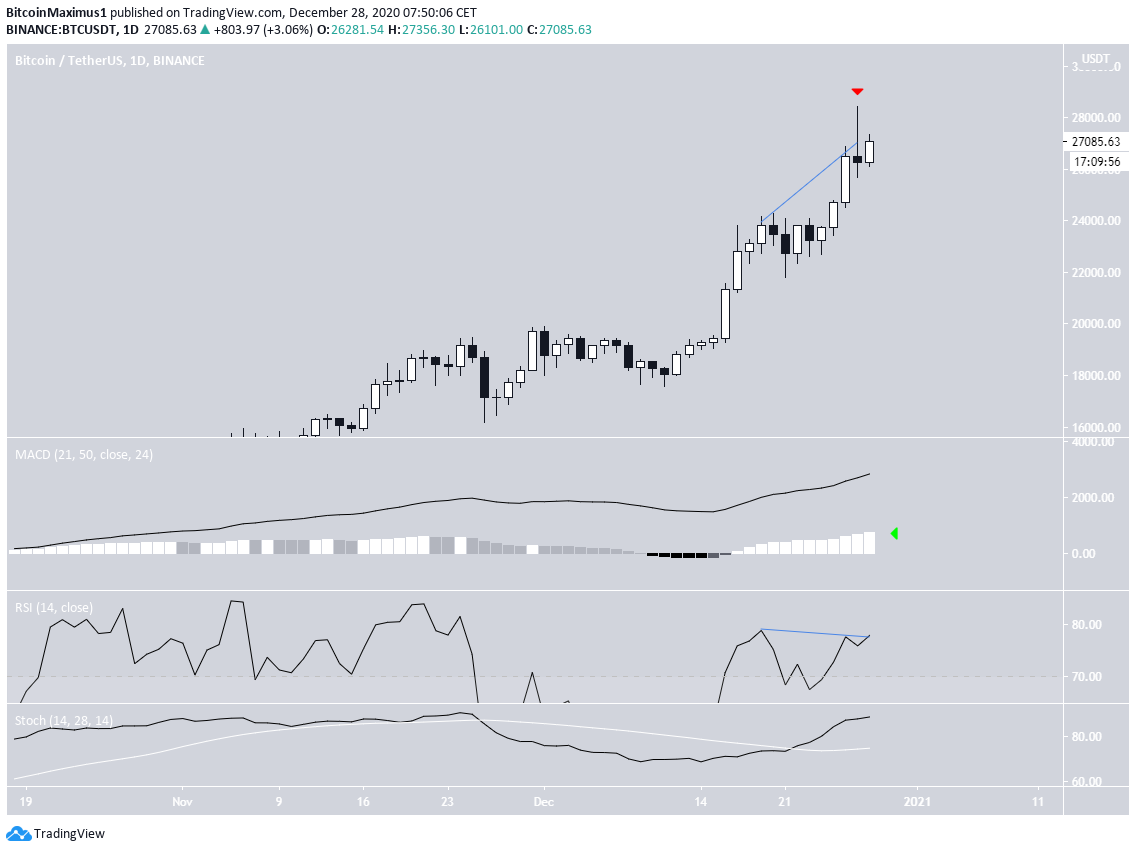
The daily chart shows the first signs of weakness, visible in the form of a shooting star candlestick created on Dec. 27. The candlestick was also combined with a bearish divergence in the RSI.
However, both the MACD and Stochastic oscillator are still bullish and could allow for the upward movement to continue.
Future BTC Movement
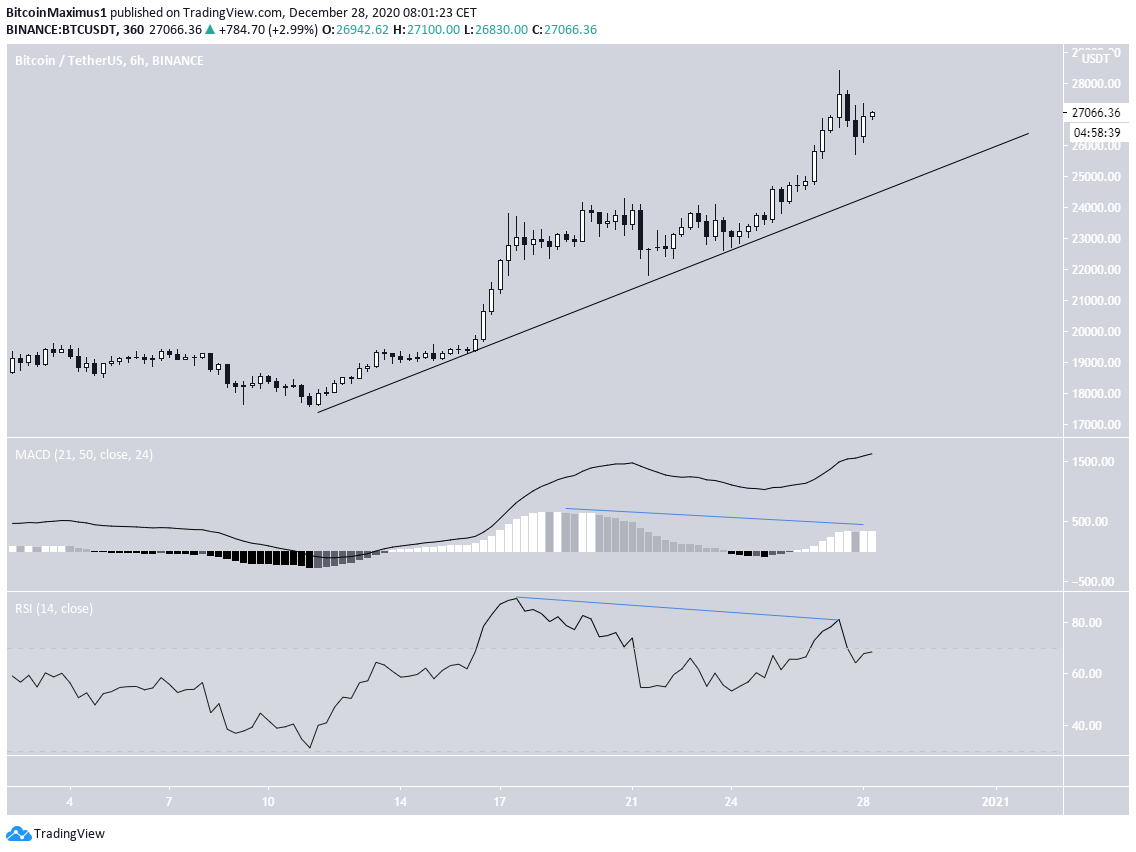
The six-hour chart for BTC shows the first clear signs of weakness in the form of a bearish divergence in both the RSI and MACD.
However, it also shows that BTC has been following an ascending support line since Dec. 10, which is currently near $25,000.
As long as BTC is trading above this support line, it is expected to continue moving higher.
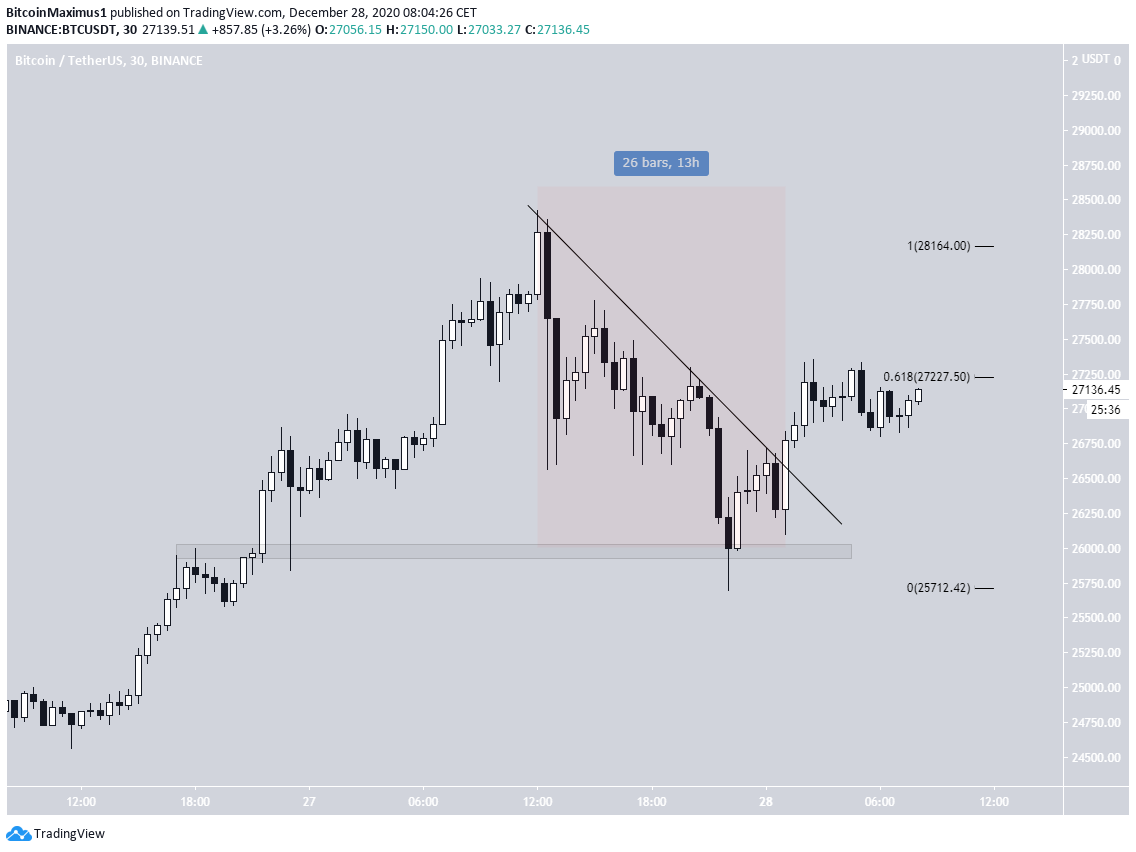
The 30-minute chart shows that BTC has broken out from a descending resistance line, which came after a downward move that looked entirely corrective (highlighted in red).
If BTC is able to move above the current resistance area (0.618 Fib retracement), it would be expected to make another breakout attempt and possibly reach another new all-time high.
Conversely, the loss of the minor $26,000 support area could take BTC back down to the ascending support line at $25,000.
Conclusion
Bitcoin is expected to make another breakout attempt and possibly reach another all-time high. A decrease below $26,000 could trigger a significant drop.
For BeInCrypto’s previous Bitcoin (BTC) analysis, click here!
Disclaimer: Cryptocurrency trading carries a high level of risk and may not be suitable for all investors. The views expressed in this article do not reflect those of BeInCrypto.


