

Bitcoin (BTC) decreased considerably on Nov 16 and is in process of breaking down from a short-term corrective pattern, which could further intensify the downward movement.
BTC has been falling since Nov 10 after it reached an all-time high price of $69,000. The downward move was preceded by bearish divergence in both the MACD and RSI. This is a bearish sign that often kicks off bearish trend reversals.
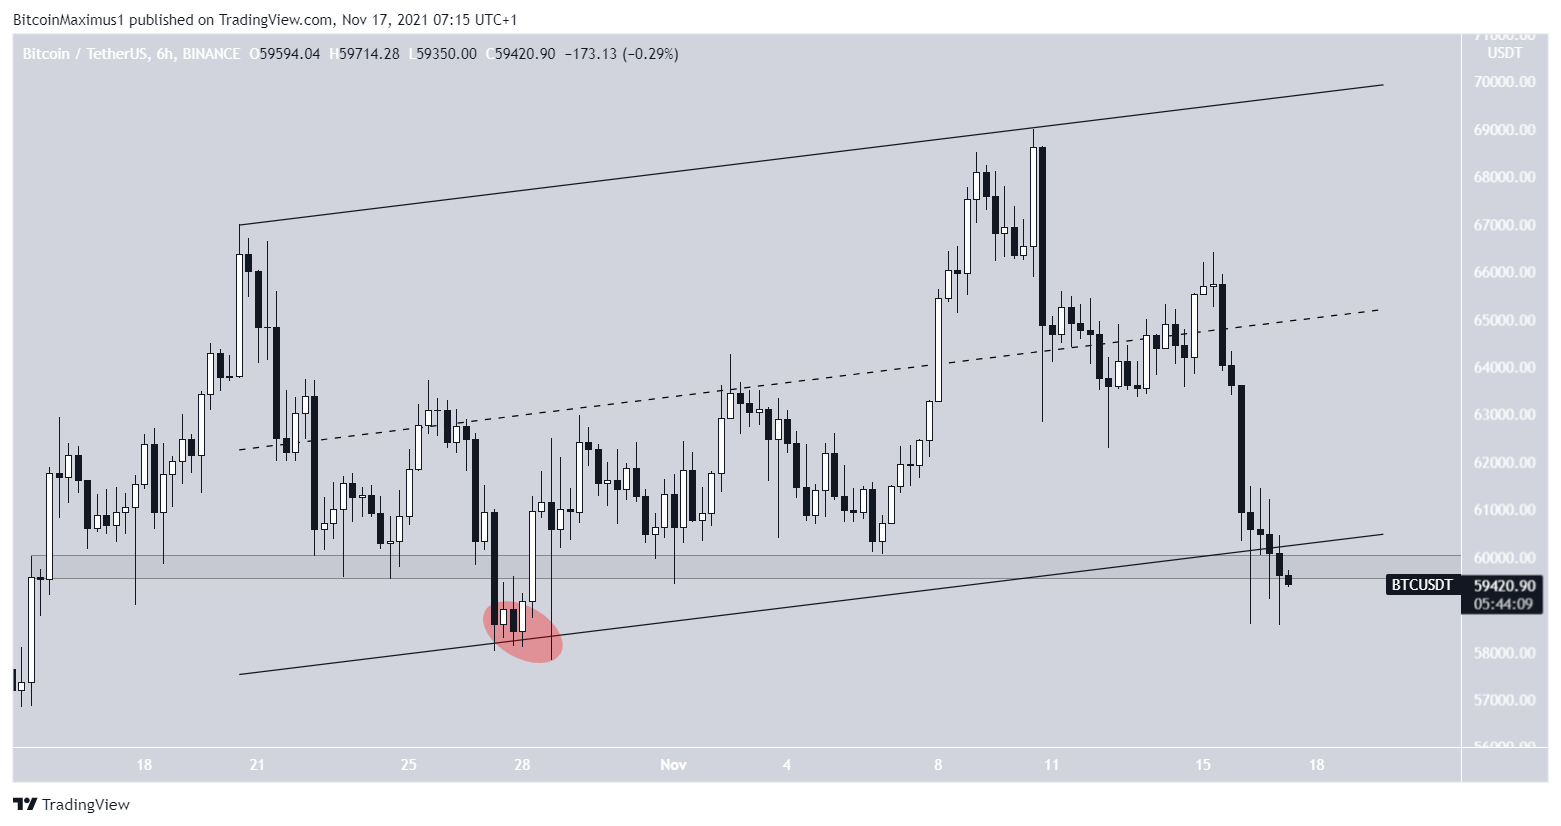
BTC has already touched the first support area at $57,850. This is the short-term 0.382 Fib retracement support level.
However, there is a stronger support level found between $53,700 and $54,350, created by the long-term 0.382 (black) Fib retracement support and the short-term 0.5 Fib.

Potential breakdown
The six-hour chart shows that BTC is in the process of breaking down from an ascending parallel channel. Furthermore, it’s also breaking down from the $59,800 minor support area.
Previously, BTC had deviated below this area on Oct 27 (red circle) before reclaiming it. However, it’s now in the process of breaking down once again.
If it falls through this support, BTC would likely decrease towards the previously outlined $53,700-$54,350 support area.
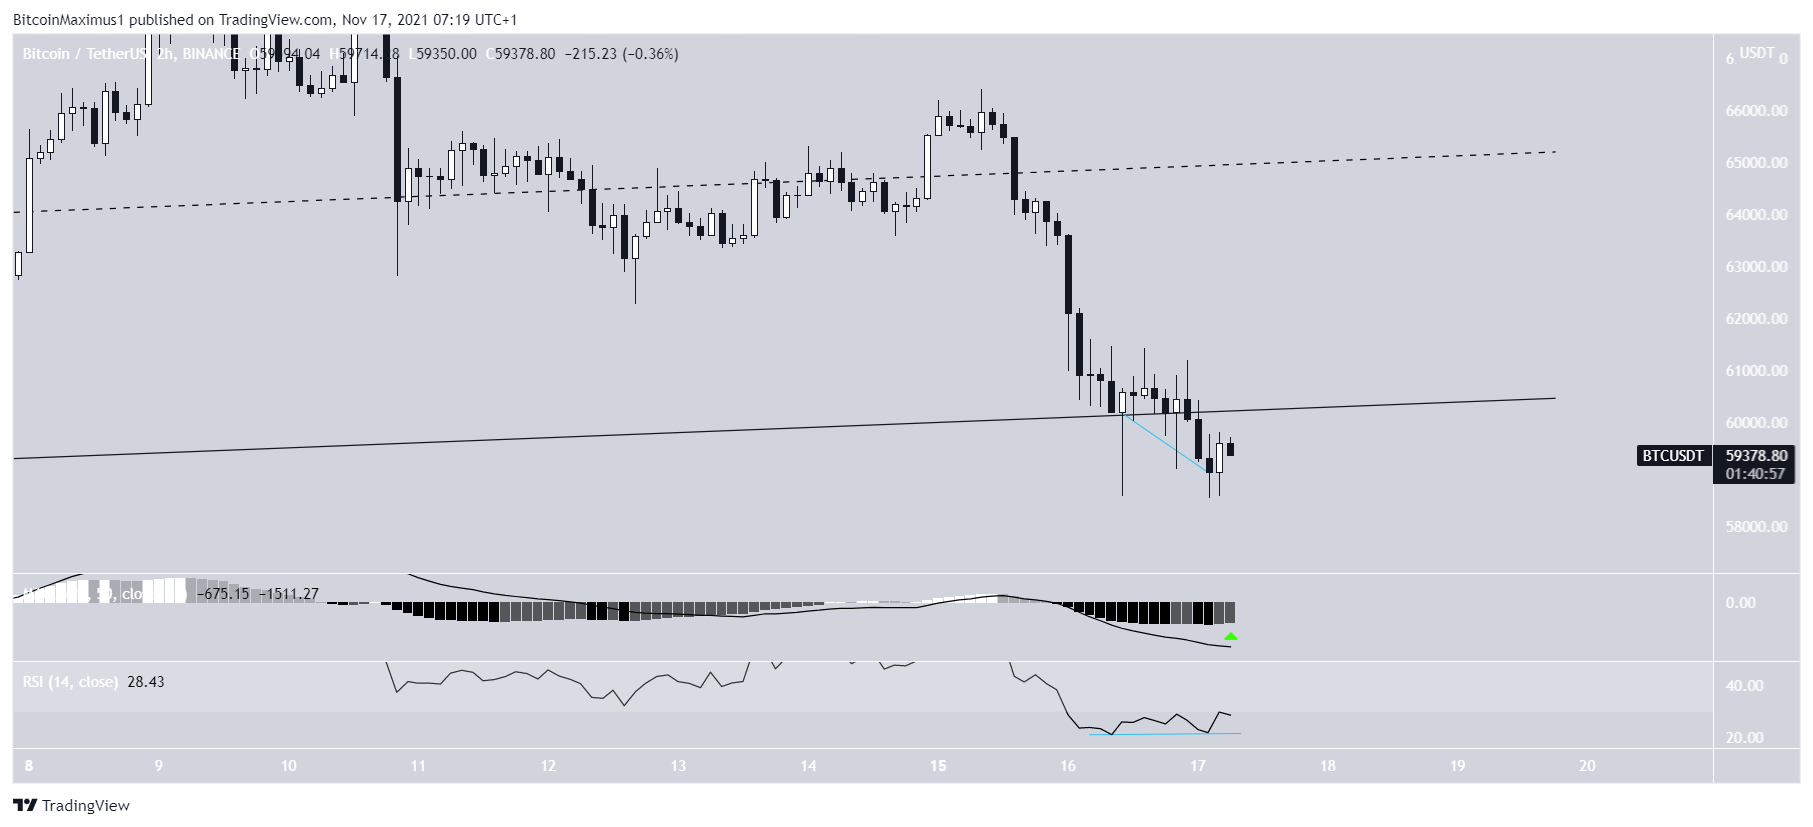
While there are very short-term bullish signs in place, such as the two-hour bullish divergence in the RSI, BTC has to reclaim the channel support line in order to potentially reverse into a bullish trend.
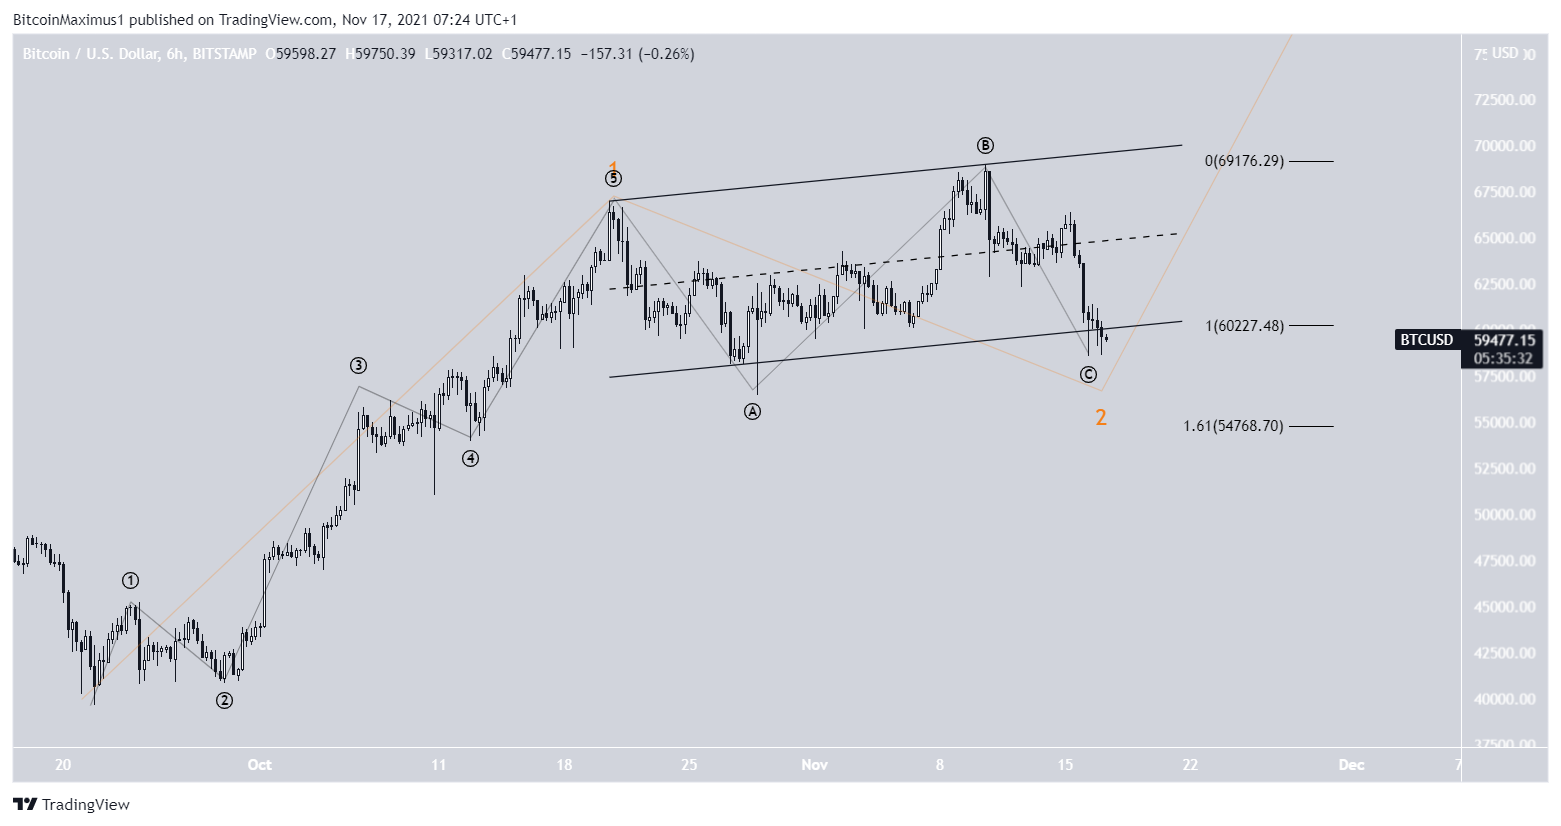
BTC wave count
The wave count indicates that BTC is in the C wave of an A-B-C corrective structure (black). This is normally the final wave that completes the correction. Afterward, an upward move would be expected.
Currently, waves A and C have a ratio of 1:1, which is the most common in such corrections. However, due to the ongoing breakdown, it’s possible that the length of the waves will develop to 1:1.61, the second most common ratio.
This would take the price close to the previously outlined support near $54,350.
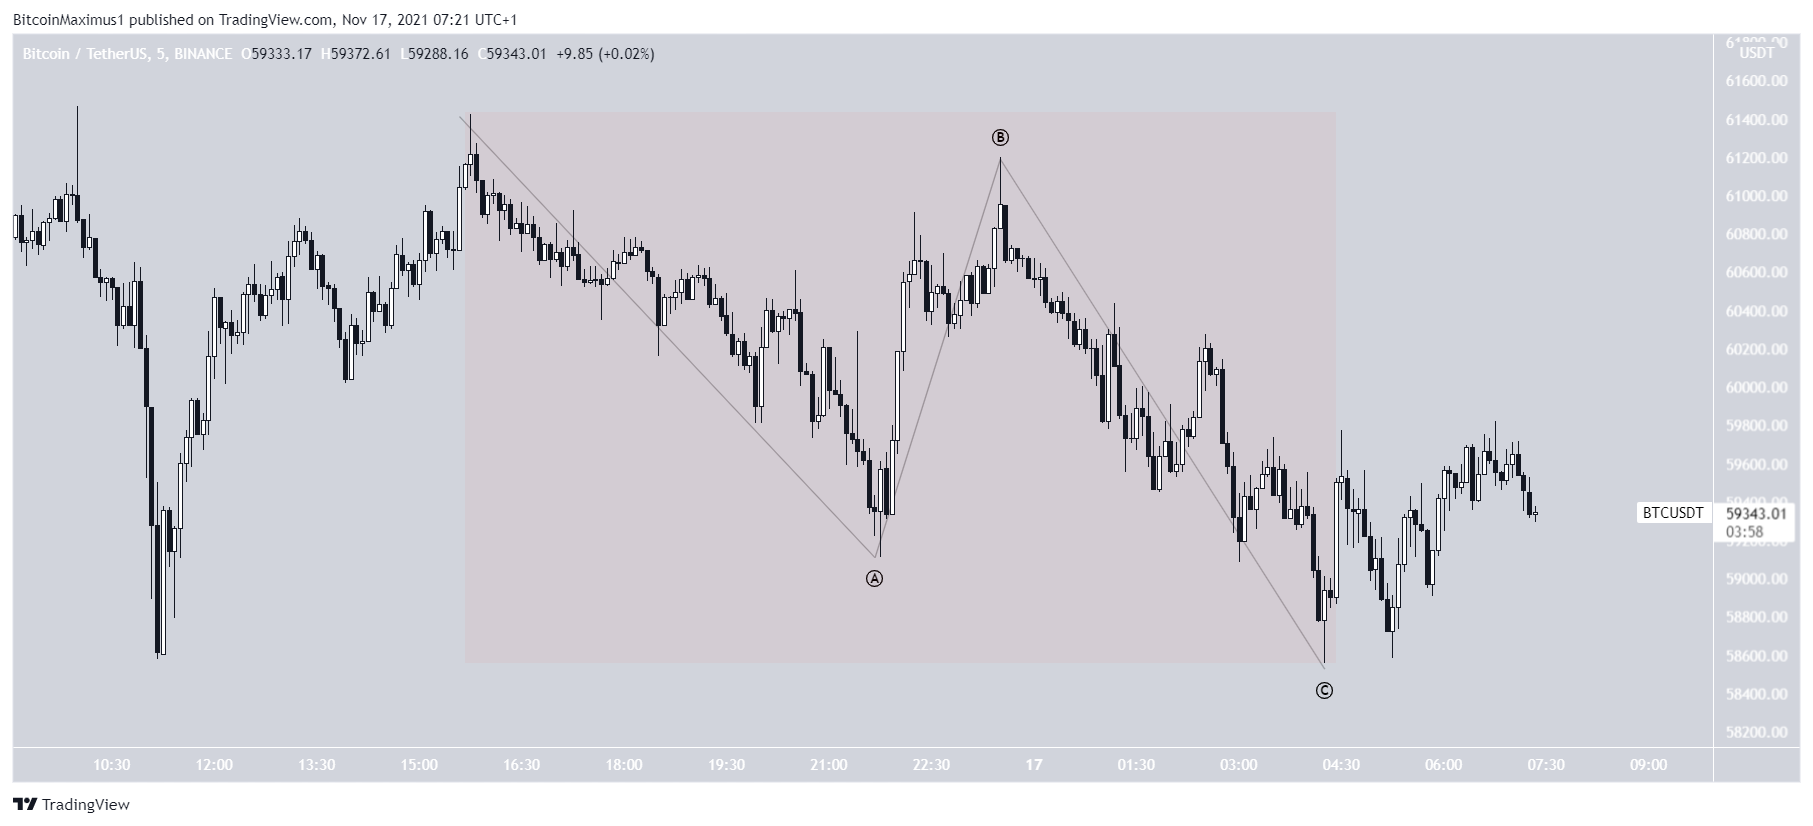
The five-minute chart shows that yesterday’s decrease looks very corrective (highlighted in red), potentially being part of another short-term A-B-C corrective structure. This means that it’s not the beginning of a new downward trend, but rather is a corrective decrease that will lead to a rebound in price.
A short-term bounce would be likely before a decrease towards the aforementioned support levels.
For BeInCrypto’s previous Bitcoin (BTC) analysis, click here.
Disclaimer
In line with the Trust Project guidelines, this price analysis article is for informational purposes only and should not be considered financial or investment advice. BeInCrypto is committed to accurate, unbiased reporting, but market conditions are subject to change without notice. Always conduct your own research and consult with a professional before making any financial decisions. Please note that our Terms and Conditions, Privacy Policy, and Disclaimers have been updated.
