

Bitcoin (BTC) is showing bullish signs in the short-term which could lead to a breakout from the current descending wedge pattern.
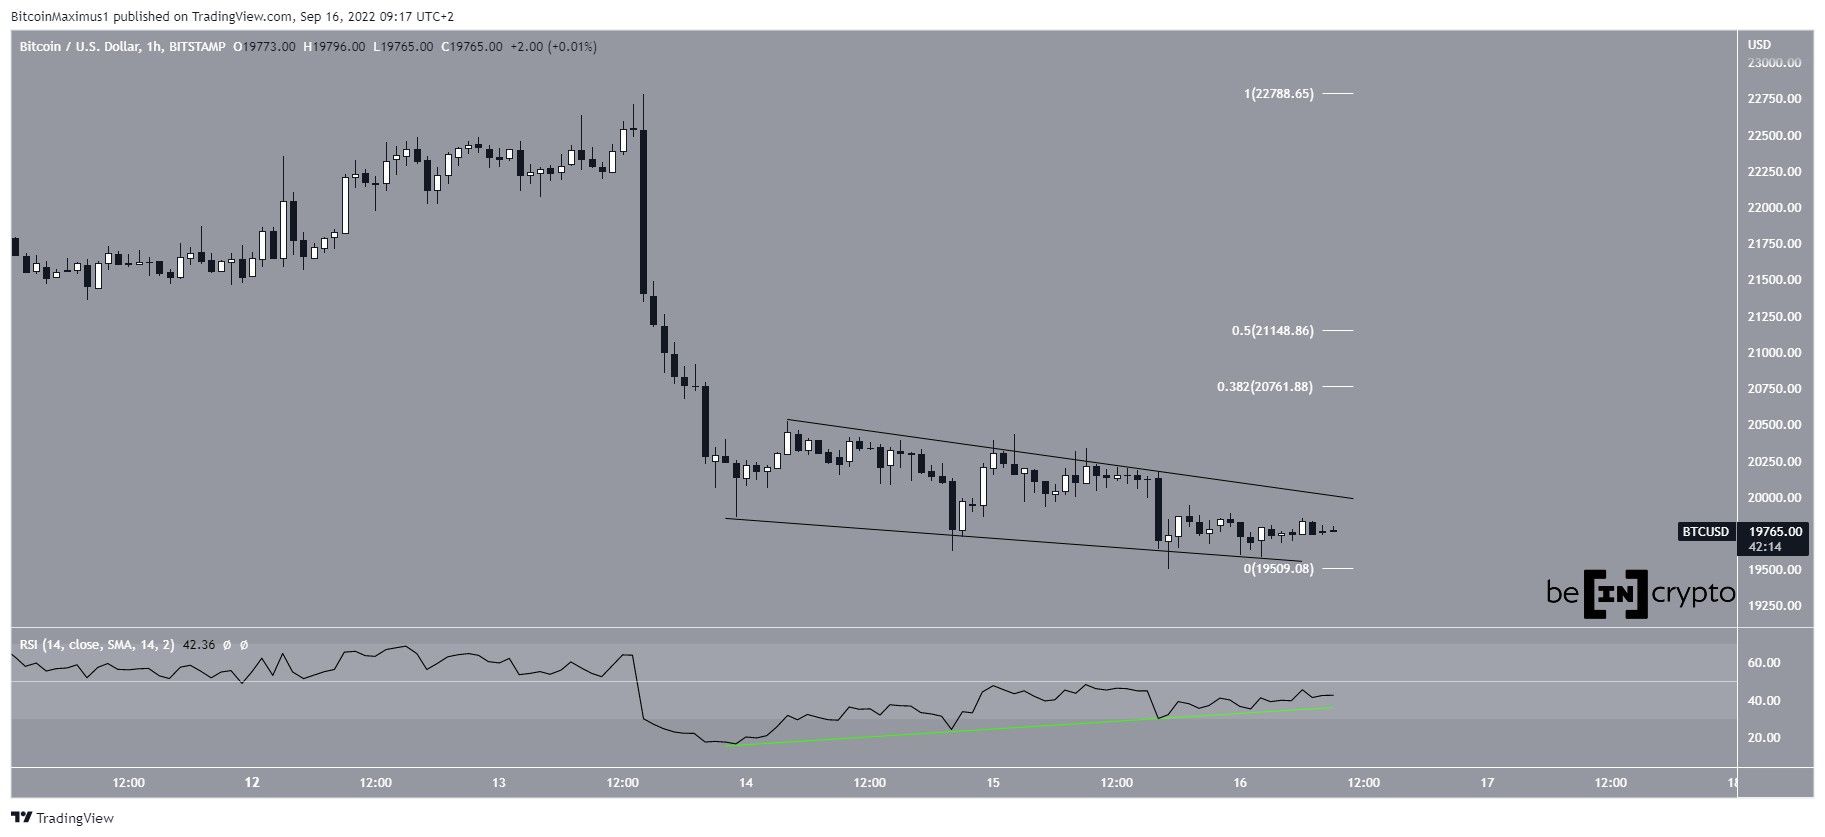
BTC has been falling since reaching a high of $22,781 on Sept. 13. The downward movement has so far led to a low of $19,500 on Sept. 15.
The latter portion of the decrease has been contained inside a descending wedge. The wedge is considered a bullish pattern, meaning that a breakout from it would be the most likely scenario.
Additionally, the two-hour RSI has generated bullish divergence (green line). So, these two factors combined to suggest that an eventual breakout from this wedge is expected.
If one occurs, the closest resistance levels would be at $20,760 and $21,150, created by the 0.382 and 0.5 Fib retracement resistance levels, respectively.
Wave count analysis
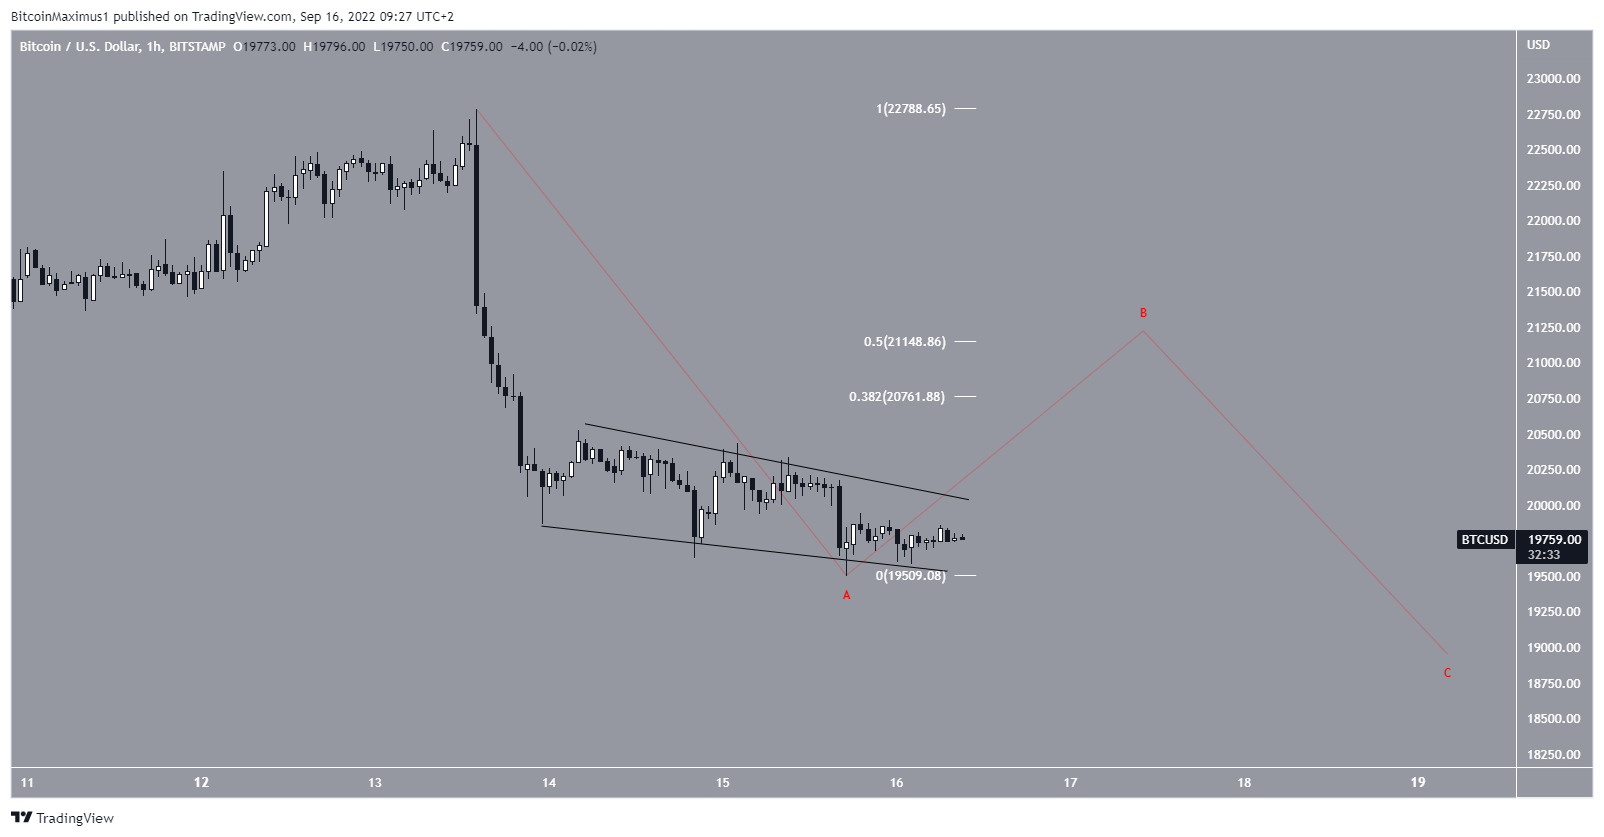
The BTC decrease since Sept. 13 looks like a five-wave downward movement. The shape of the wedge indicates that this is either a leading or an ending diagonal.
Therefore, it is likely that the decrease is part of the A wave of an A-B-C corrective structure. This count is also in alignment with the readings from the two-hour time frame.
If the count is correct, it would lead to a Bitcoin breakout and a B wave that moves towards the previously outlined resistance at $20,760 to $21,150. Afterward, another drop would be likely, completing the C wave in the process.
BTC dominance rate
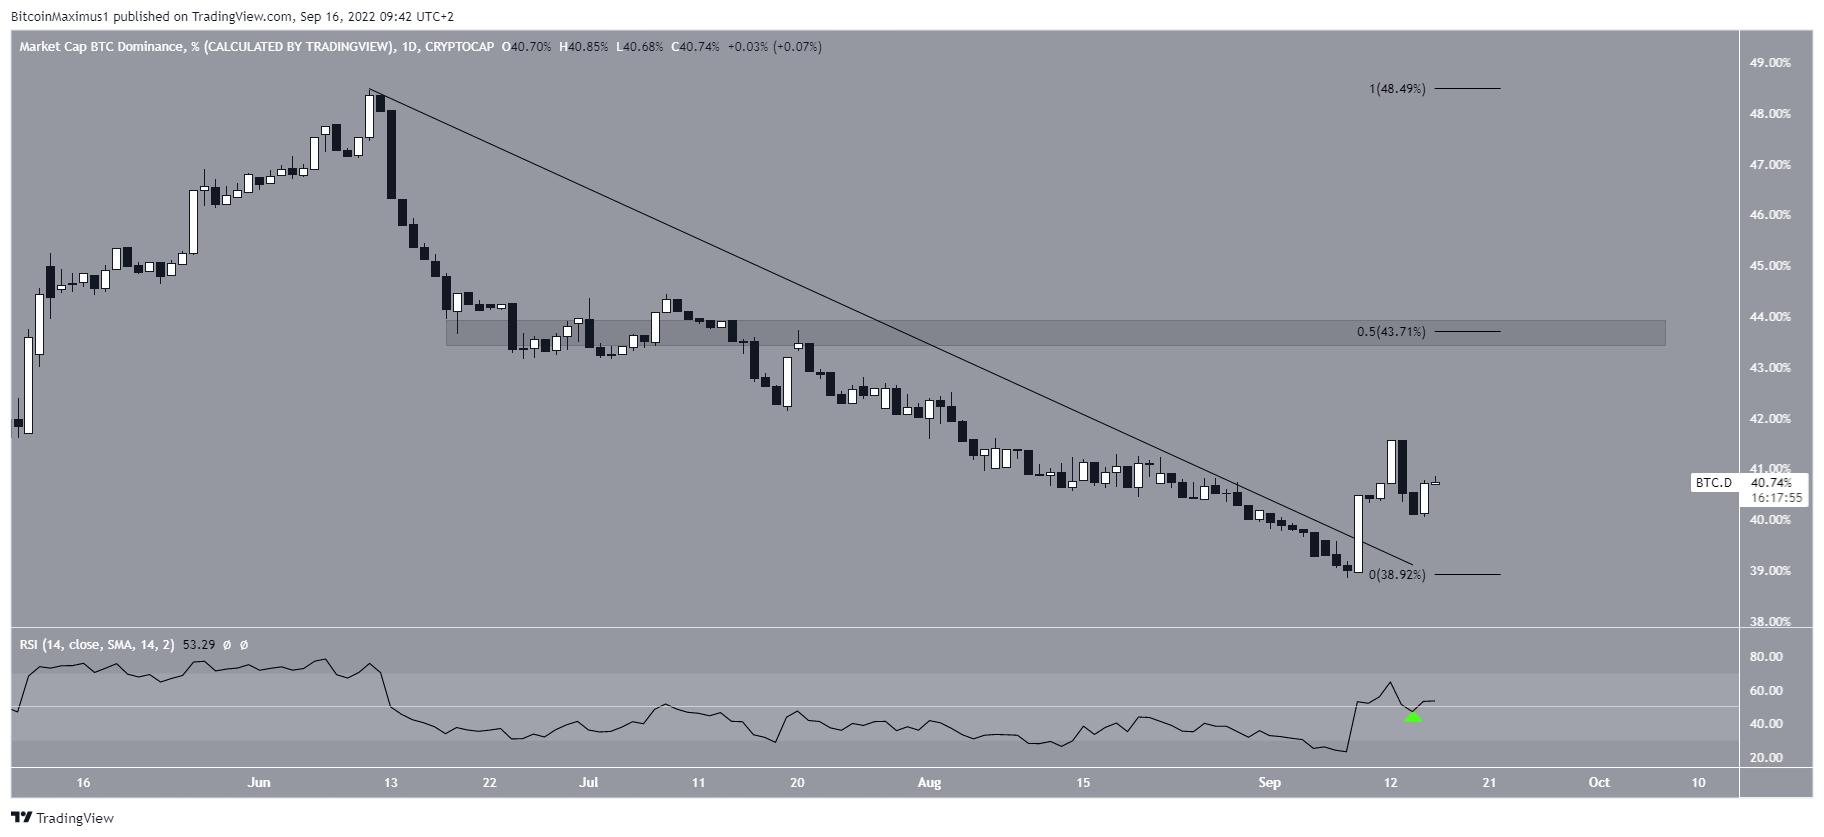
The Bitcoin dominance rate (BTCD) chart paints a bullish outlook. The rate has broken out from a descending resistance line that had previously been in place since June. Such breakouts usually lead to upward movements.
Moreover, the daily RSI has increased above 50 (green icon). This supports the legitimacy of the breakout. If the upward movement continues, the next closest resistance area would be at 43.70%.
For Be[in]Crypto’s previous Bitcoin (BTC) analysis, click here
Disclaimer
In line with the Trust Project guidelines, this price analysis article is for informational purposes only and should not be considered financial or investment advice. BeInCrypto is committed to accurate, unbiased reporting, but market conditions are subject to change without notice. Always conduct your own research and consult with a professional before making any financial decisions. Please note that our Terms and Conditions, Privacy Policy, and Disclaimers have been updated.
