


After reaching an all-time high on Jan. 3, Bitcoin (BTC) fell the day after, creating successive bearish daily candlesticks.
Bitcoin is expected to break down from its short-term pattern and decrease towards the support levels outlined below.
Bitcoin Rally Stalls
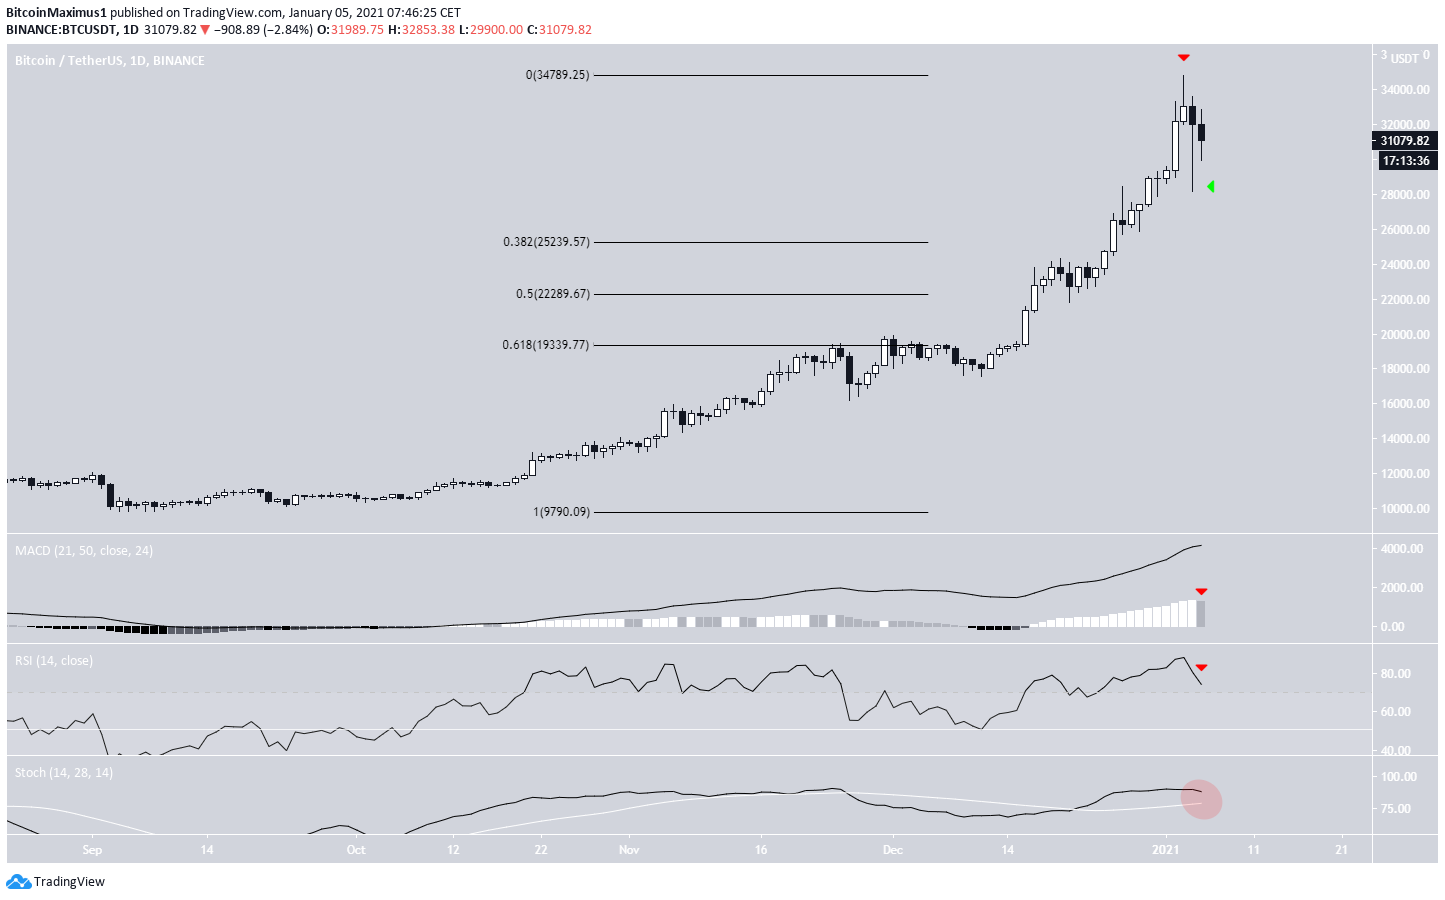
After reaching an all-time high price of $34,789 on Jan. 3, BTC stalled the next day, dropping all the way to a low of $28,130. However, it proceeded to create a long lower wick (shown with the green arrow in the image below) and reach a close of $31,988.
While the lower wick is a bullish sign, the candlestick is not. BTC so far has created two bearish candlesticks, a shooting star on Jan. 3 and a hanging man on Jan. 4 — both normally considered bearish reversal signs.
Despite the bearish candlesticks, technical indicators do not yet confirm the bearish reversal. While the MACD has generated a lower volume bar on the daily, it has yet to reach a close. Furthermore, the Stochastic oscillator has not yet made a bearish cross nor has the RSI crossed down below 70.
If a downward move were to occur, the three closest support levels would be found at $25,230, $22,290 and $19,340 (0.382, 0.5, and 0.618 Fib retracement levels respectively). Besides being Fib levels, the latter two also provide horizontal support.
Short-Term BTC Movement
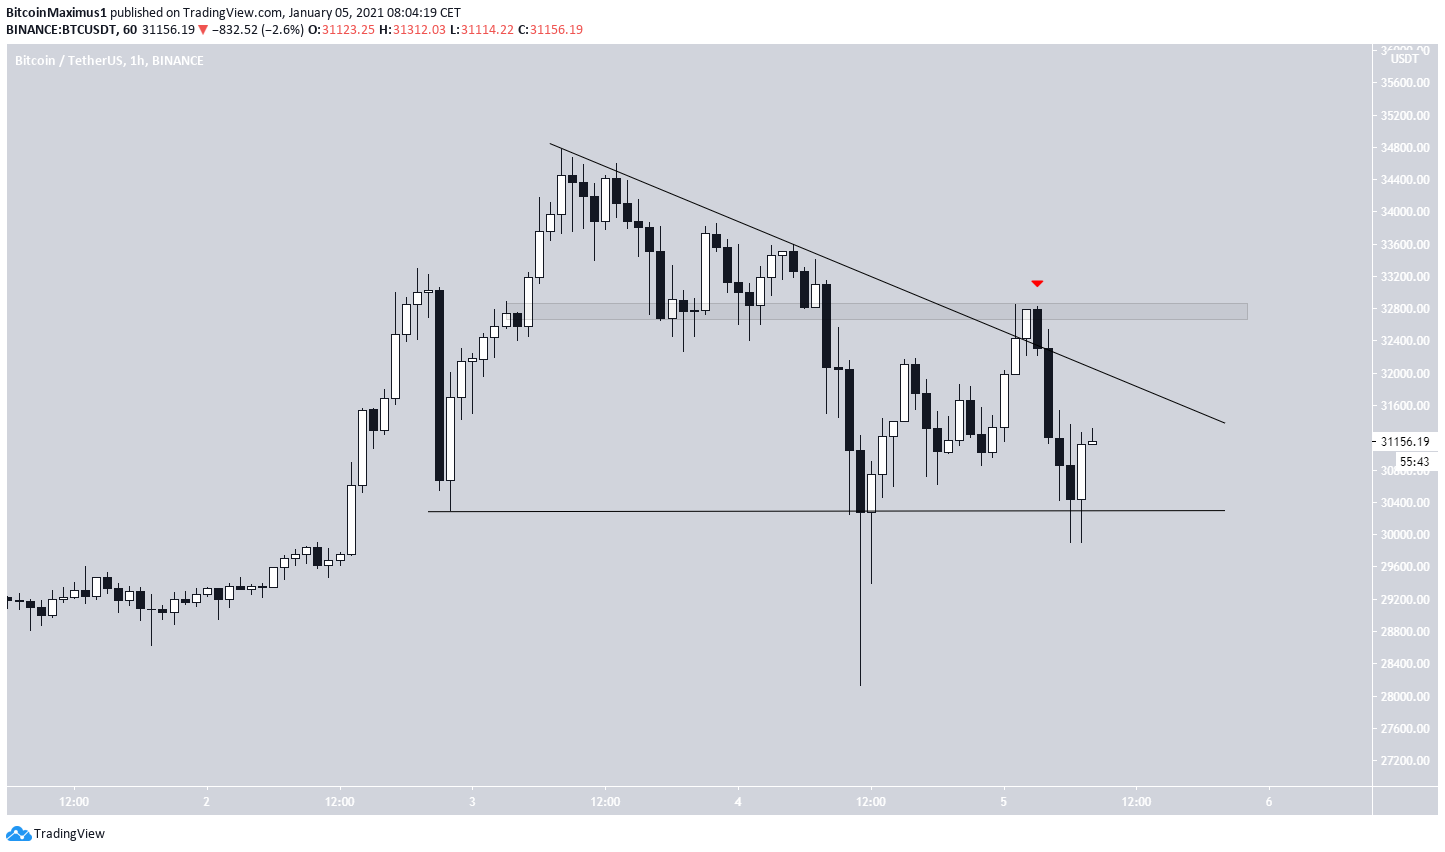
The two-hour chart also provides a somewhat bearish outlook.
First, we can see that BTC is possibly trading inside a descending triangle, which is considered a bearish reversal pattern.
Second, BTC appeared to have broken out from this pattern last night but was rejected by the $32,800 resistance area (red arrow), making the previous breakout only a deviation.
Therefore, until BTC is able to successfully break out and reclaim the $32,800 minor resistance area, the trend is considered bearish and a breakdown is expected.
A breakdown that travels the entire height of the pattern would take BTC down to $25,240, close to the 0.382 Fib retracement level from the previous section.
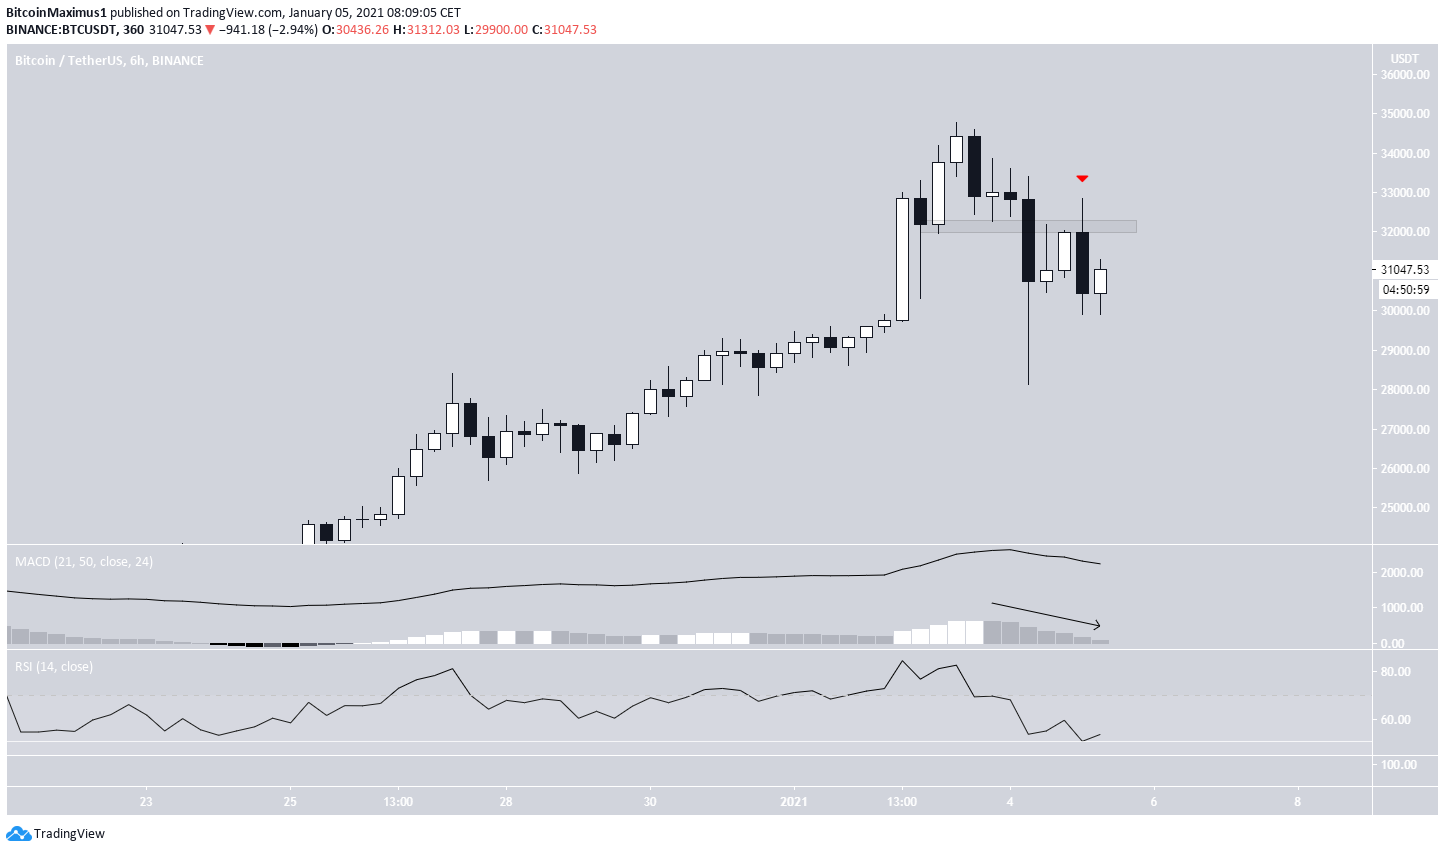
This view is supported by the six-hour time-frame, which similarly shows that the previous support area has turned to resistance, rejecting BTC last night and leaving a long upper wick in place.
Technical indicators have also turned bearish, supporting the possibility of a breakdown.
Conclusion
Bitcoin is expected to break down from its descending triangle and gradually decrease towards the closest support area at $25,240.
For BeInCrypto’s previous Bitcoin (BTC) analysis, click here!
Disclaimer: Cryptocurrency trading carries a high level of risk and may not be suitable for all investors. The views expressed in this article do not reflect those of BeInCrypto.


