Bitcoin Price Highlights
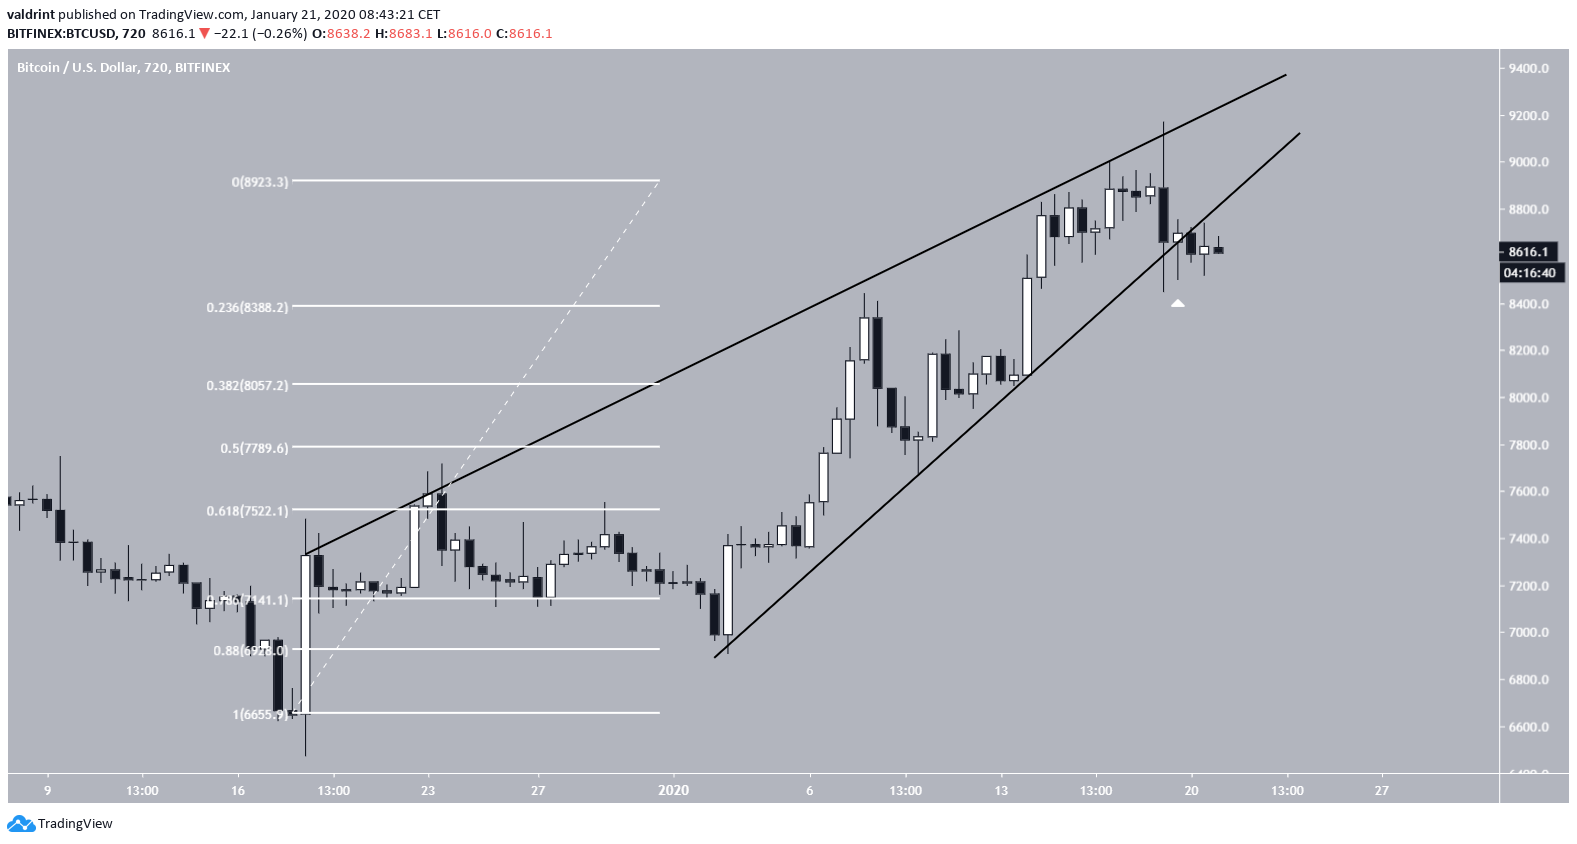
- The Bitcoin price has broken down from an ascending wedge.
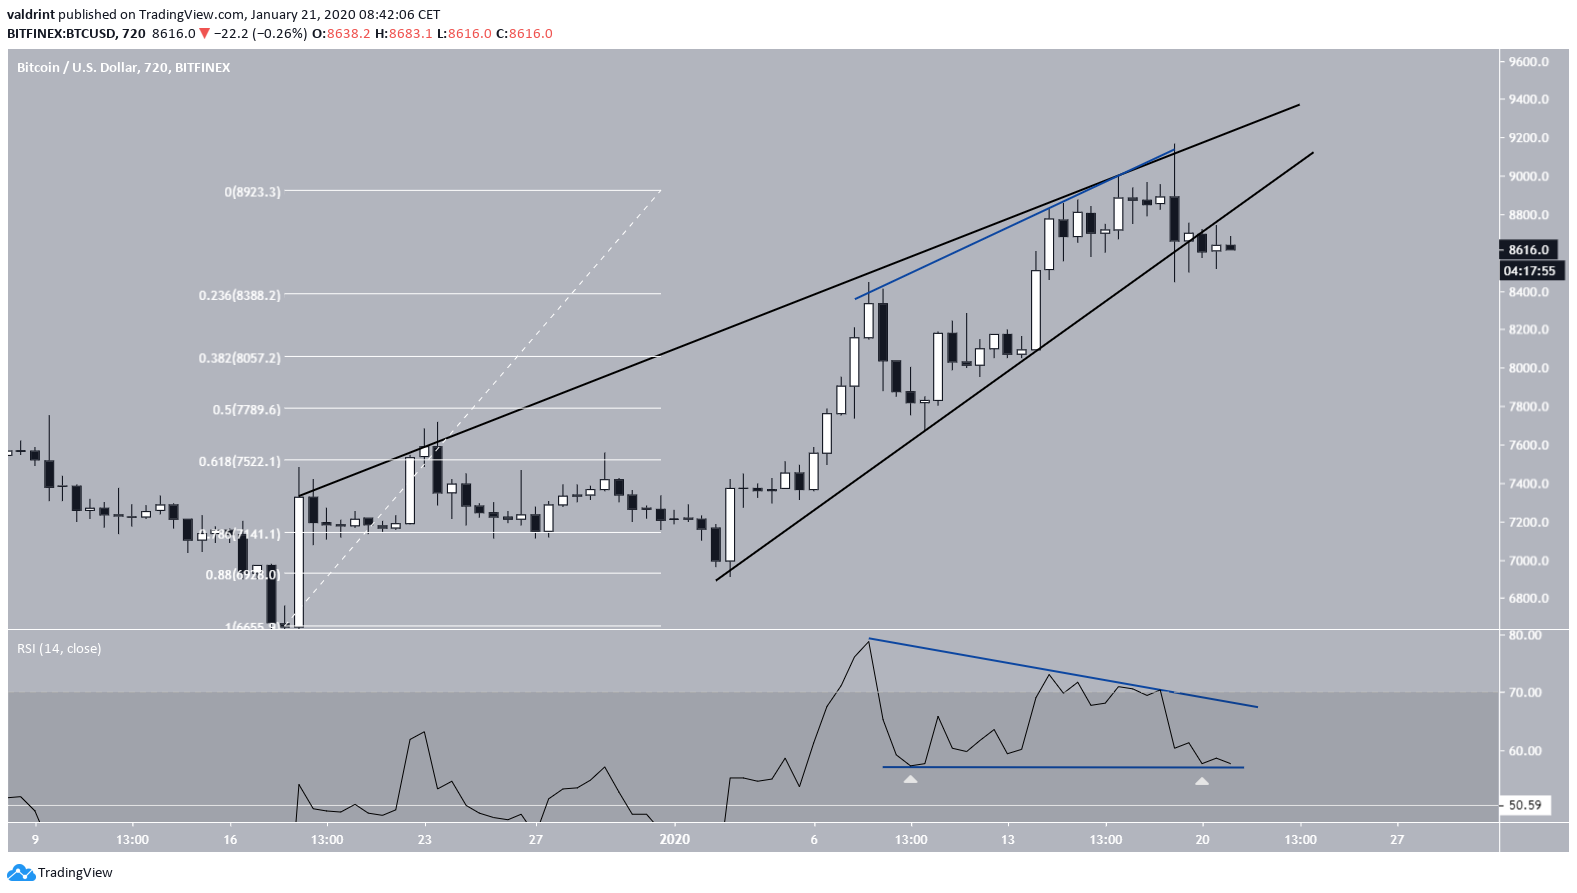
- The RSI has generated bearish divergence.
- It has yet to create a failure high swing.
- The RSI has possibly created a descending triangle.
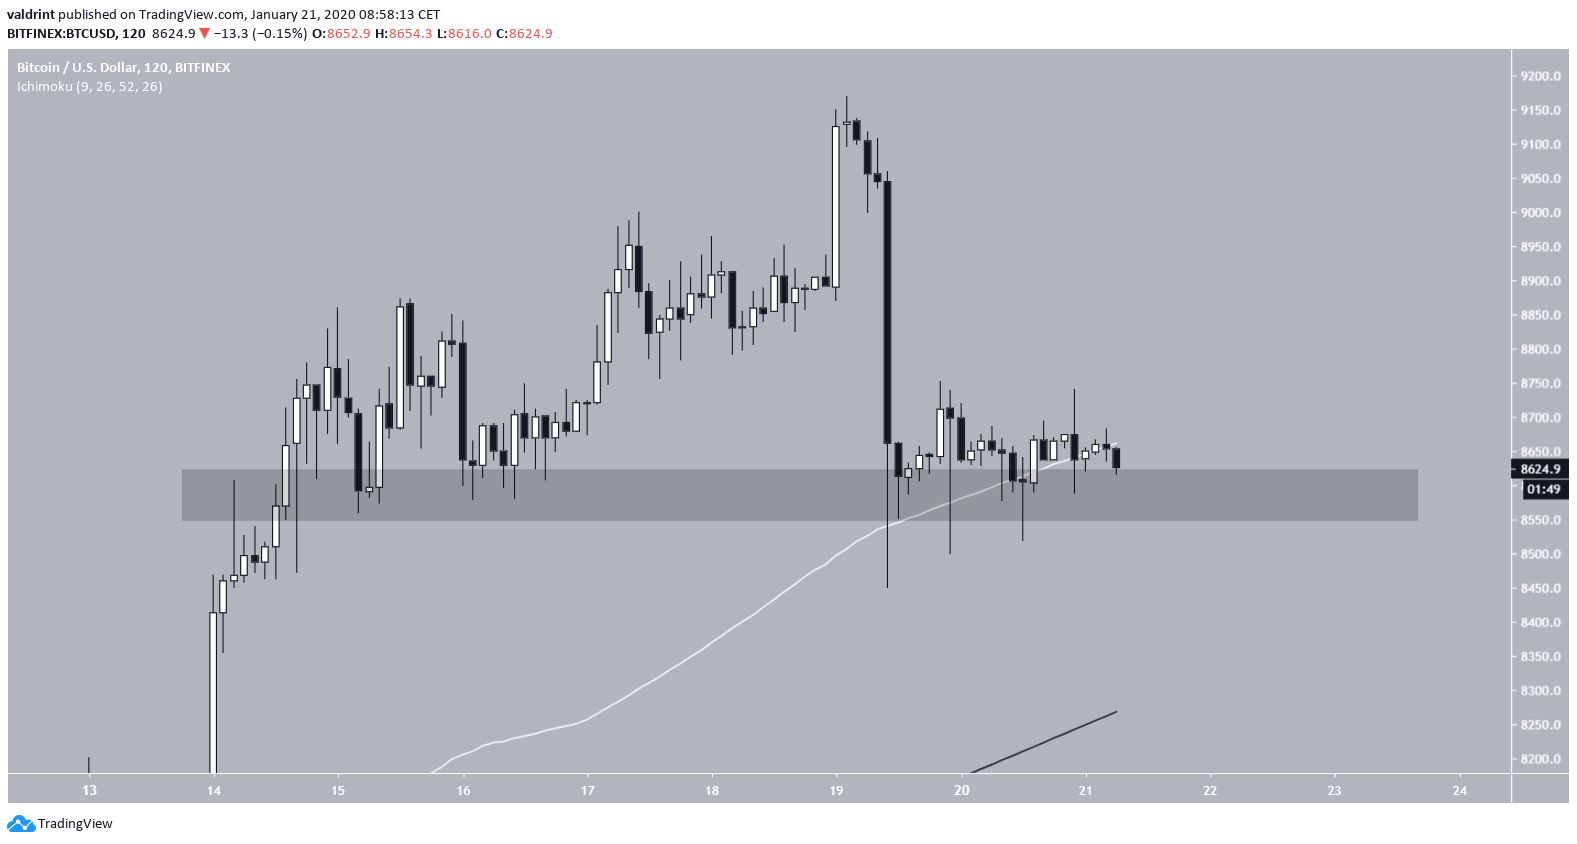
- There is support at $8,600.
- The price has found support above the 100-hour moving average.
Bitcoin Ascending Wedge
The Bitcoin price had been trading inside an ascending wedge since Dec 18, 2020. On Jan 19, 2020, the price reached a high of $9,169 and created a bearish engulfing candlestick. Afterward, it retraced to the $8,600 level and has been stuck there since. The horizontal movement has caused it to decrease below the ascending support line of the wedge, causing a breakdown. But, the breakdown has not been swift, rather the price has simply consolidated near this level. Whether this uncertainty is a failure of the bulls to push the price up or weakness from the bears that are attempting to cause the breakdown remains to be seen.
RSI Failure Swing High
The price decrease was preceded by a bearish divergence in the RSI. However, it has yet to create a failure high swing. While the RSI has generated a lower-high in response to the price’s higher-high (bearish divergence), it has failed to create a lower-low relative to the RSI low after the original high. Instead, it has generated an identical low, creating a descending triangle in the process. The RSI pattern can be useful in predicting price behavior. The most likely movement now seems to be further consolidation inside the RSI triangle before a breakdown. The breakdown would invalidate the descending triangle and could cause a failure high swing.
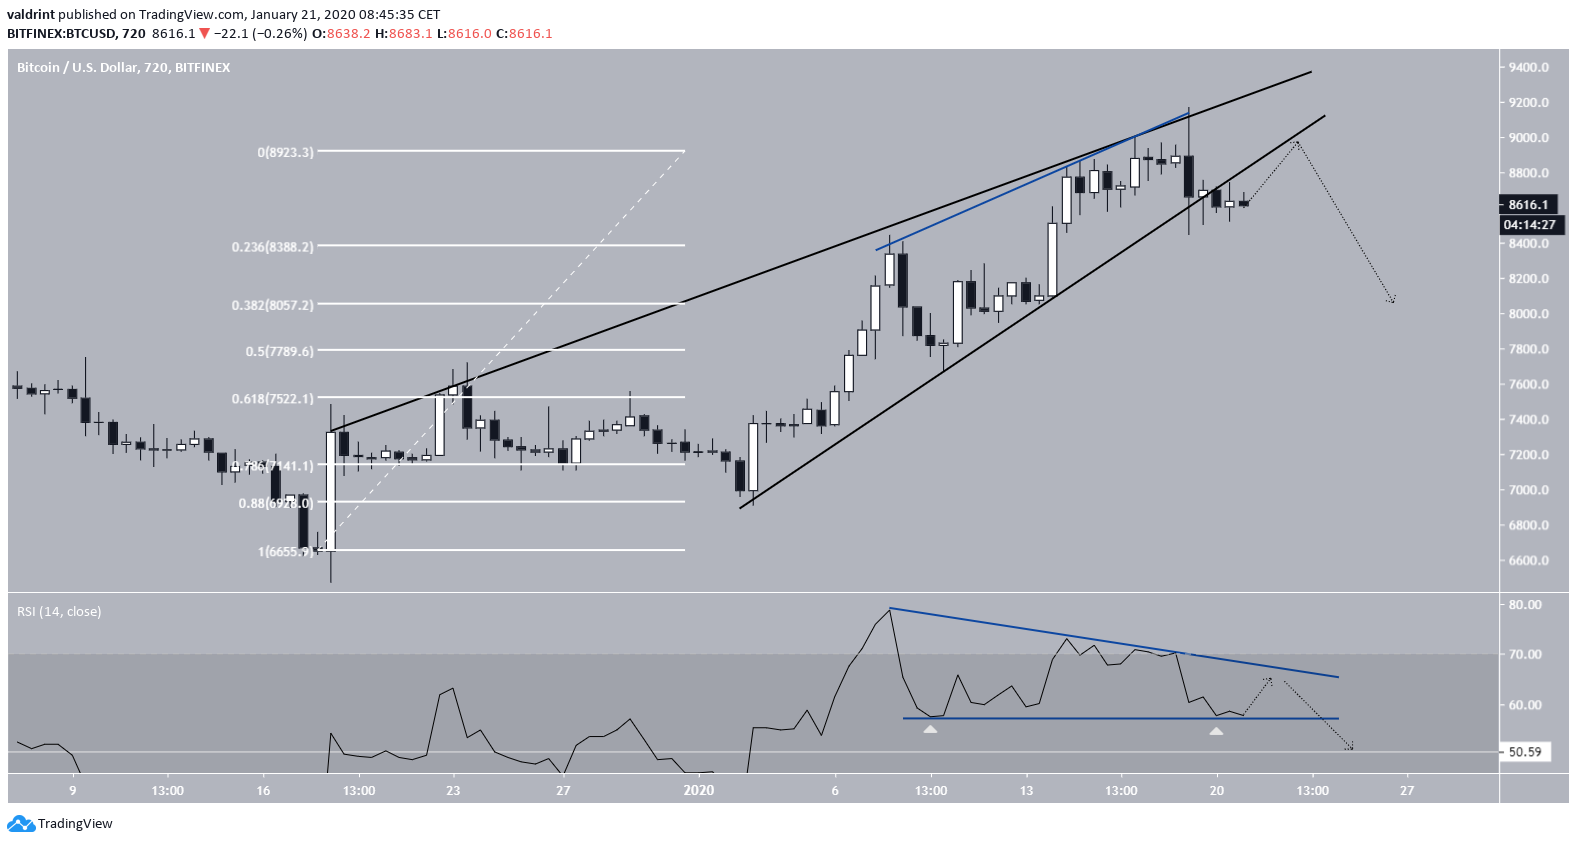
Since the RSI and the price are generally moving in the same direction, an RSI move to touch the resistance line of the triangle would be combined with an upward move in the price that could validate the ascending support line before a breakdown.
If this movement were to occur, possible shorts could be initiated at the touch of the ascending support line.

Short-Term Support
In the short-term, the price has found support above $8,600. This support area is strengthened by the presence of the 100-day moving average (MA), which has almost been broken as bears attempt to drown it underneath. A price decrease below this area would invalidate the setup outlined above and likely cause the price to reach the support offered by the 400-hour MA near $8,300. To conclude, the Bitcoin price has broken down below an ascending wedge. It is likely that the price will validate the ascending support line before decreasing towards the low $8,000s.
For our previous analysis, click here.
Disclaimer
In line with the Trust Project guidelines, this price analysis article is for informational purposes only and should not be considered financial or investment advice. BeInCrypto is committed to accurate, unbiased reporting, but market conditions are subject to change without notice. Always conduct your own research and consult with a professional before making any financial decisions. Please note that our Terms and Conditions, Privacy Policy, and Disclaimers have been updated.

Valdrin Tahiri
Valdrin discovered cryptocurrencies while he was getting his MSc in Financial Markets from the Barcelona School of Economics. Shortly after graduating, he began writing for several different cryptocurrency related websites as a freelancer before eventually taking on the role of BeInCrypto's Senior Analyst.
(I do not have a discord and will not contact you first there. Beware of scammers)
READ FULL BIO
Sponsored
Sponsored

![Bitcoin Analysis for 2020-01-21 [Premium Analysis]](https://beincrypto.com/wp-content/uploads/2020/01/bic_BTC_sec.jpg.optimal.jpg)