Bitcoin Price Highlights
- The Bitcoin price is trading inside of an ascending wedge.
- It created a bearish engulfing candlestick on January 19.
- The price is not reacting to its long-term pattern.
- The 200-day moving average (MA) is offering strong resistance to the price.
- There is support between $7500-$7800.
- There is resistance between $9000-$9200.
Bitcoin in an Ascending Wedge
The Bitcoin price has been trading inside an ascending wedge since December 18, 2019. On January 19, the price initiated a rapid decrease and created a large bearish candlestick with a long upper wick. However, the price respected the support line of the wedge and did not break down. While volume was significant during the price decrease, it was not out of the ordinary — failing to be the candlestick with the biggest volume throughout the wedge. There is a continuing bearish divergence in the RSI. Due to the relatively-average volume of the decrease, we are not discounting the possibility that the price creates a higher high inside the wedge before eventually breaking down. If so, the likeliest reversal area is found between $7500-$7800, the 0.5-0.618 Fib levels.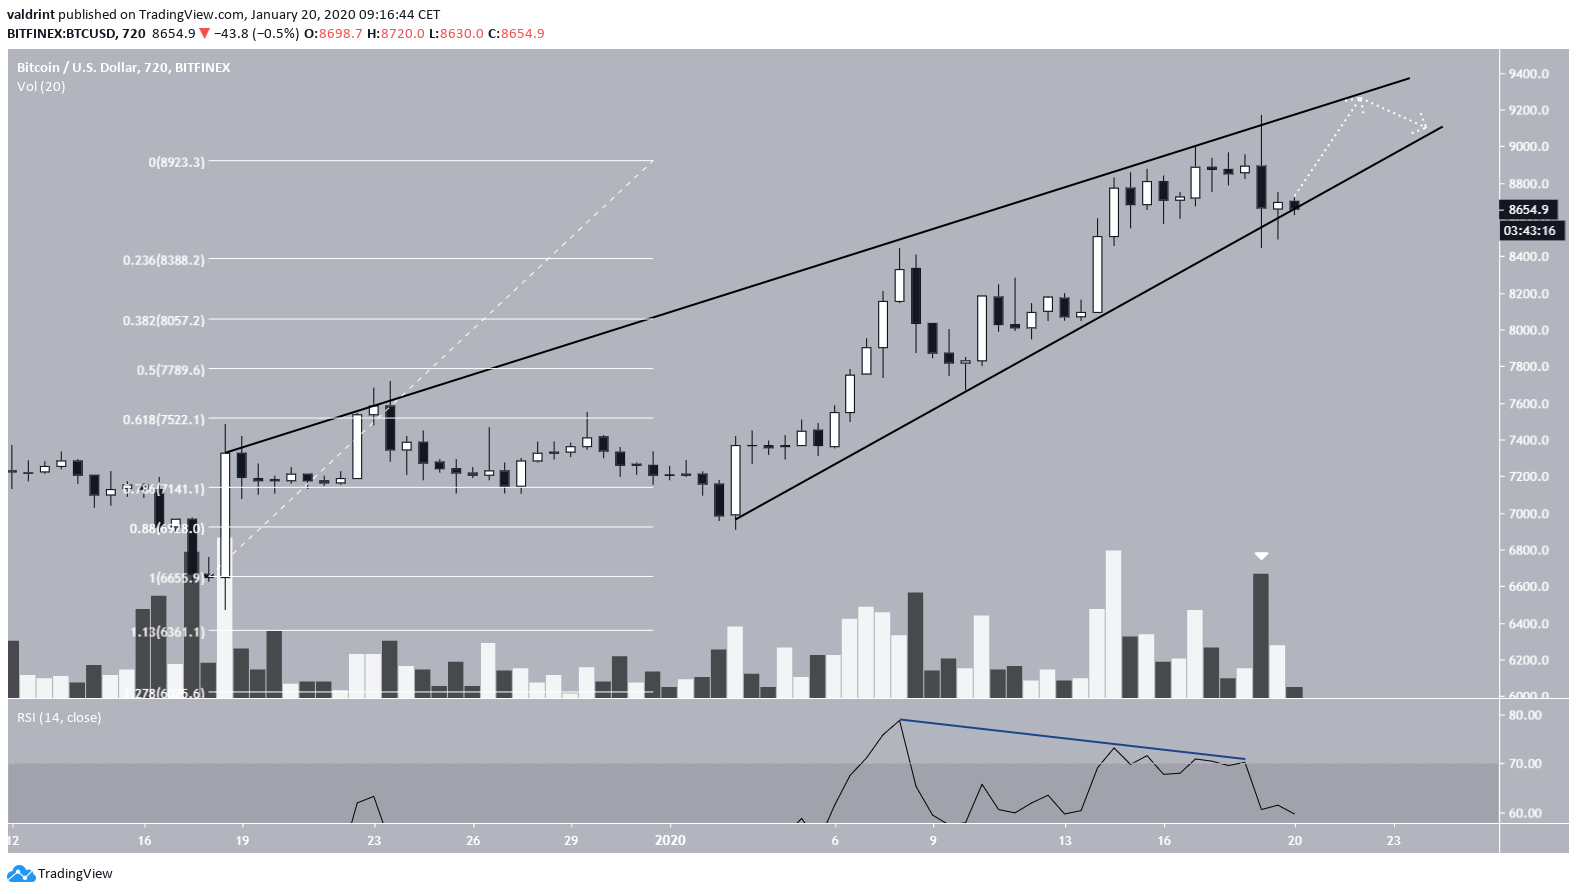
Long-Term Pattern
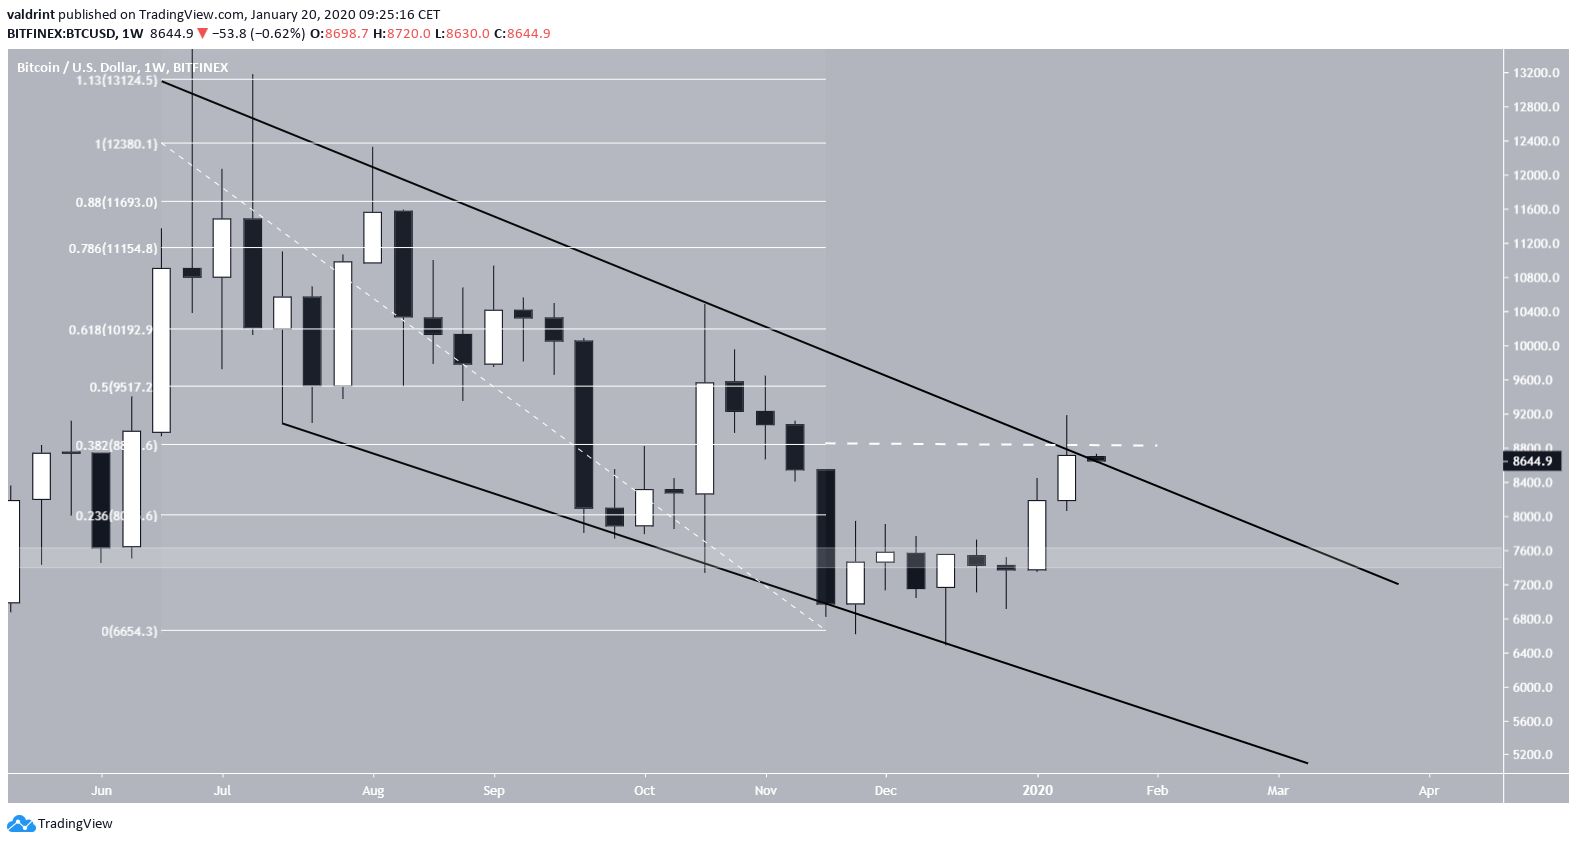
Previously, we have thought that the Bitcoin price had been trading inside a descending channel since June 24, 2019. However, last week’s movement has cast some doubt into that. The price has moved above the descending resistance line without showing any type of reaction at all and is currently in the process of moving below it. Therefore, it is possible that the price had been trading inside a descending wedge instead, out of which it broke out and validated afterward on January 10, 2020. However, the price has decreased as soon as it reached the 200-day MA, confirming its significance.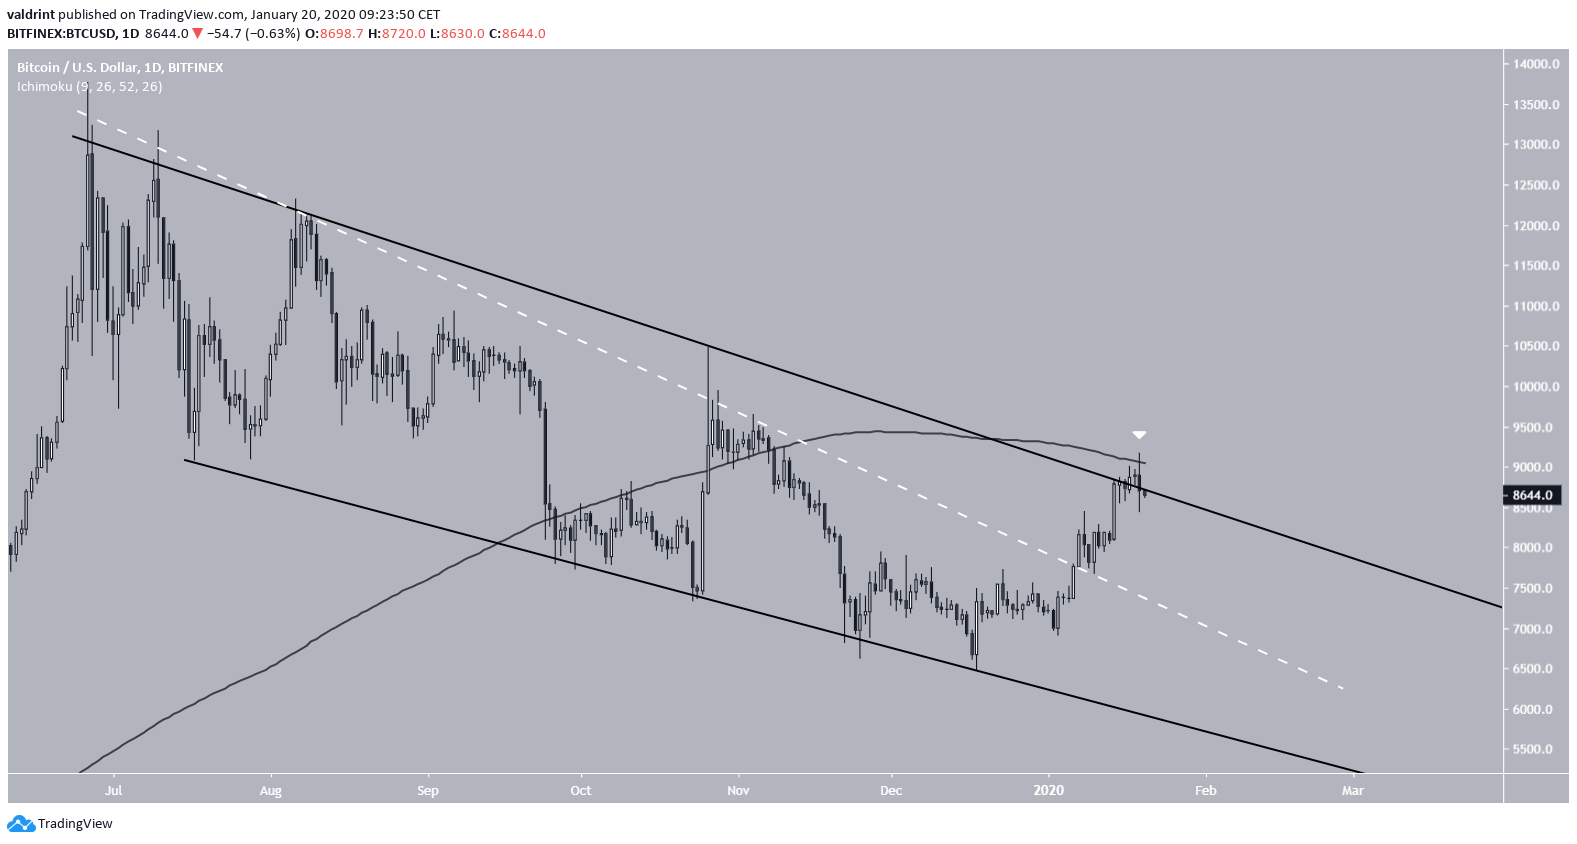 In the weekly time-frame, the channel is still intact. The Bitcoin price breakout was an upper wick and the weekly close was below the resistance line of the channel and the 0.382 Fib level.
Therefore, we have come to a standstill on the long-term pattern. While it seems likely that we are in the first stages of a reversal, due to the failure to sustain the lower price level on November-December 2019, we are unsure of the resistance line of the pattern.
Future Movement
Putting aside the pattern and looking at the significant resistance and support areas, these are found at $9000-$9200 and $7600-$7800, respectively. Therefore, if the movement proposed in the initial section occurs, we would have the price increase within the ascending wedge, going inside the resistance area at $9000-$9200, before breaking down and possibly reaching the support at $7500-$7800.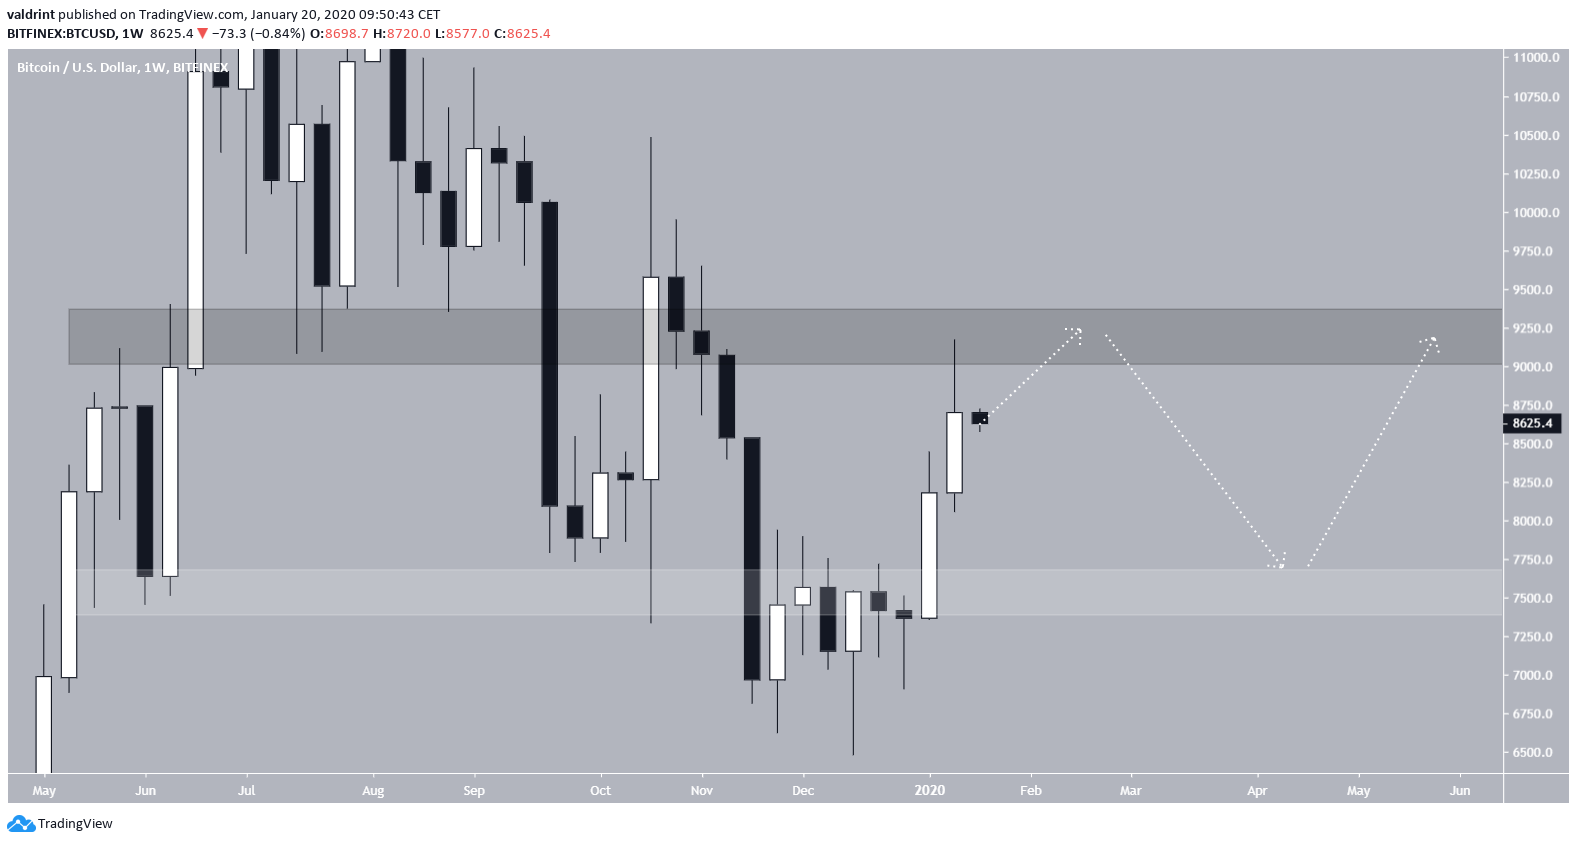 Therefore, we are expecting the Bitcoin price to consolidate between these two areas for the foreseeable future. This hypothesis also fits in with our long-term logarithmic support lines and the halving angle, in which the price gradually increases prior to halving before accelerating the rate of increase afterward.
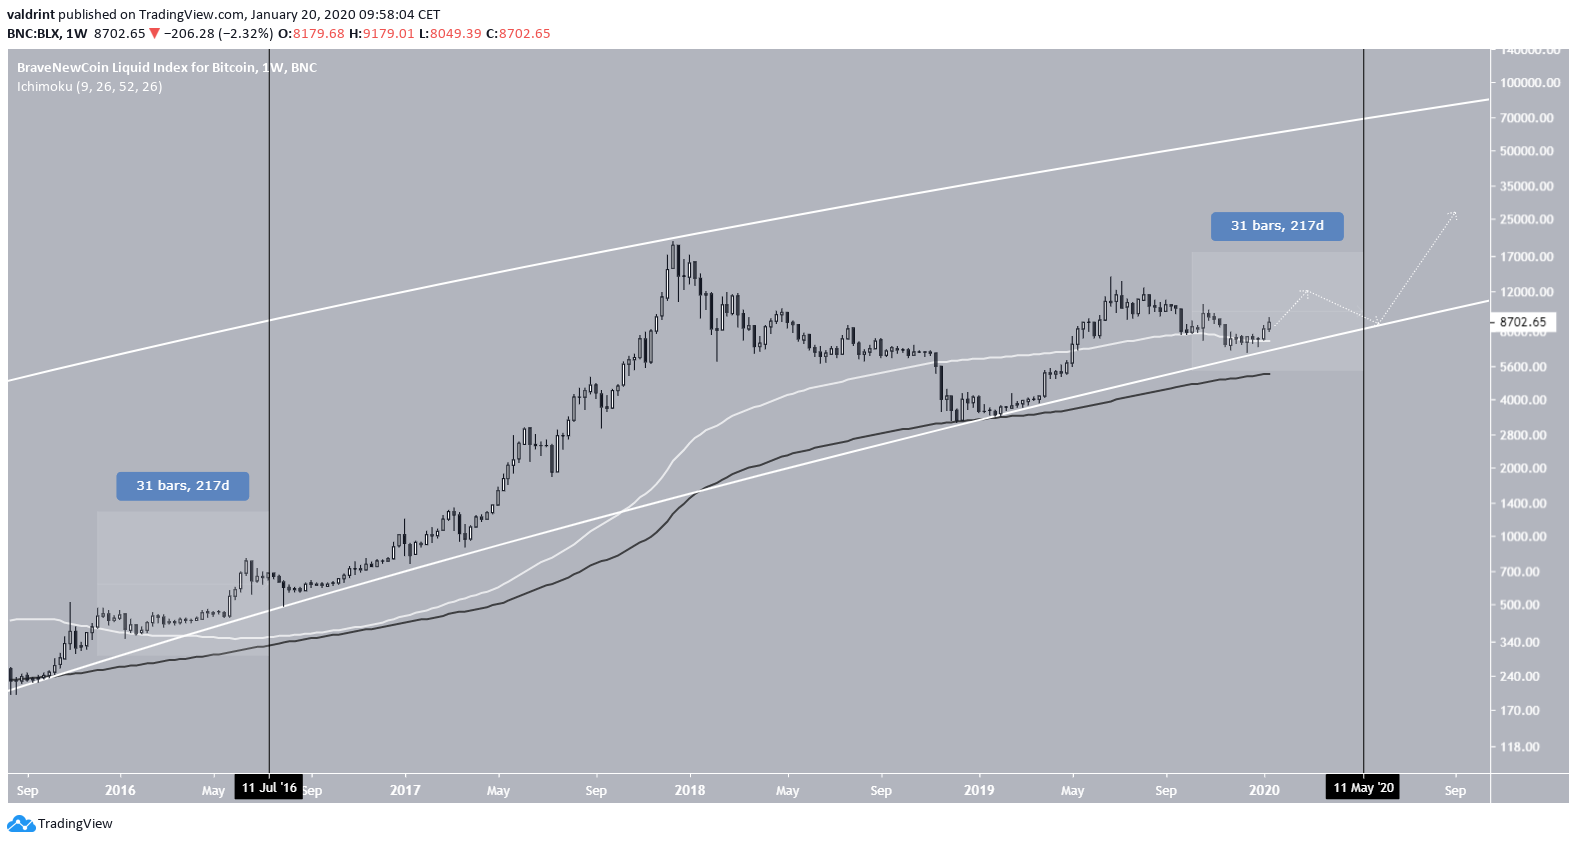 To conclude, the Bitcoin price initiated a rapid decrease on January 19 but has yet to break out from the wedge. We believe it will eventually do so and begin a period of consolidation between $7600-$9200. The long-term outlook remains bullish.
For our previous analysis, click here.
Top crypto projects in the US | April 2024
Trusted
Disclaimer
In line with the Trust Project guidelines, this price analysis article is for informational purposes only and should not be considered financial or investment advice. BeInCrypto is committed to accurate, unbiased reporting, but market conditions are subject to change without notice. Always conduct your own research and consult with a professional before making any financial decisions. Please note that our Terms and Conditions, Privacy Policy, and Disclaimers have been updated.

Valdrin Tahiri
Valdrin discovered cryptocurrencies while he was getting his MSc in Financial Markets from the Barcelona School of Economics. Shortly after graduating, he began writing for several different cryptocurrency related websites as a freelancer before eventually taking on the role of BeInCrypto's Senior Analyst.
(I do not have a discord and will not contact you first there. Beware of scammers)
READ FULL BIO
Sponsored
Sponsored
![Bitcoin Analysis for 2020-01-20 [Premium Analysis]](https://beincrypto.com/wp-content/uploads/2020/01/bic_dollar_bitcoin.jpg.optimal.jpg)