

Axie Infinity (AXS) is showing compelling signs that the downward movement that has been ongoing since the all-time high price has come to an end.
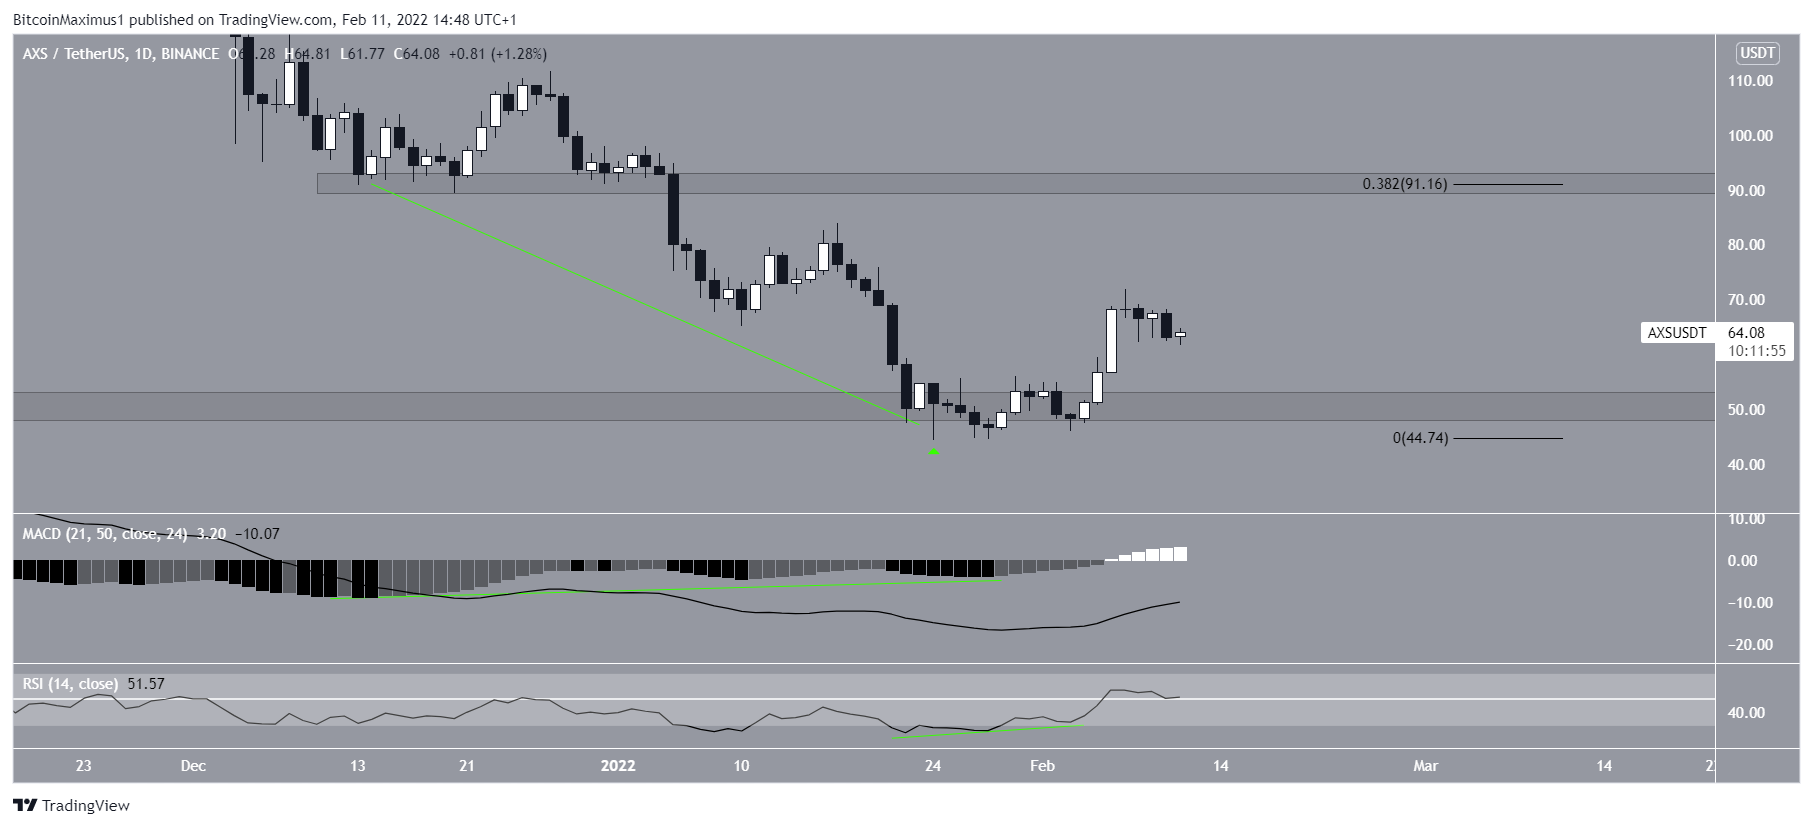
AXS has been falling since Nov. 6, when it reached an all-time high price of $166. The downward movement continued until a low of $44.42 was reached on Jan. 24. Measuring from the all-time high, this amounted to a decrease of 73%.
However, AXS seemingly reversed its trend afterwards and has been increasing since. The bounce also served to validate the $51 horizontal area as support. The area had previously acted as resistance on July 2021, and then turned to support in September of the same year.
The closest resistance area is at $91. This is the 0.382 Fib retracement resistance level and a horizontal resistance area.

Indicator support increase
A look at technical indicators for AXS supports the continuation of the upward movement. The bounce was preceded by a significant bullish divergence in both the RSI and the MACD. This divergence was more pronounced in the latter.
Furthermore, the RSI has now moved above 50. The RSI is a momentum indicator and readings above 50 are considered bullish.
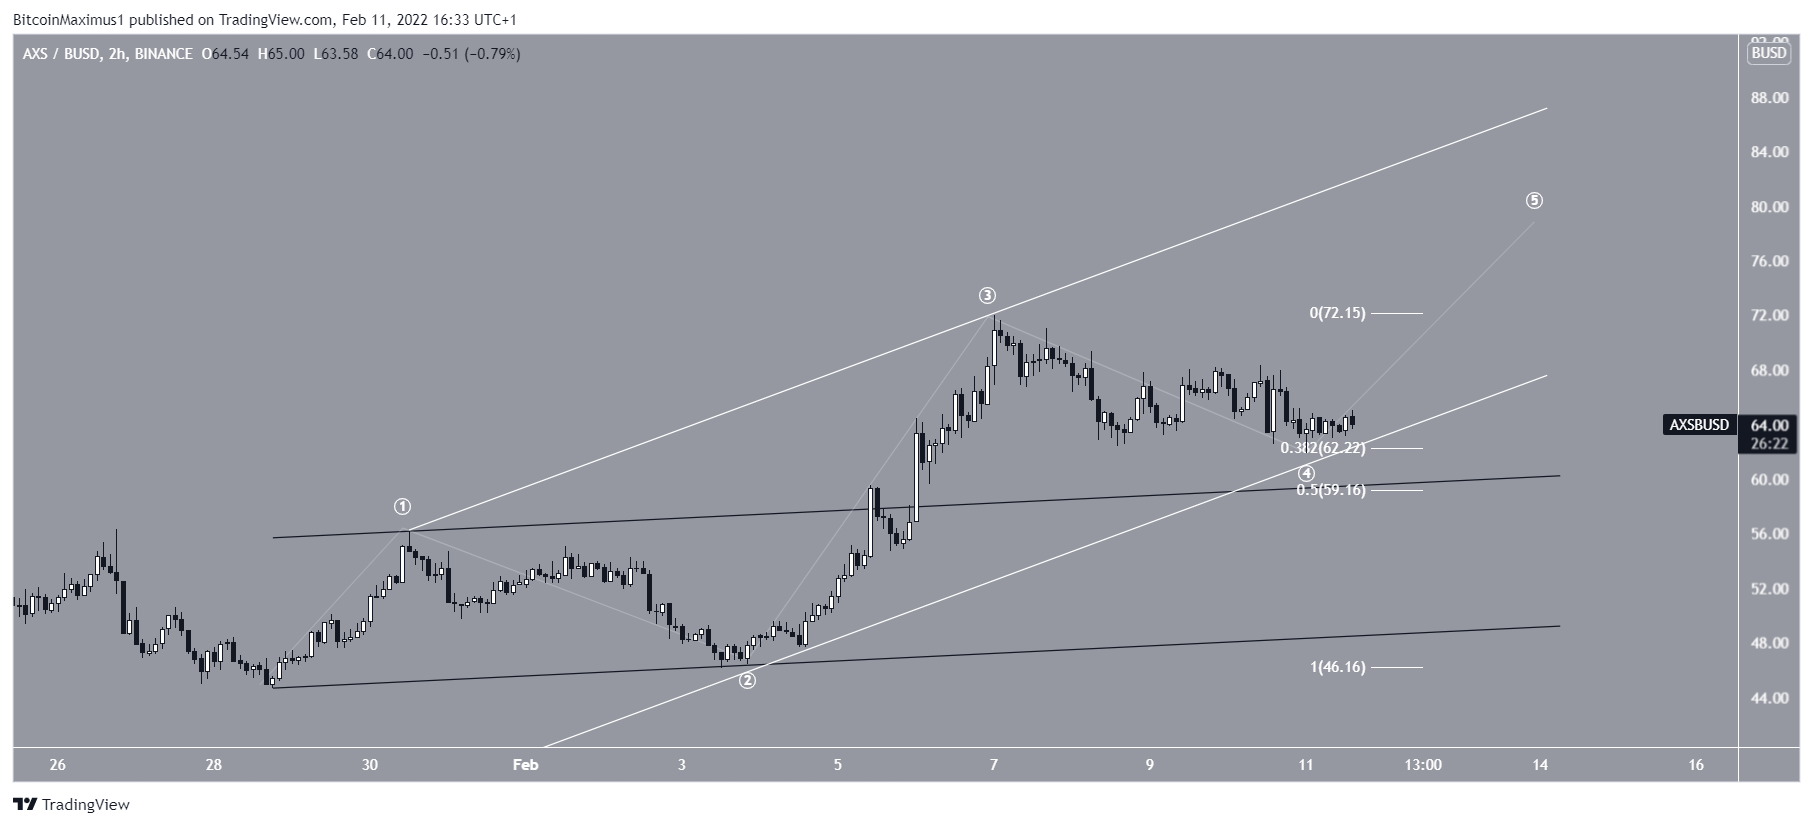
The two-hour chart shows that AXS has managed to hold on above the $63 minor horizontal support area, which has so far initiated two bounced (green icons).
If AXS were to break down from this area, the previous resistance line of the channel at $60 would be expected to provide support.

AXS wave count analysis
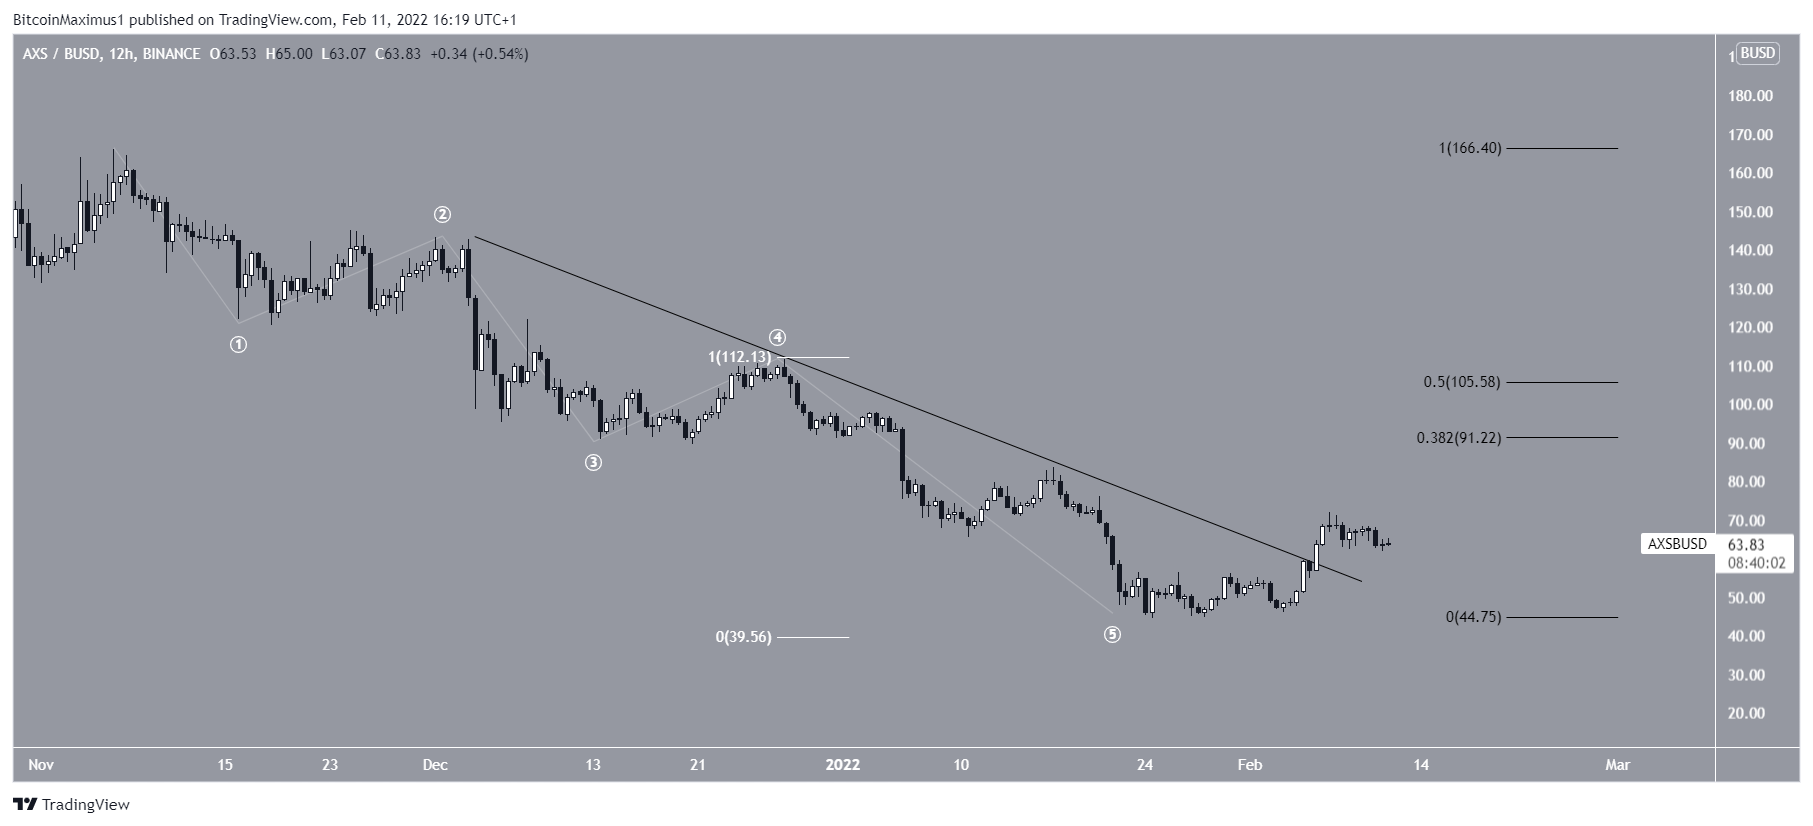
Cryptocurrency trader @TAfxcryptolab tweeted a chart of AXS, stating that the token is very close to finishing its corrective structure.
Measuring from the all-time high, there is a clear five wave downward movement, after which a significant bounce usually transpires. In this movement, the fifth wave extended and was nearly the length of waves 1-3 combined (white).
This possibility is also supported by the fact that the price has broken the 2-4 trendline.
If the upward movement continues, the closest resistance would be between $91 – $105, created by the 0.382 – 0.5 Fib retracement resistance levels.
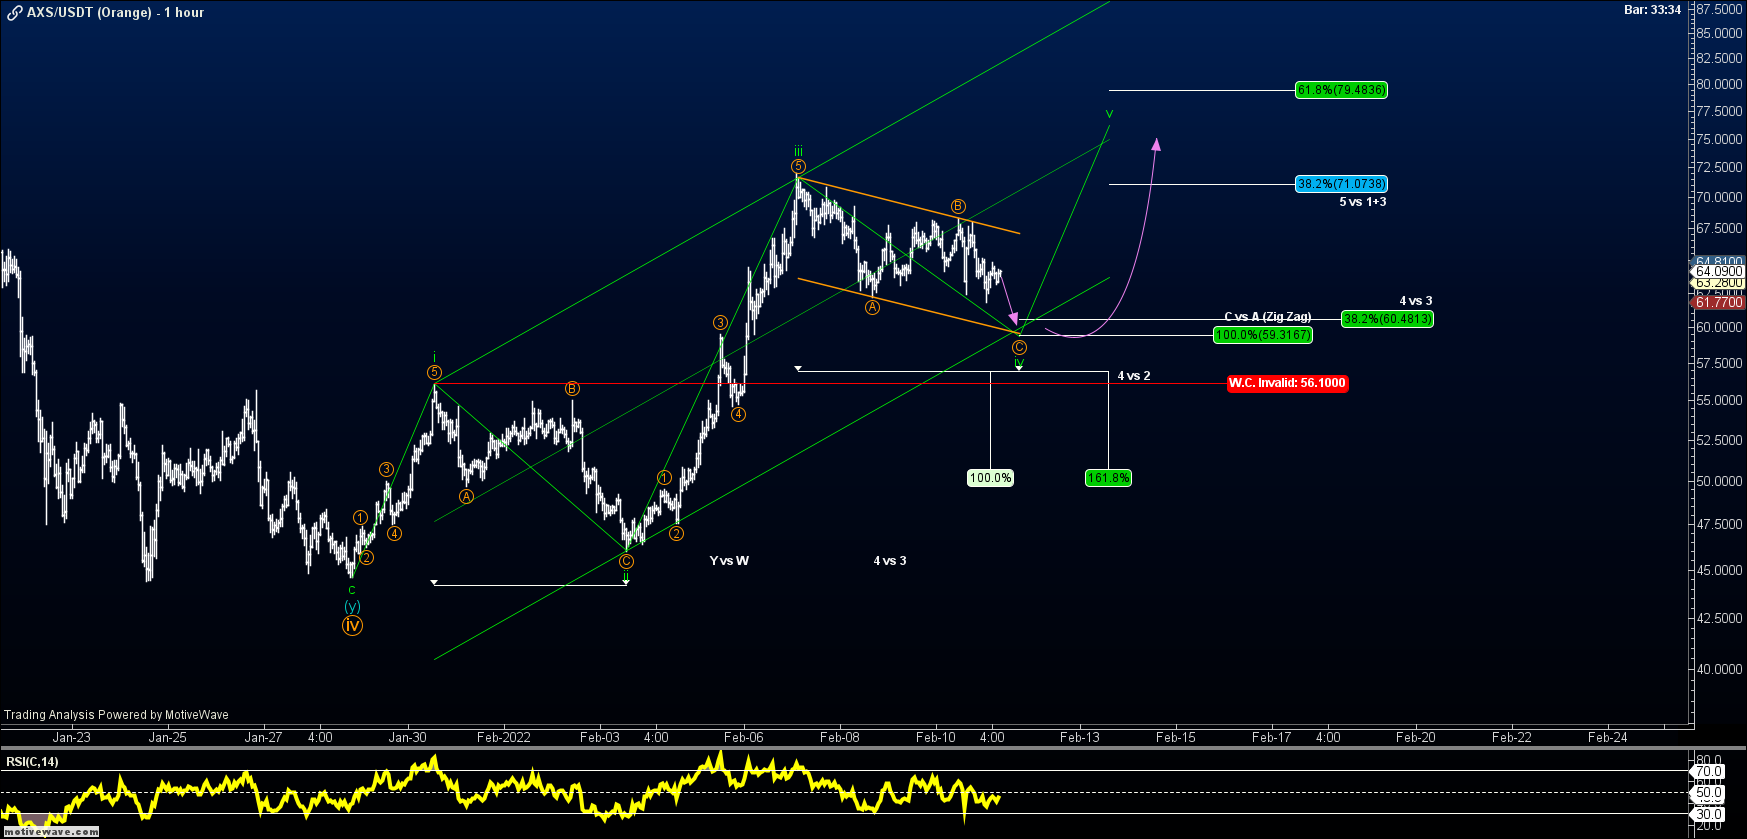
As for the short-term count, it seems that AXS is in wave four of a five wave upward movement.
The current level could act as the low, since it is the 0.382 Fib retracement support level (white) and coincides with an ascending parallel channel connecting waves one and three (white).
If AXS does not manage to hold on above the current support level, the next main support would be at $59. This is the 0.5 Fib retracement support level and a coincides with the resistance line of a channel connecting the highs of waves one and two (black).
BeInCrypto’s latest Bitcoin (BTC) analysis, click here.
What do you think about this subject? Write to us and tell us!
Disclaimer
In line with the Trust Project guidelines, this price analysis article is for informational purposes only and should not be considered financial or investment advice. BeInCrypto is committed to accurate, unbiased reporting, but market conditions are subject to change without notice. Always conduct your own research and consult with a professional before making any financial decisions. Please note that our Terms and Conditions, Privacy Policy, and Disclaimers have been updated.
