


Avalanche (AVAX) bounced at an ascending support line on April 18 and could be trading inside a bullish pattern.
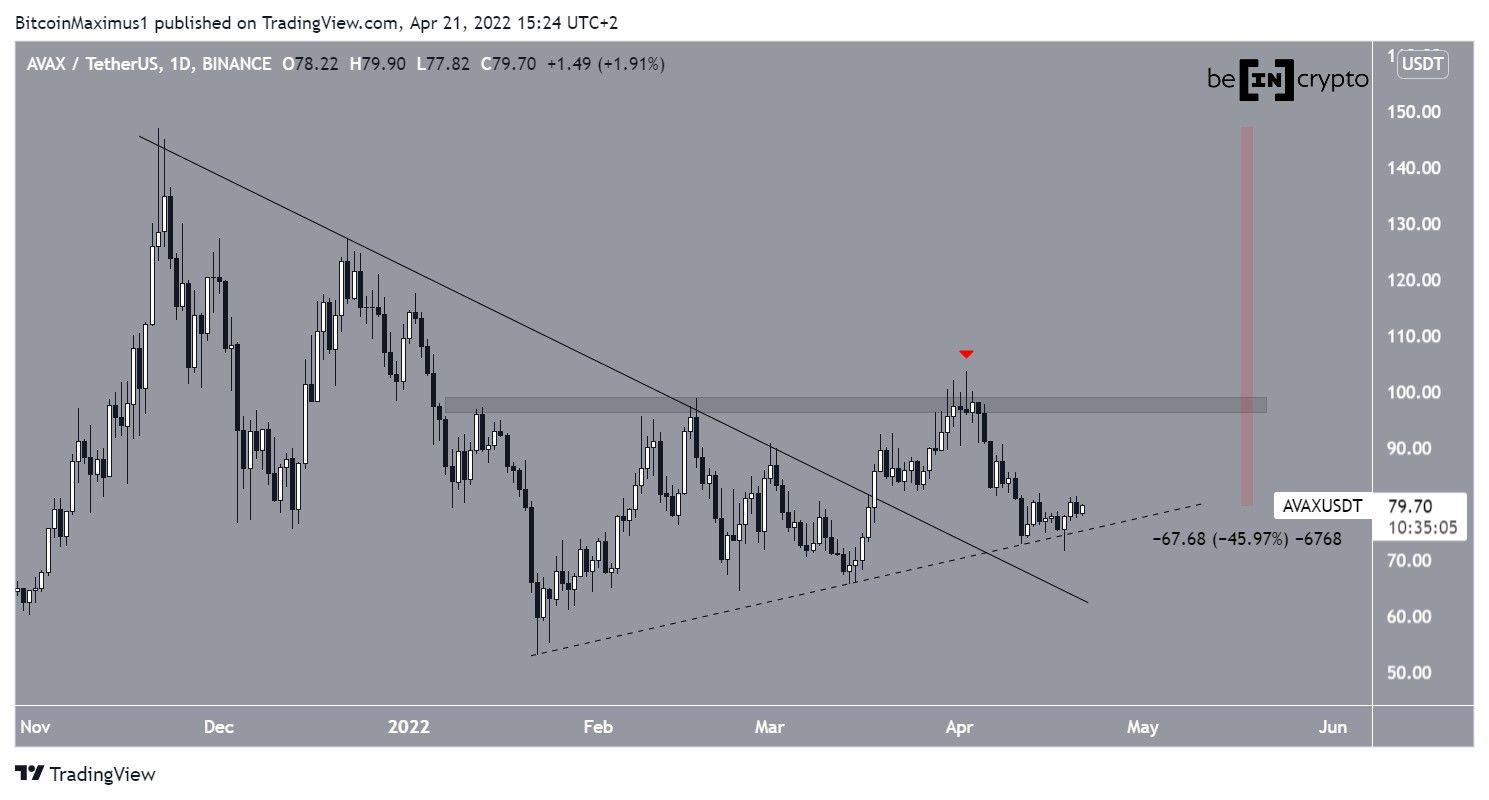
AVAX had been decreasing alongside a descending resistance line since November 22. The downward movement led to a low of $53.1 on January 26; the price has been increasing alongside an ascending support line (dashed) since.
On March 18, AVAX broke out from the descending resistance line and continued to increase, until it reached a high of $103.65 on April 2.
However, the price was rejected by the $97 resistance area (red icon) and has been moving downwards since. Measuring from the all-time high, AVAX has fallen by 46 percent.
Could we see a bounce towards $100?
Cryptocurrency trader @PostyXBT tweeted a chart of AVAX, stating that the price could bounce towards $100.
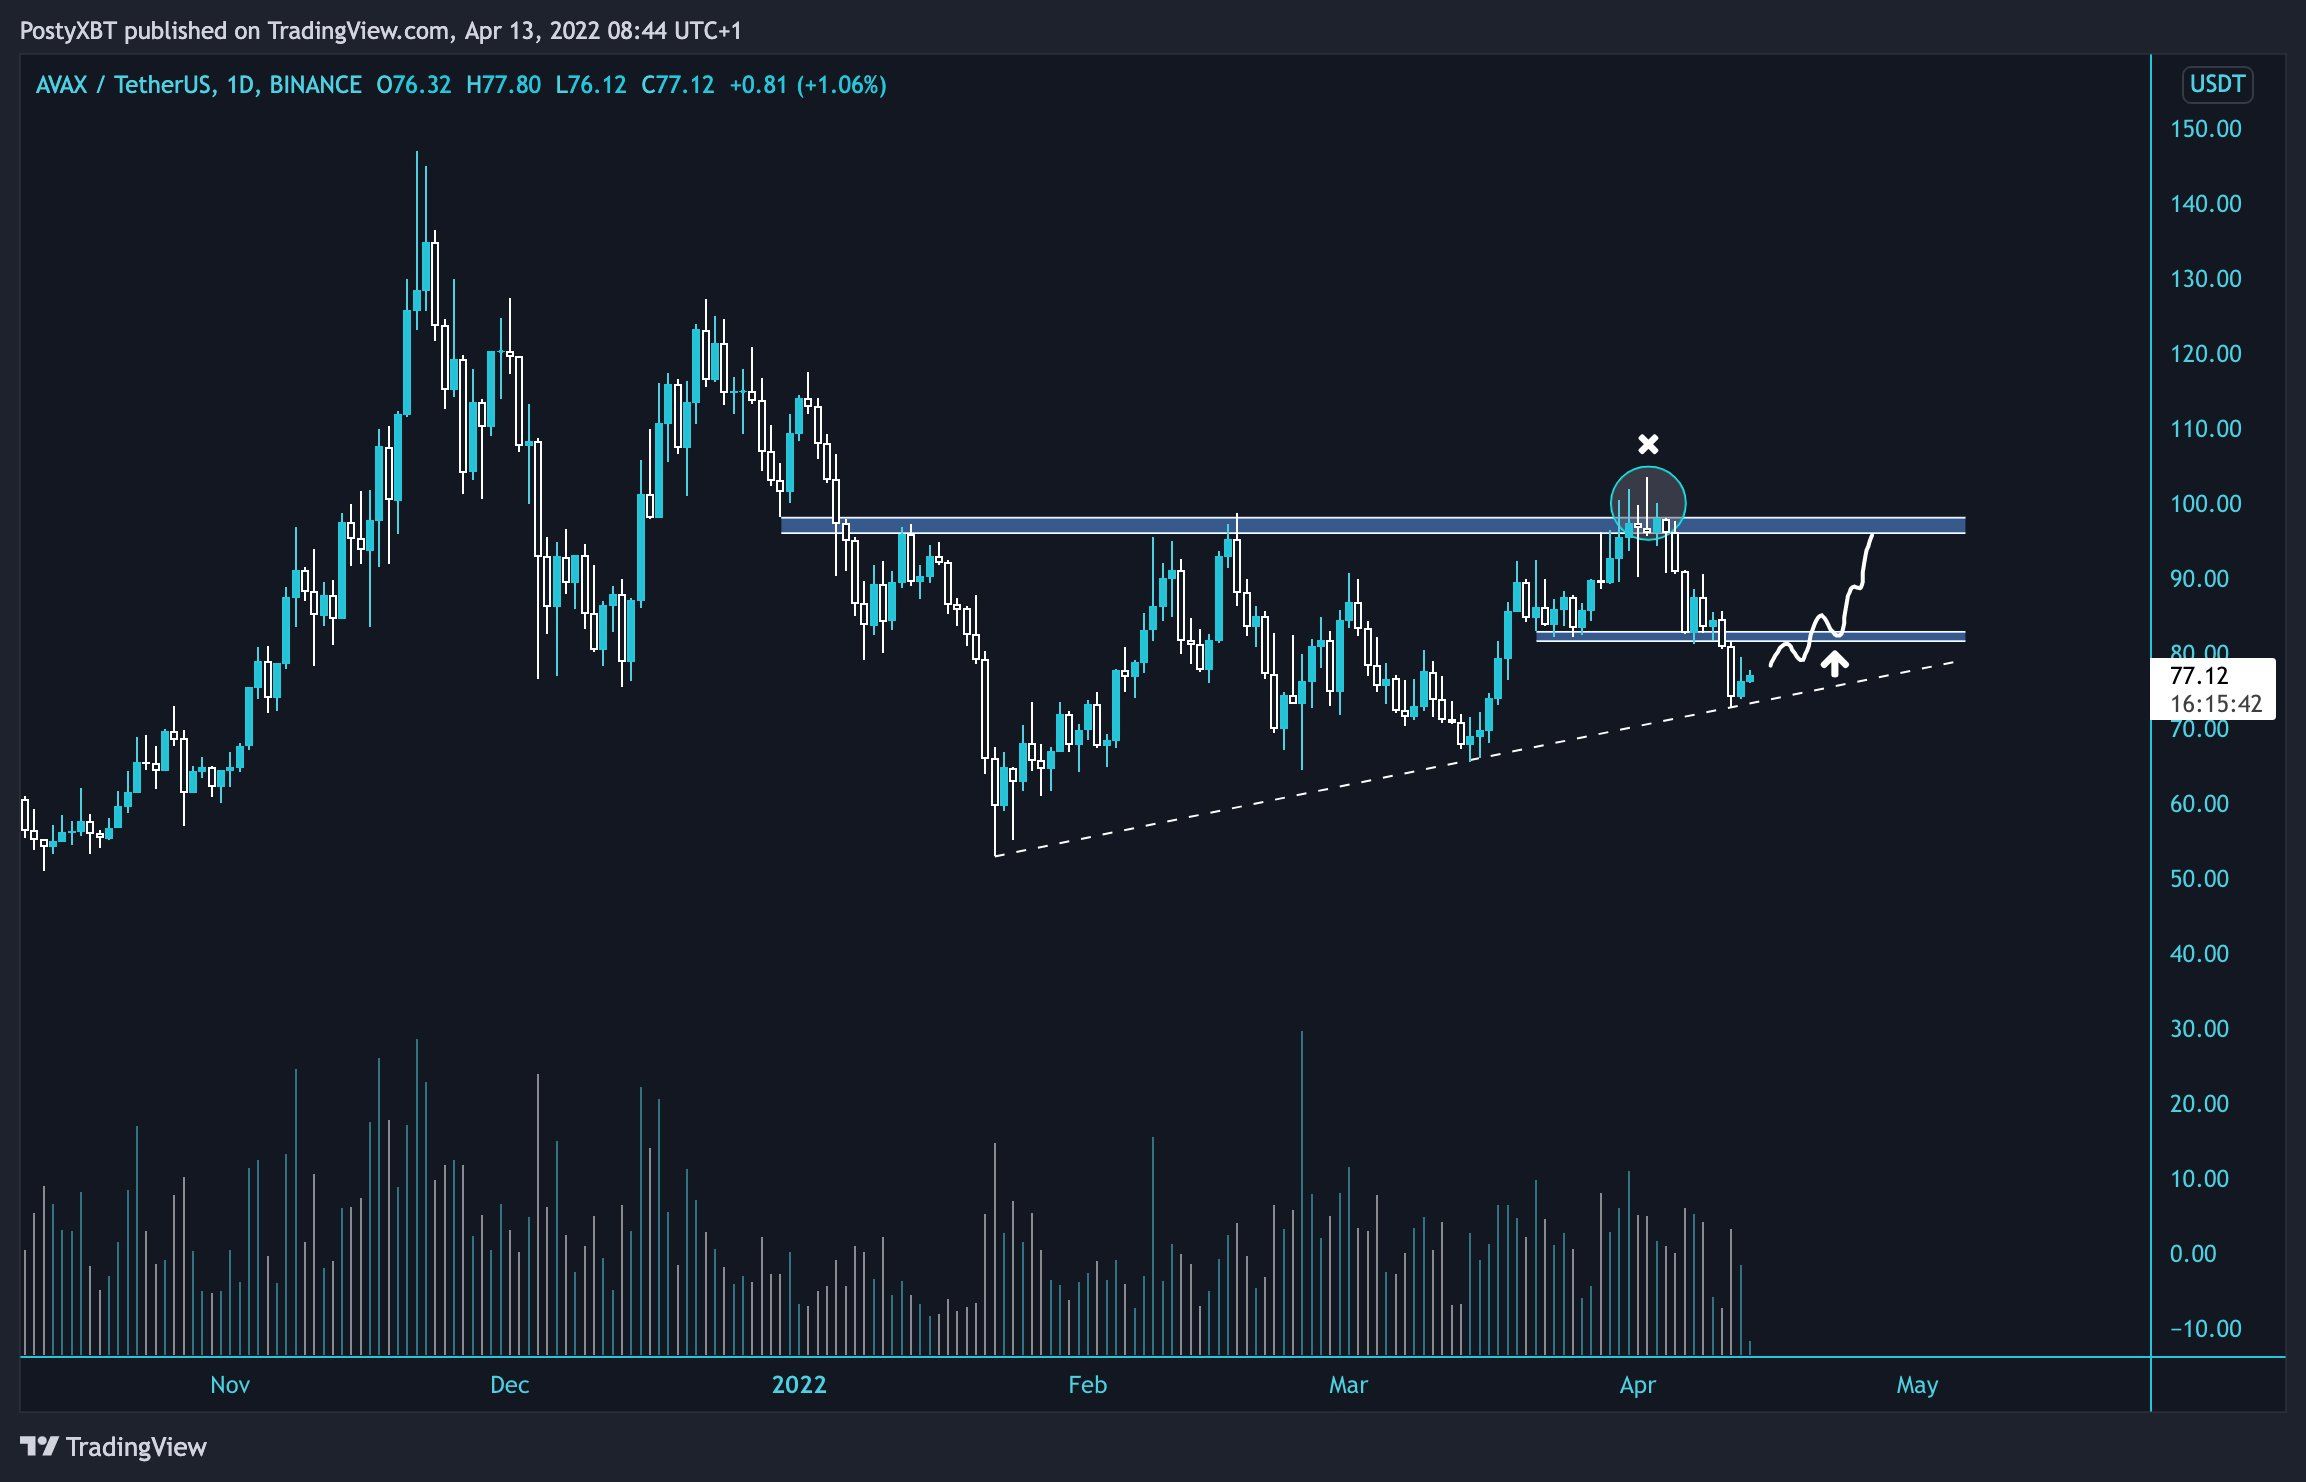
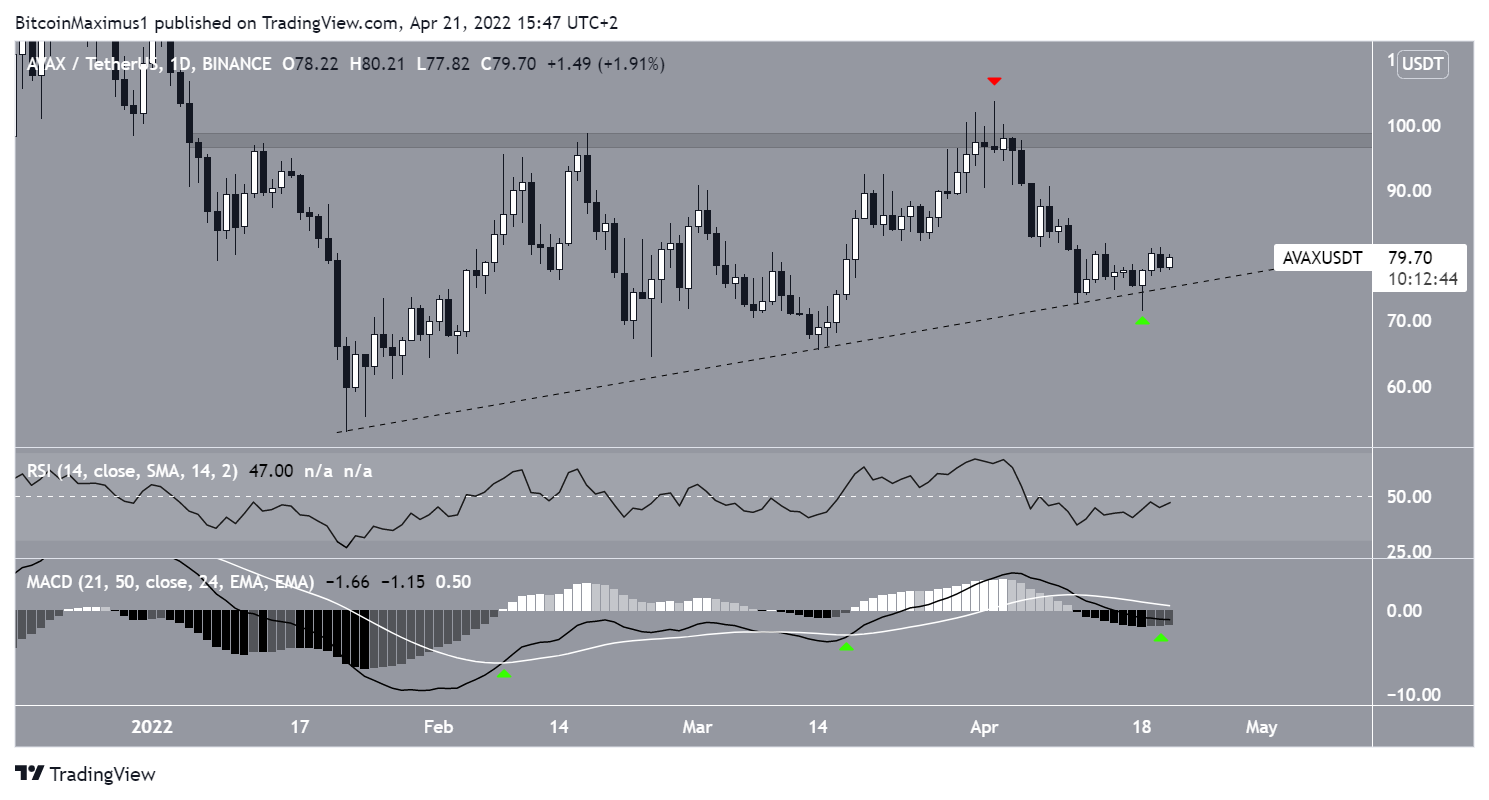
A closer look at the daily movement shows that AVAX created a bullish candlestick on April 18. This validated the ascending support line and initiated the current bounce. When combined with the $97 resistance area, this creates an ascending triangle, which is considered a bullish pattern.
In addition to this, the MACD is also showing bullish signs, since it has created successive higher momentum bars. Furthermore, it is close to making a bullish cross. The previous time such a cross occurred, significant upward movements followed (green icons).
Therefore, the most likely scenario would suggest that an upward movement towards $97 is forthcoming.
However, the RSI is still bearish, since it is below 50.
AVAX/BTC
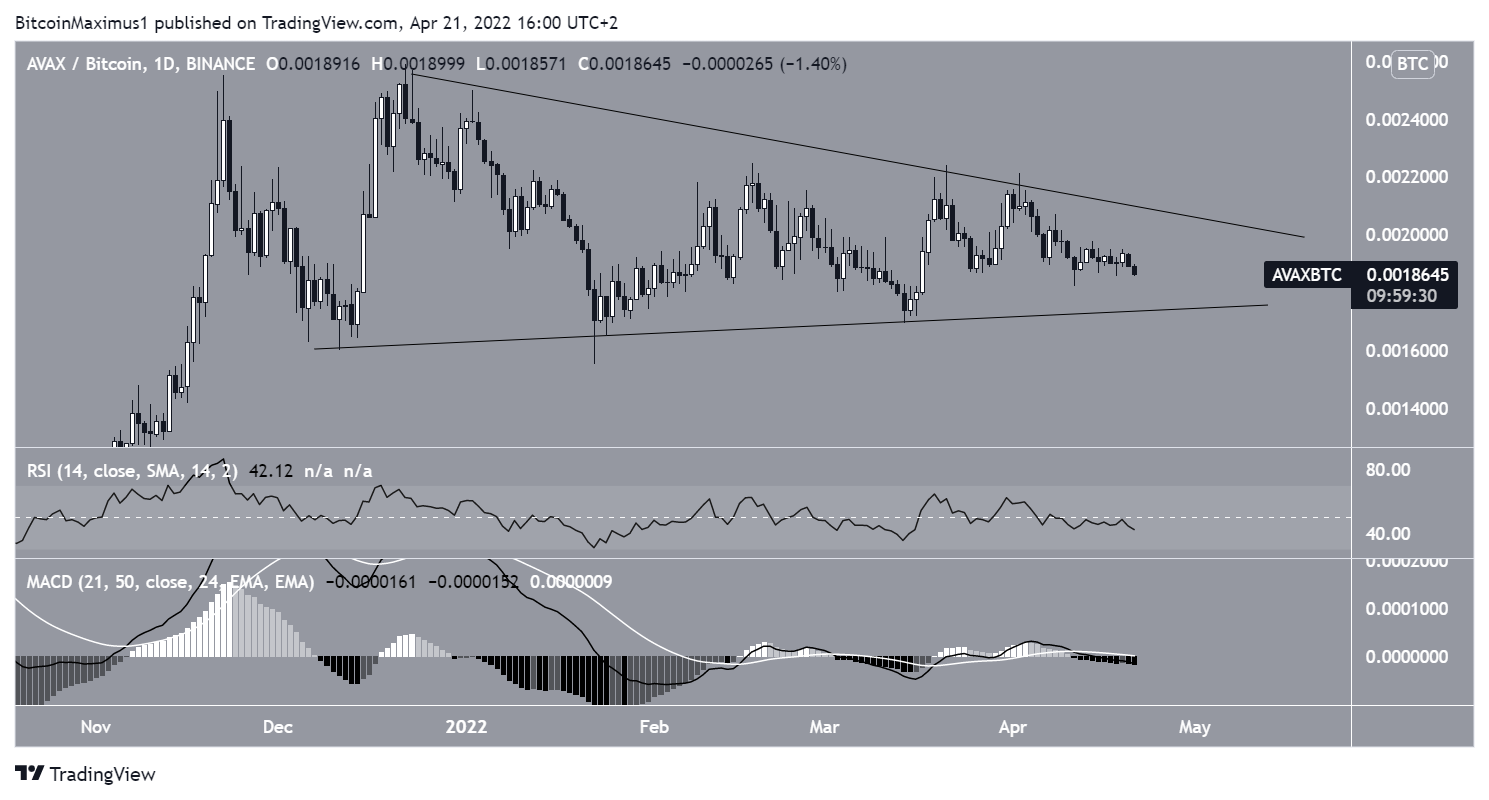
Similarly to the USD pair, AVAX/BTC has been following an ascending support line since December 2021. However, instead of trading inside an ascending triangle, the price seems to be trading inside a symmetrical triangle.
Since this triangle is considered a ‘neutral’ pattern, both a breakout and a breakdown remain possible. Additionally, both the RSI and MACD are neutral.
Therefore, whether the price breaks out or down from this pattern will likely determine the direction of the future trend.
For Be[In]Crypto’s latest Bitcoin (BTC) analysis, click here.
What do you think about this subject? Write to us and tell us!


