


On April 8, Bitcoin Cash (BCH) underwent its first official post-fork halving, reducing its block rewards from 12.5 to 6.25 BCH per block. The decreasing block reward could be an issue going forward, since the on-chain metrics for BCH look grim, and a movement of miners to BTC is already taking place.
BCH hash rate has decreased by 60% since its all-time high and is down 34% relative to its 2020 peak. On another note, BSV, which was created as a result of a hard fork on November 15, 2018, is expected to undergo its own halving tomorrow, on April 10.
Previous Bitcoin Cash Halvings
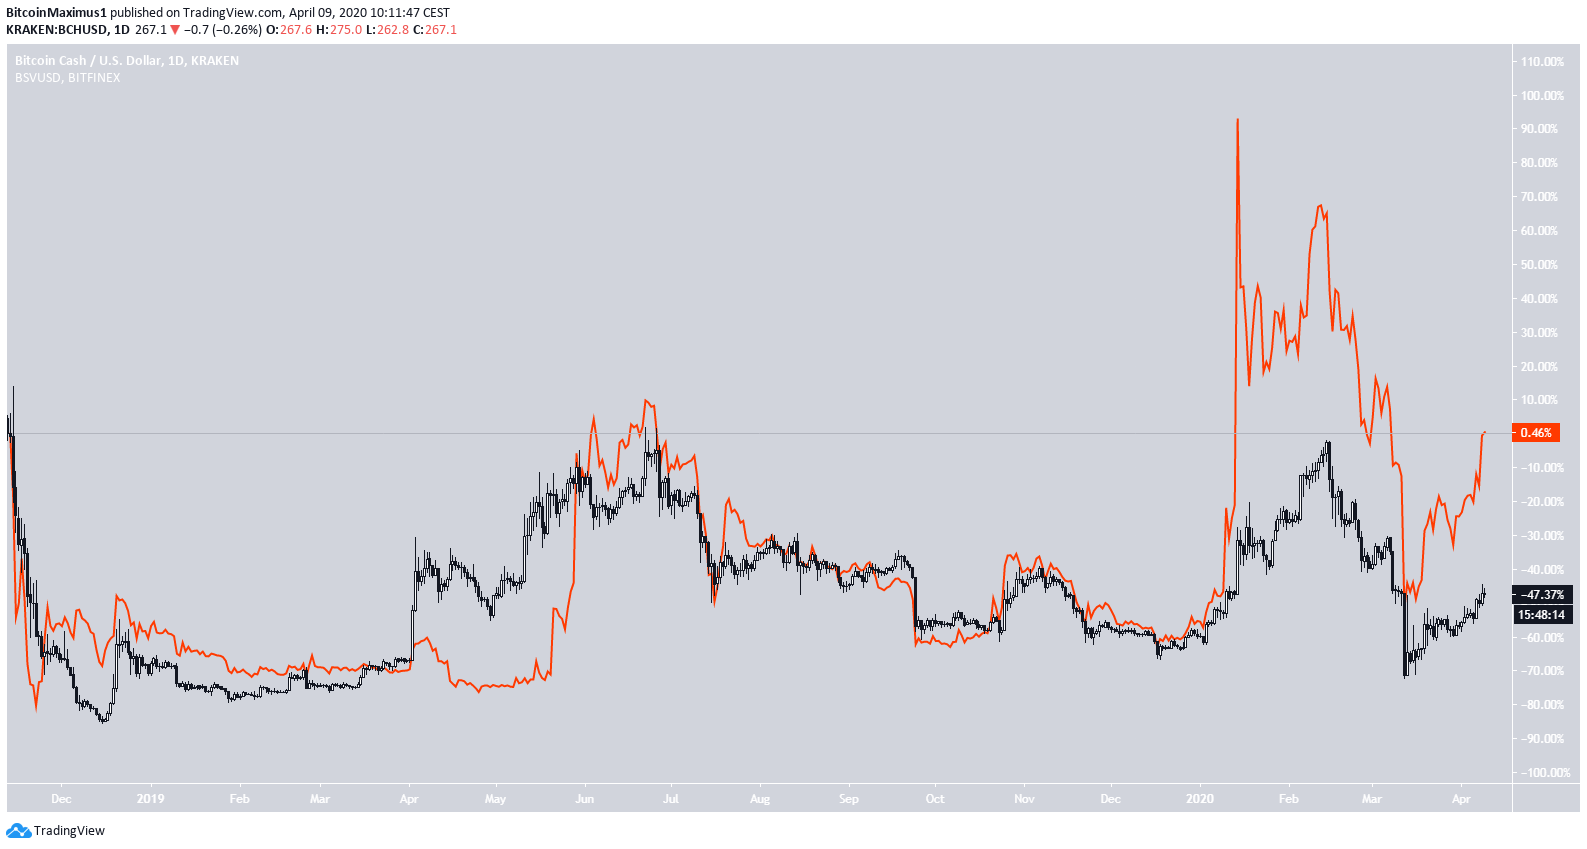
Since the BSV fork, the price of BCH has decreased considerably. While the price movement of these Bitcoin forks shows similar shapes, the magnitude of their movements has been quite different. In this aspect, the BSV price has fared much better, having increased incrementally (0.46%) since November 15, 2018. On the other hand, the BCH price has decreased by a massive 47.37%.
The price movement was almost identical until January 2020. It was then that the BSV price increased exponentially, at one point being a full 100% above the BCH price in November 2018.
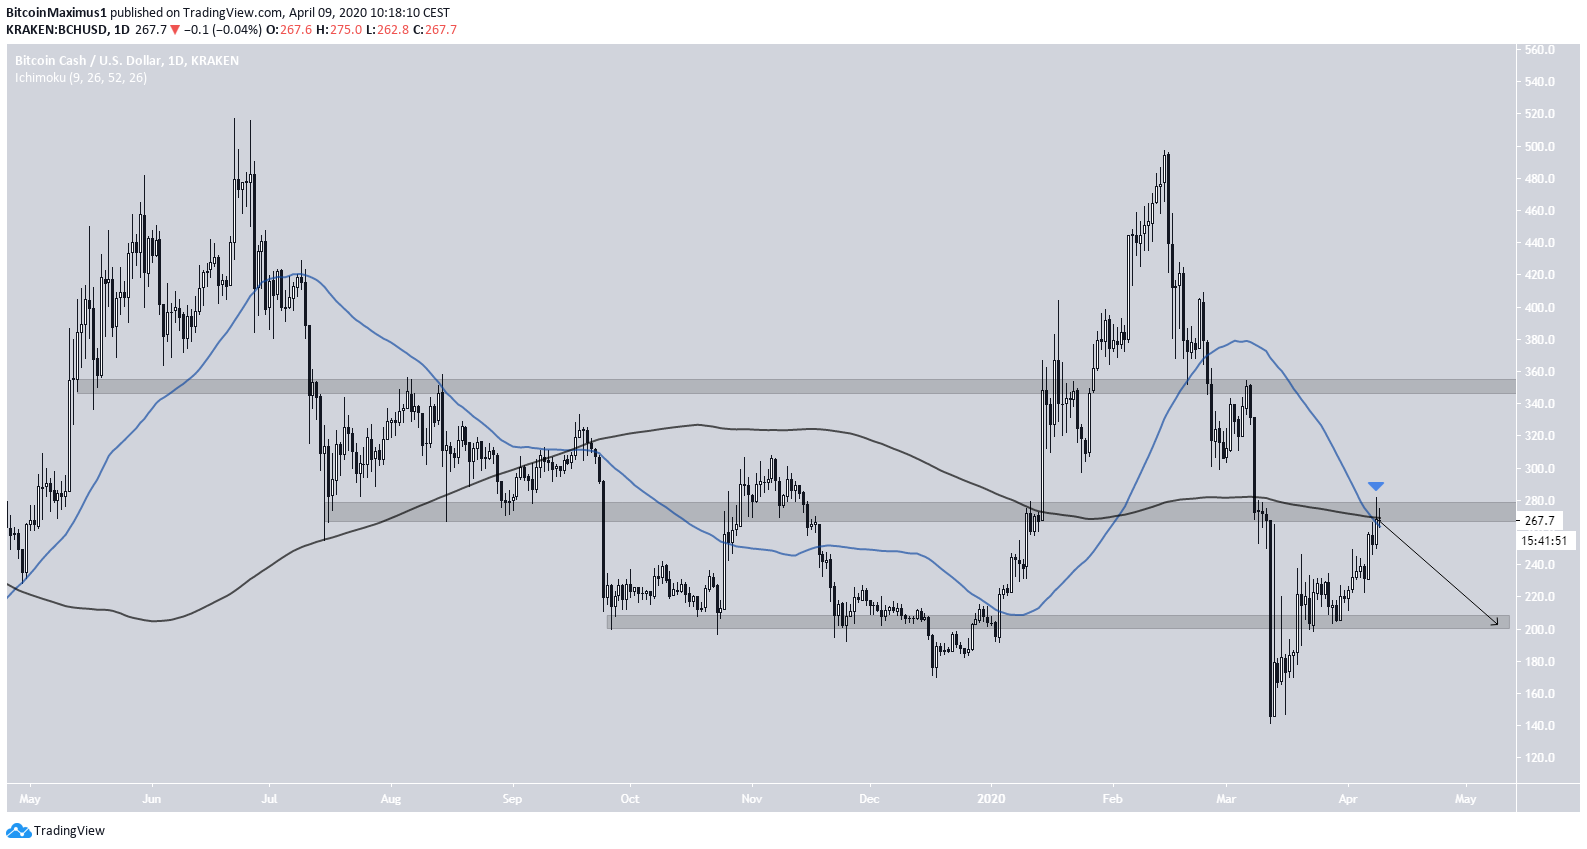
Bitcoin Cash (BCH)
The BCH price is currently trading inside a significant resistance zone found at $270. Furthermore, it is facing resistance from both the 50 and 200-day moving averages (MA), which are also in the process of making a bearish cross.
The price outlook is bearish, with BCH expected to drop once more towards the support at $200 before the price possibly makes another attempt at moving upwards.
All in all, the halving did not have a considerable effect on the BCH price, which increased by only 5% on April 8.
Bitcoin Satoshi’s Vision (BSV)
The BSV chart, on the other hand, looks slightly more bullish. The price has almost reached the main resistance level found at $250. In addition, the price is following a descending resistance line, currently being right under it.
The reason for the relative bullishness is the price position relative to its moving averages. The BSV price has moved above both the 50 and 200-day MAs.
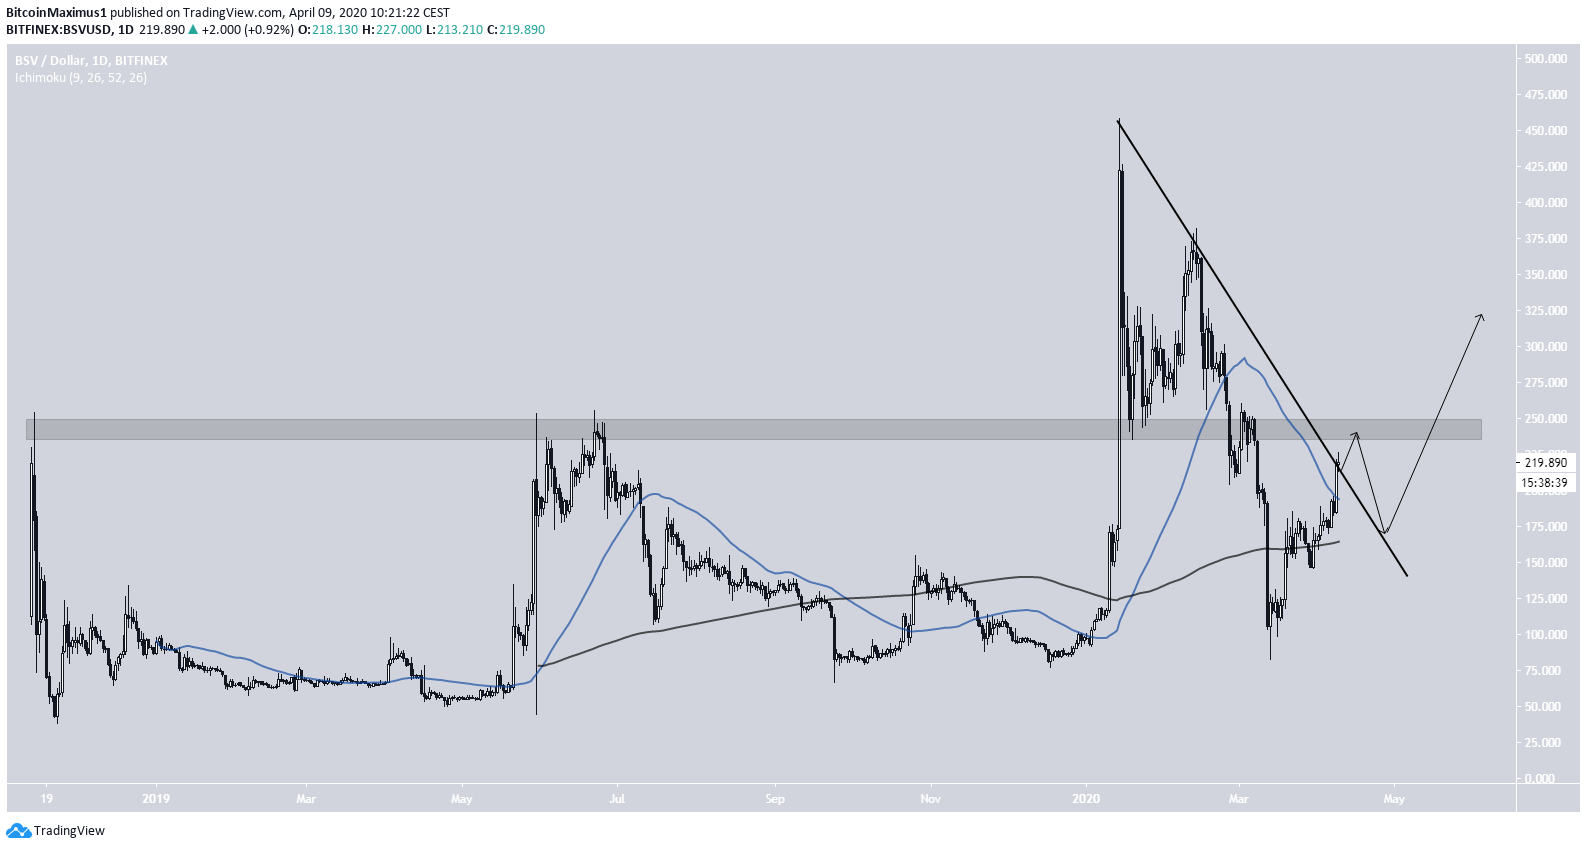
If the price breaks out from the descending resistance line, it would make sense for it to drop and validate it as support, along with the 200-day MA, before the price resumes its upward movement towards $250.


