


The Altcoin Market Cap (ALTCAP) increased considerably yesterday and has broken out from a descending resistance line. This was combined with a Bitcoin Dominance Rate (BTCD) decrease.
The ALTCAP increase is expected to continue in the short- and long term. On the other hand, while the short-term BTCD trend is bearish, the long-term one is still unclear.
Altcoin Season Hopes Recover as Altcoin Cap Begins Upward Movement
The daily time frame technical analysis for the Altcoin Market Cap gives a bullish reading. ALTCAP has increased since bouncing at the $500 billion horizontal support area on June 15 (green icon).
On June 30, it broke out from a descending resistance line. This was a sign that the previous correction had ended. Then, ALTCAP returned to validate the line as support on July 7 (green icon) before accelerating its rate of increase further.
The daily RSI legitimizes the breakout and supports its continuation. When evaluating market conditions, traders use the RSI as a momentum indicator to determine if a market is overbought or oversold and to decide whether to accumulate or sell an asset.
Read More: Top 11 Crypto Communities To Join in 2023
If the RSI reading is above 50 and the trend is upward, bulls still have an advantage, but if the reading is below 50, the opposite is true. The indicator is above 50 and moving upwards, both signs of a bullish trend.
Currently, ALTCAP is trading above the 0.618 Fib retracement resistance level at $600 billion. The principle behind Fibonacci retracement levels suggests that after a considerable price movement in one direction, the price will retrace or return partially to a previous price level before continuing in its original direction.
This is another bullish sign since the 0.618 Fib level often acts as the local top if the breakout is just a relief rally.
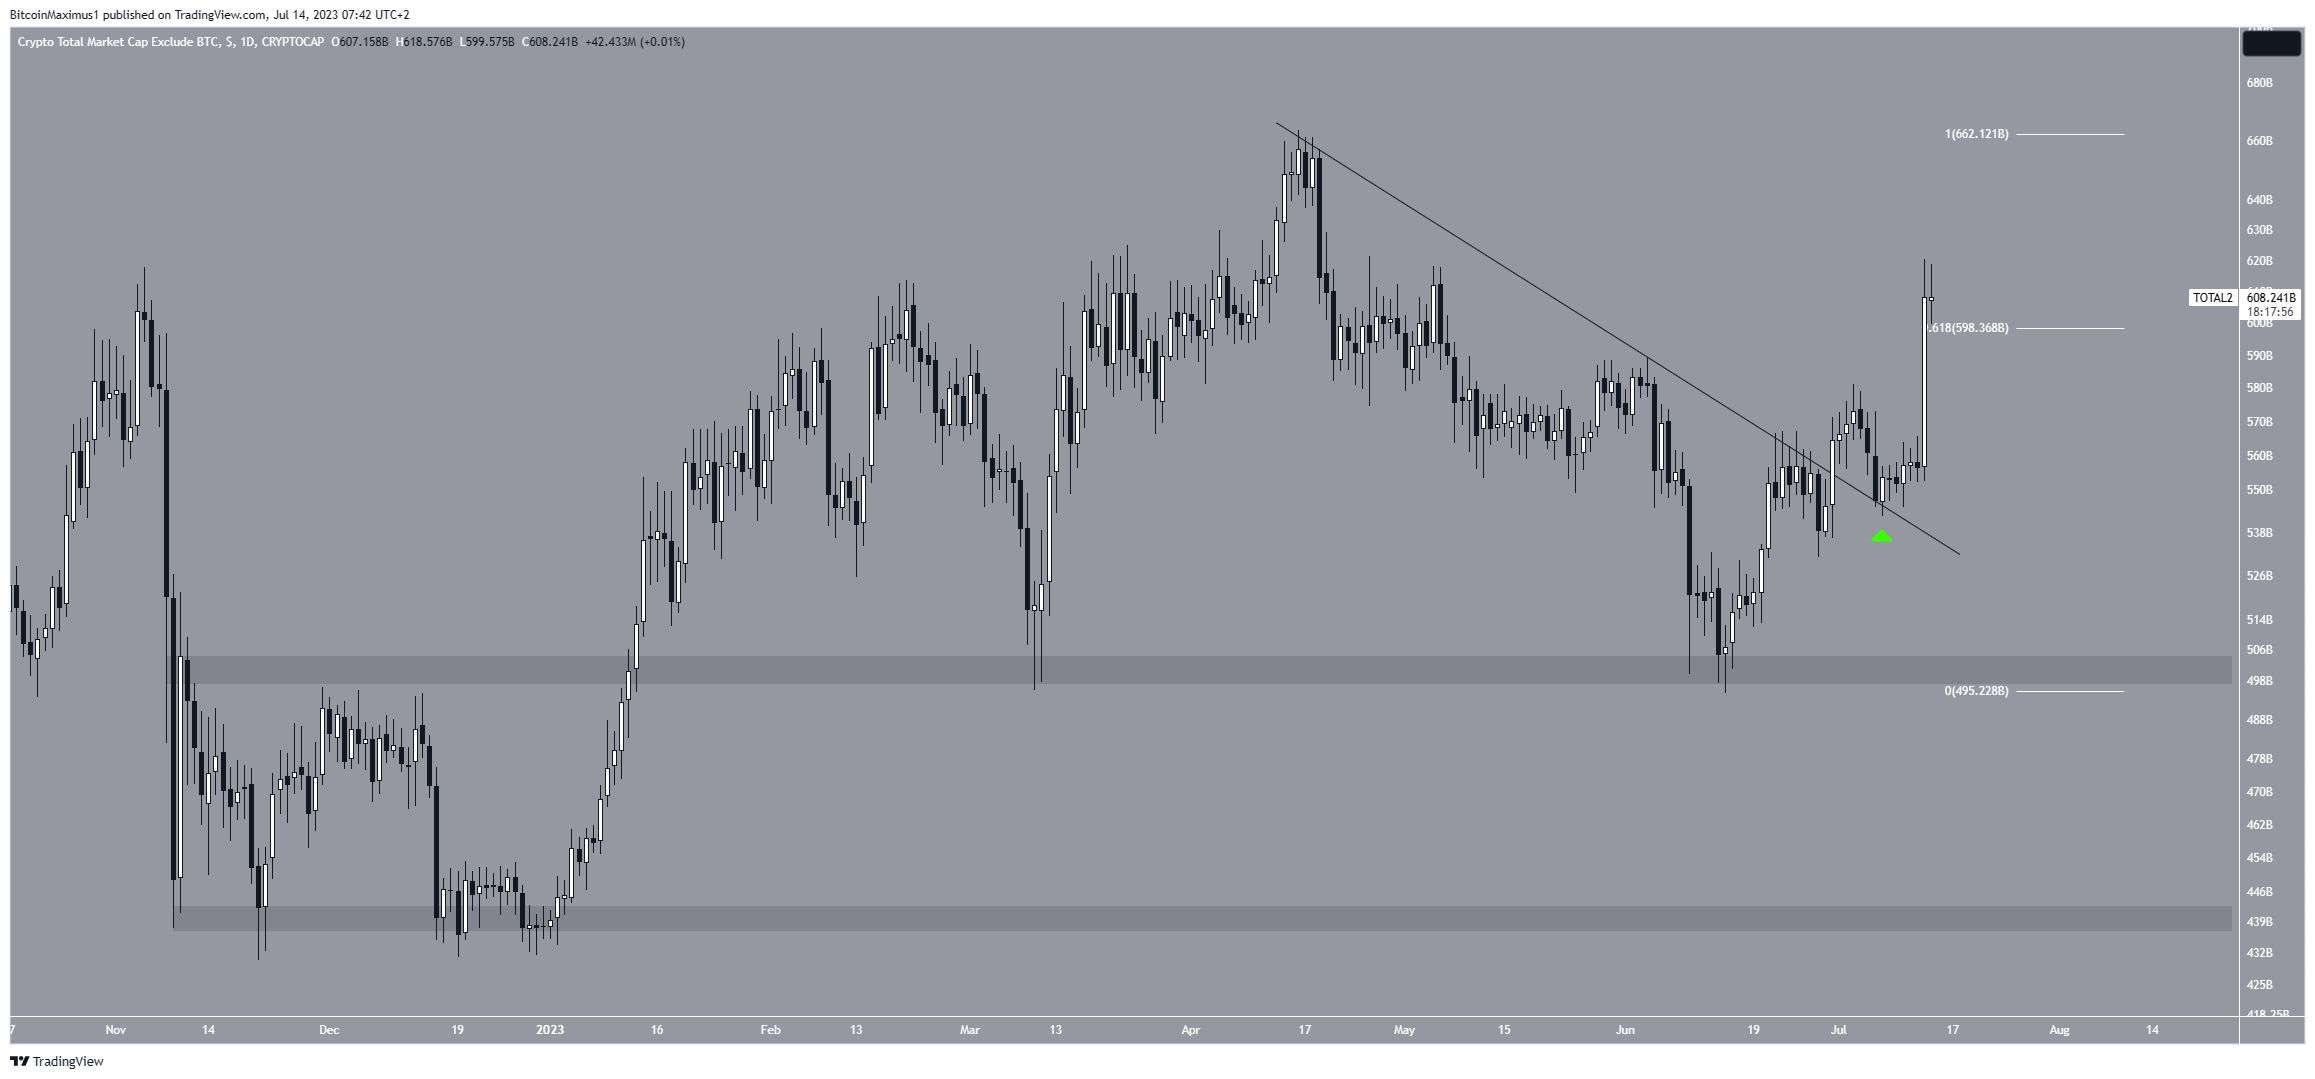
ALTCAP can increase to a new yearly high of $700 billion if the increase continues. However, if the ALTCAP were to close below the 0.618 Fib level, a drop to the next support at $540 billion could transpire.
Read More: How To Make Money in a Bear Market
Bitcoin Dominance Rate (BTCD) Weakens After Rejection
The Bitcoin dominance rate broke out from the 48% area at the beginning of June. Then, it reached a new yearly high of 52.15% at the end of the month.
However, BTCD was rejected by the 0.382 Fib retracement resistance level at 52.15%. It is currently in the process of creating a large bearish weekly candlestick.
If the decrease continues, BTCD can fall to the 48% area again. The area is now expected to provide support.
Once it gets there, the reaction will likely determine the future trend’s direction. If BTCD bounces, it can resume its upward trend to 58%.
However, if it breaks down, it will mean that the previous breakout was not legitimate and new lows will follow.
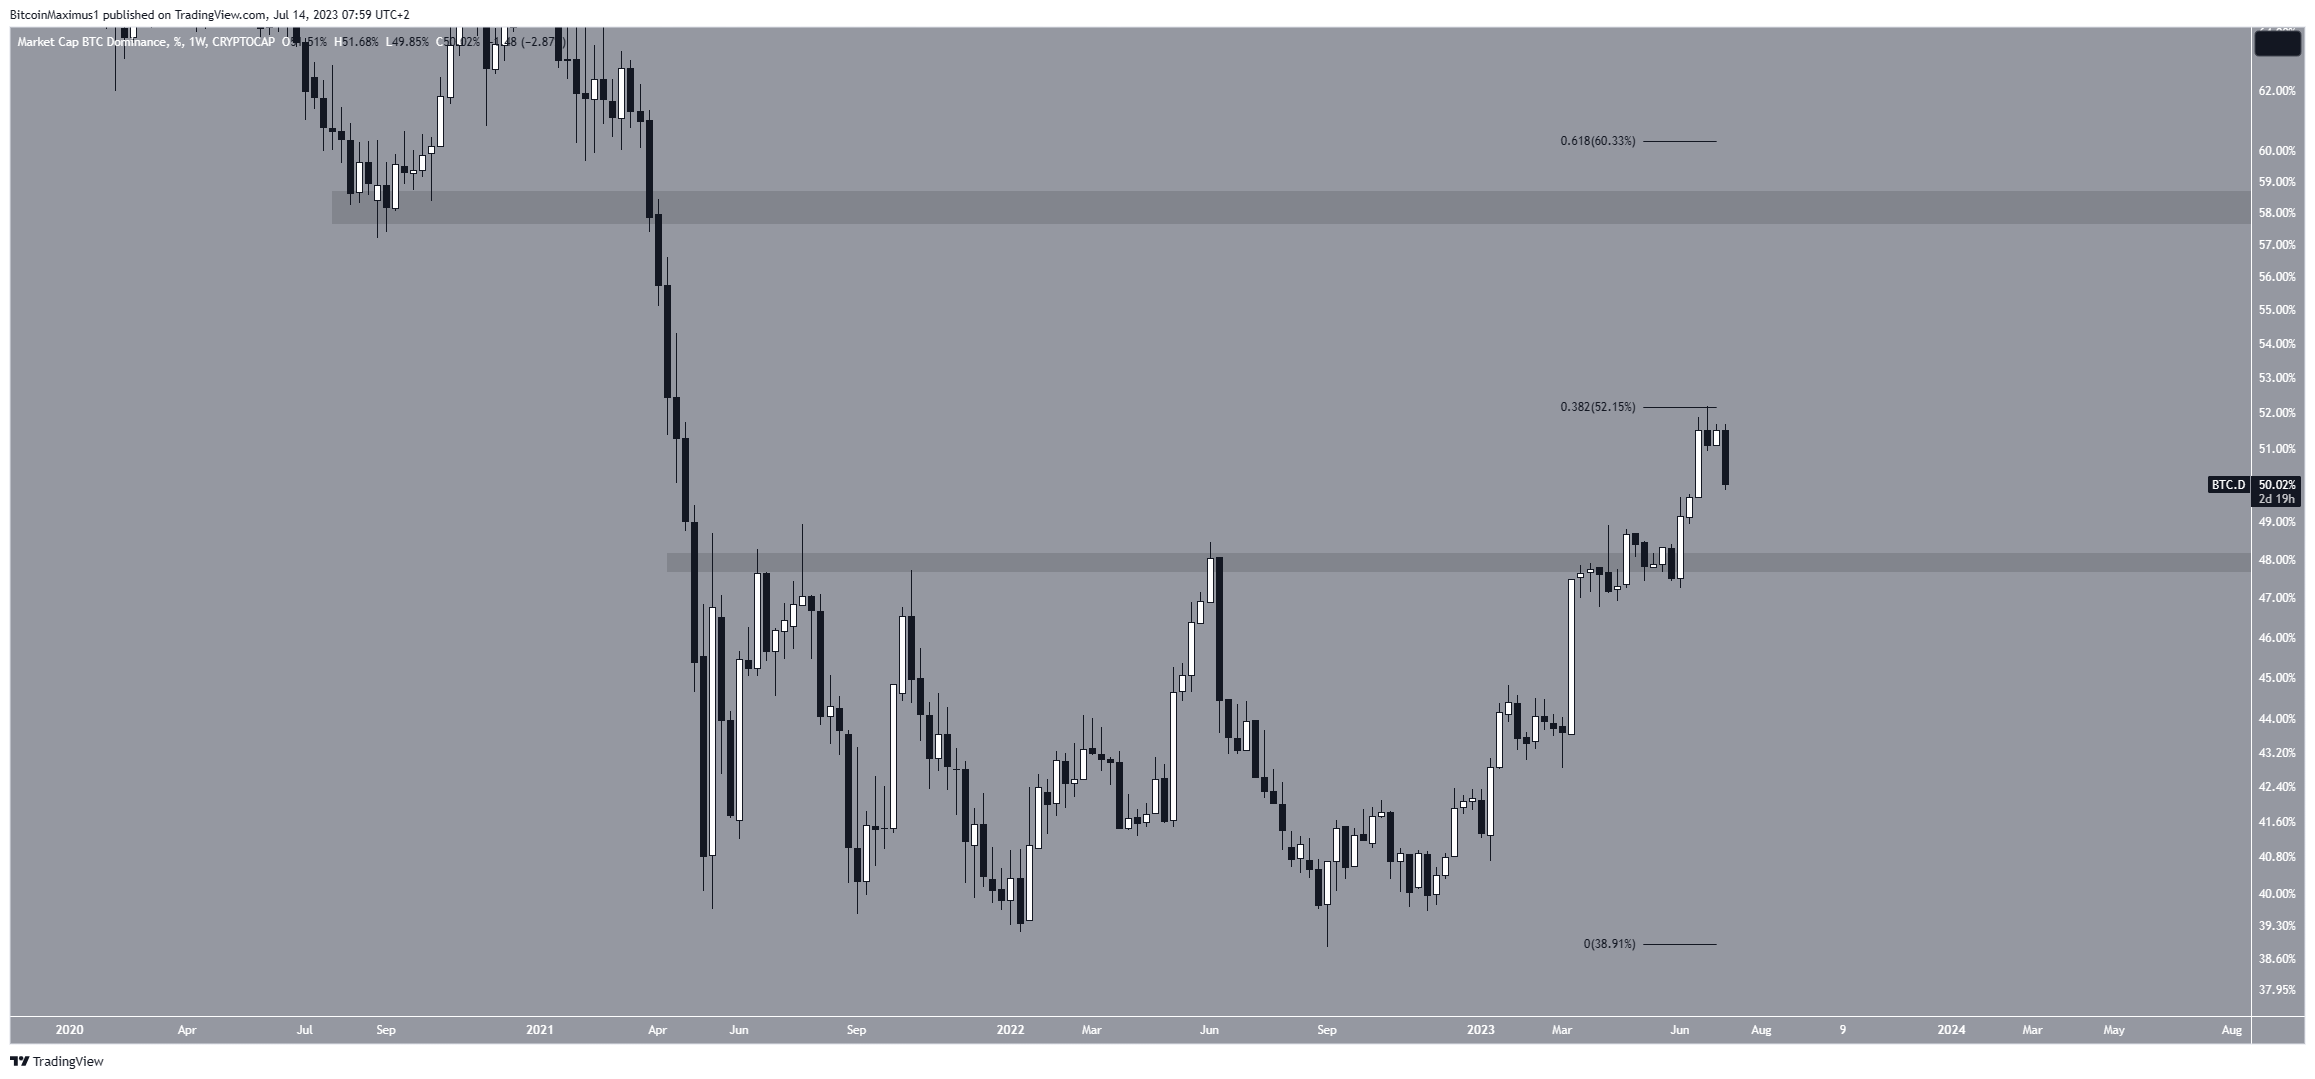
Despite this bearish short-term prediction, closing above the yearly high of 52.15% will mean that the trend is still bullish. In that case, BTCD will likely immediately increase to 58%.
More From BeInCrypto: 9 Best AI Crypto Trading Bots to Maximize Your Profits
For BeInCrypto’s latest crypto market analysis, click here.


