


BeInCrypto looks at five altcoins that increased the most in this week’s crypto market, specifically from August 4 to 11.
The term altcoin refers to cryptocurrencies other than Bitcoin (BTC). These bullish altcoins have stolen the crypto news and cryptocurrency market spotlight this week as the biggest gainers:
- Shiba Inu (SHIB) price increased by 19.38%
- THORChain (RUNE) price increased by 16.59%
- OKB price increased by 14.50%
- dYdX (DYDX) price increased by 12.91%
- Synthetix Network (SNX) price increased by 8.92%
Shiba Inu (SHIB) Price Leads Altcoin Gainers
The SHIB price has increased since falling to a new yearly low of $0.0000054 on June 10. The increase has been swift, and the price reclaimed the $0.0000080 horizontal area on July 28. Six days later, the price moved above the support line of a previous long-term symmetrical triangle.
There are both signs that the previous breakdown was illegitimate, and the trend is still bullish.
If the upward movement continues, the price can reach the triangle’s resistance line at $0.0000113. This would be an increase of 12%, measuring from the current price of $0.000010.
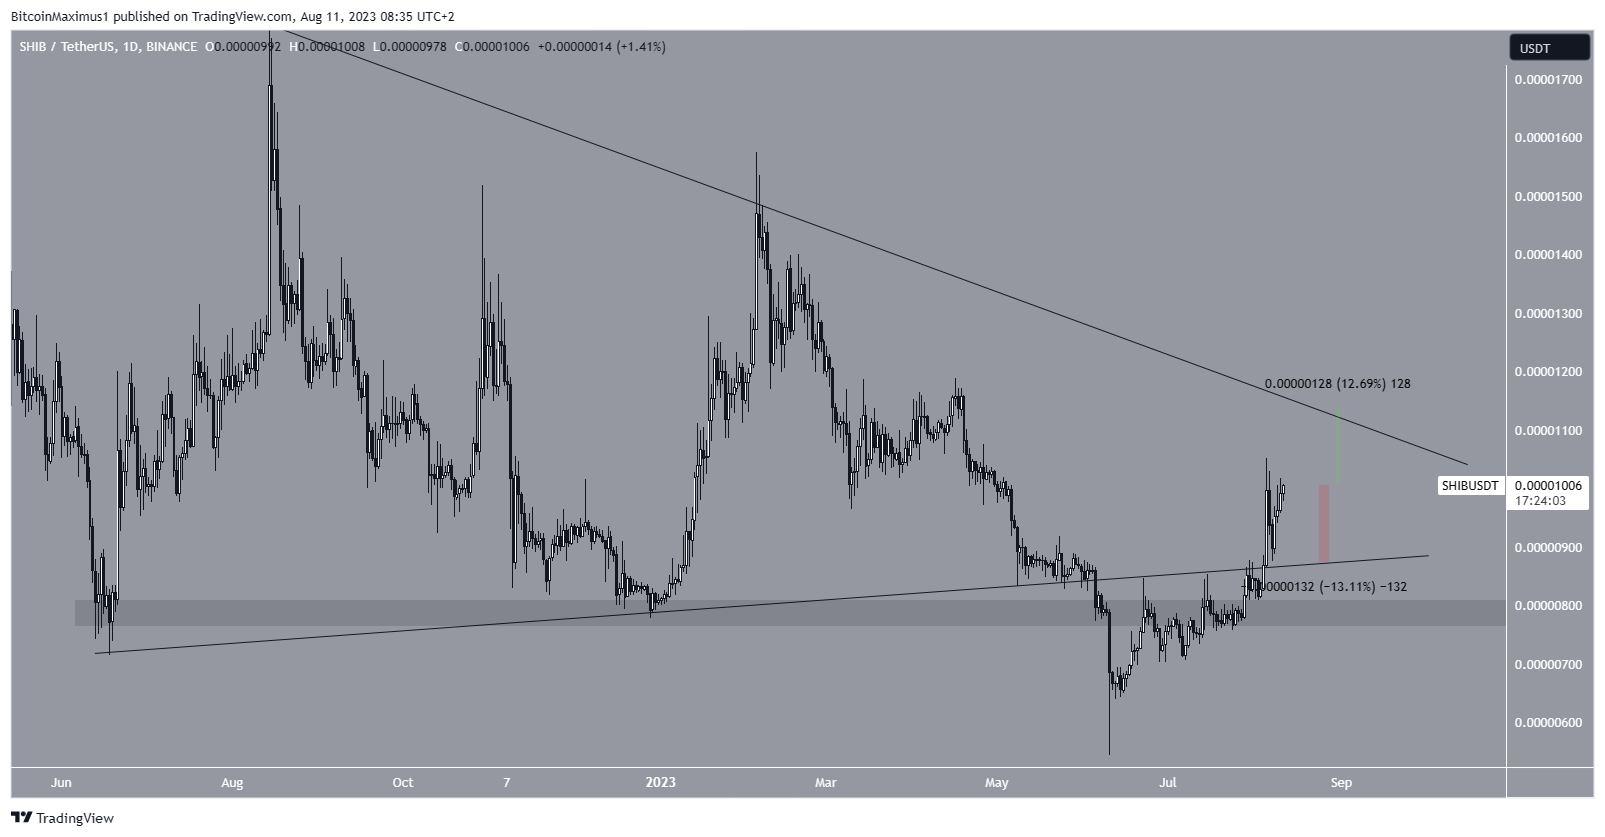
However, if a decrease occurs, the SHIB price could drop 13% to the triangle’s support line at $0.0000090.
THORChain (RUNE) Price Increases After Higher Low
The RUNE price has increased since June 14. The price created a higher low on July 30 and accelerated its rate of increase afterward. The price is now trading inside the $1.10 horizontal resistance area. This is an important area since it had previously provided support. Additionally, it coincides with a long-term descending resistance line that began in February.
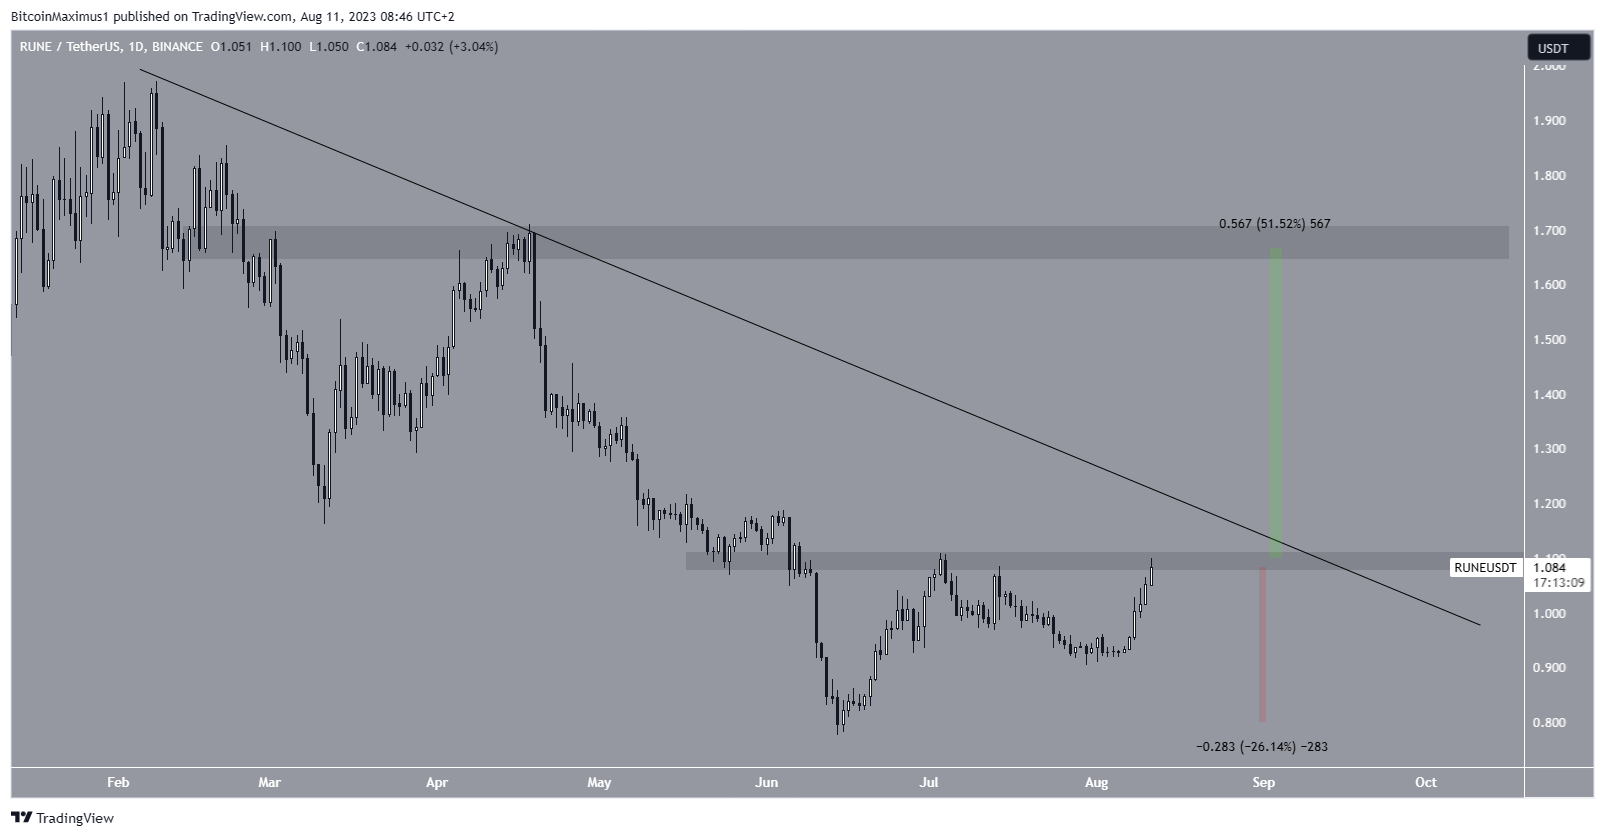
If RUNE breaks out from the line, it can increase by slightly more than 50% and reach the next resistance at $1.70. However, a 25% drop to the yearly lows will be the most likely scenario if it gets rejected.
OKB Price Trades in Continuation Pattern
The OKB price has traded inside a symmetrical triangle since the beginning of February. The triangle is considered a neutral pattern. However, the pattern usually leads to continuation. Since the triangle transpires after an upward movement, a breakout from it would be the most likely scenario.
If the price breaks out, a 50% increase to the next resistance at $72 will be the most likely scenario. The target is found using the 1.61 external Fib retracement of the most recent downward movement.
This would ultimately culminate in a new all-time high for the altcoin. Currently, the all-time high is $58.66, which it hit in February 2023.
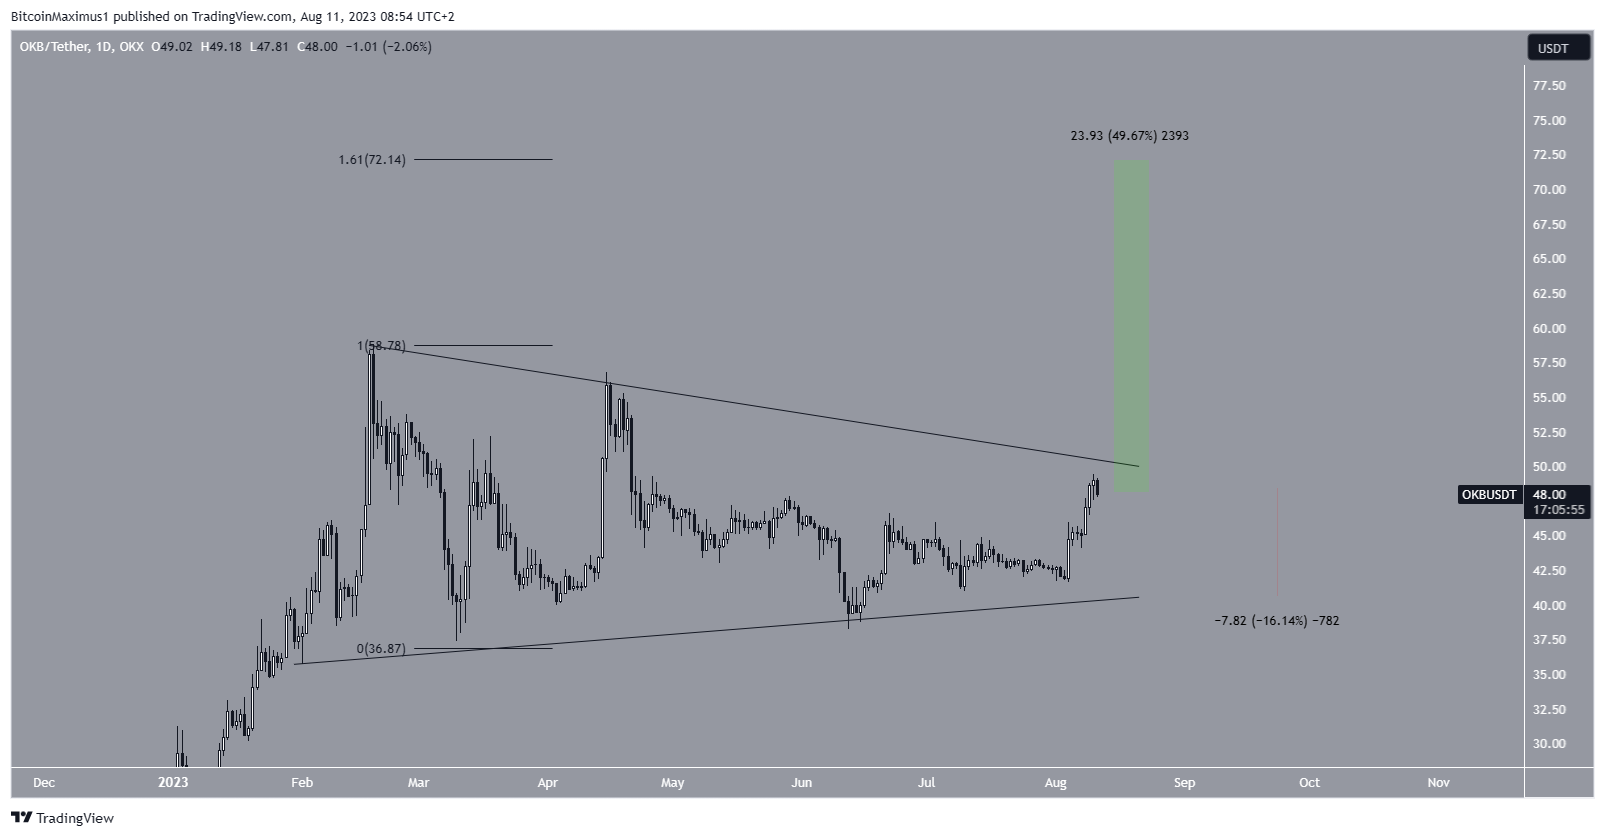
On the other hand, if OKB gets rejected again, it can fall by 16% to the triangle’s support line at $40.
DYDX Approaches Resistance Line
The DYDX price has fallen under a descending resistance line since February. The line caused multiple rejections, the most recent on April 28 (red icon). The resistance line is currently at $2.25, slightly above the current price.
If DYDX breaks out, it can increase to the next resistance at $3.20, an upward movement of 45% measuring from the current price of approximately $2.16.
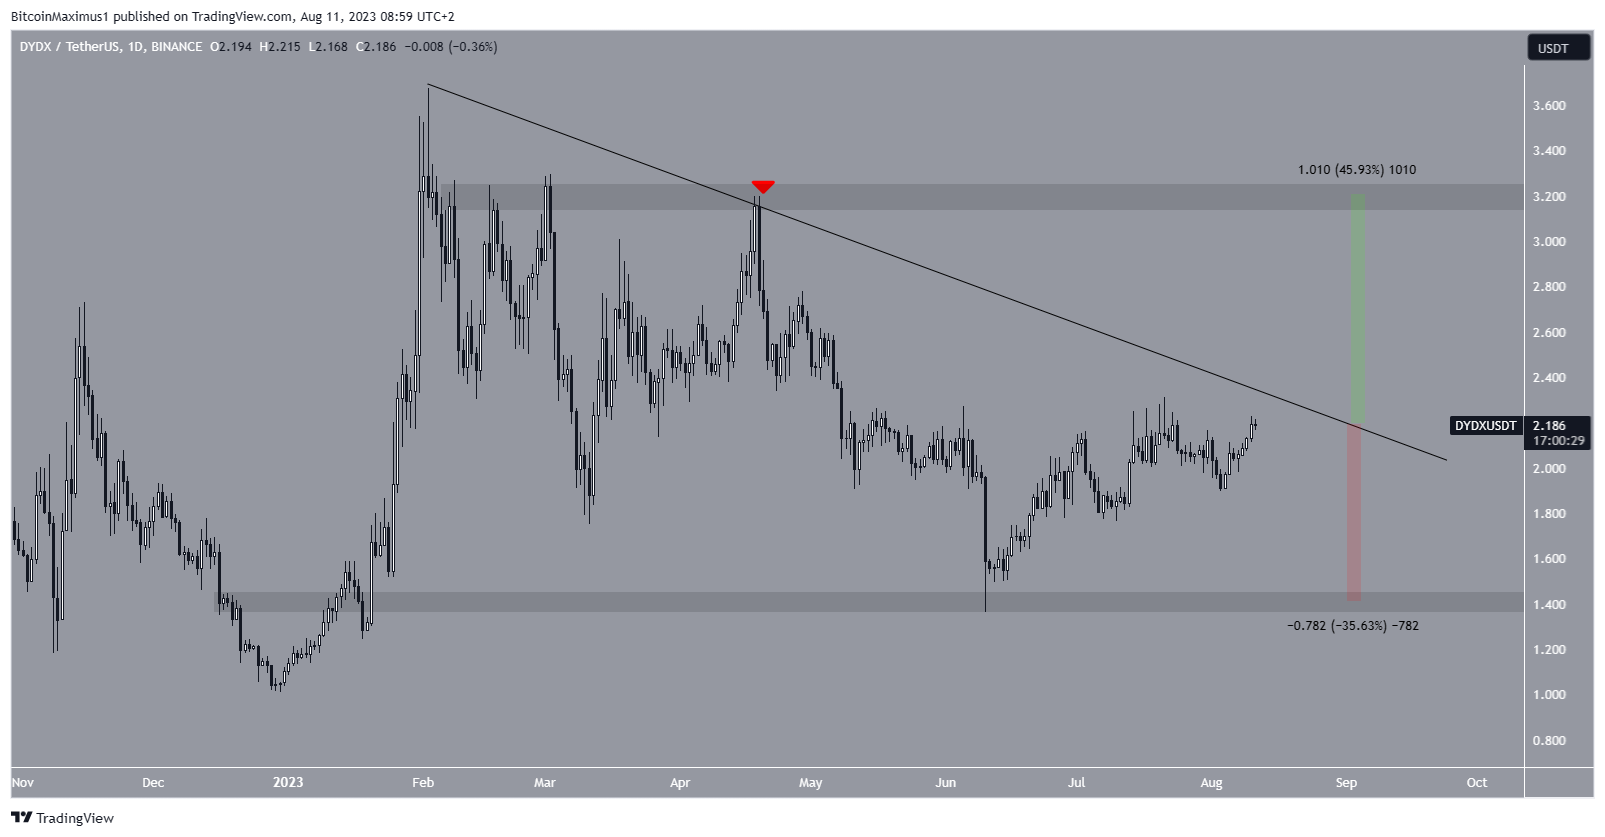
However, a 35% decrease to the $1.40 horizontal support area could occur if the price gets rejected.
Synthetix Network (SNX) Price Concludes Altcoin Gainers
The SNX price has fallen under a descending resistance line since the start of March. More recently, the line caused a rejection on July 21 (red icon). This led to a decrease that culminated with a low of $2.35 on August 4.
However, the price regained its footing immediately afterward and reclaimed the $2.50 horizontal area. These deviations are considered bullish signs that often lead to upward movements.
The SNX price can reach the resistance line at $2.90 if the increase continues. This is an upward movement of 14% measuring from the current price.
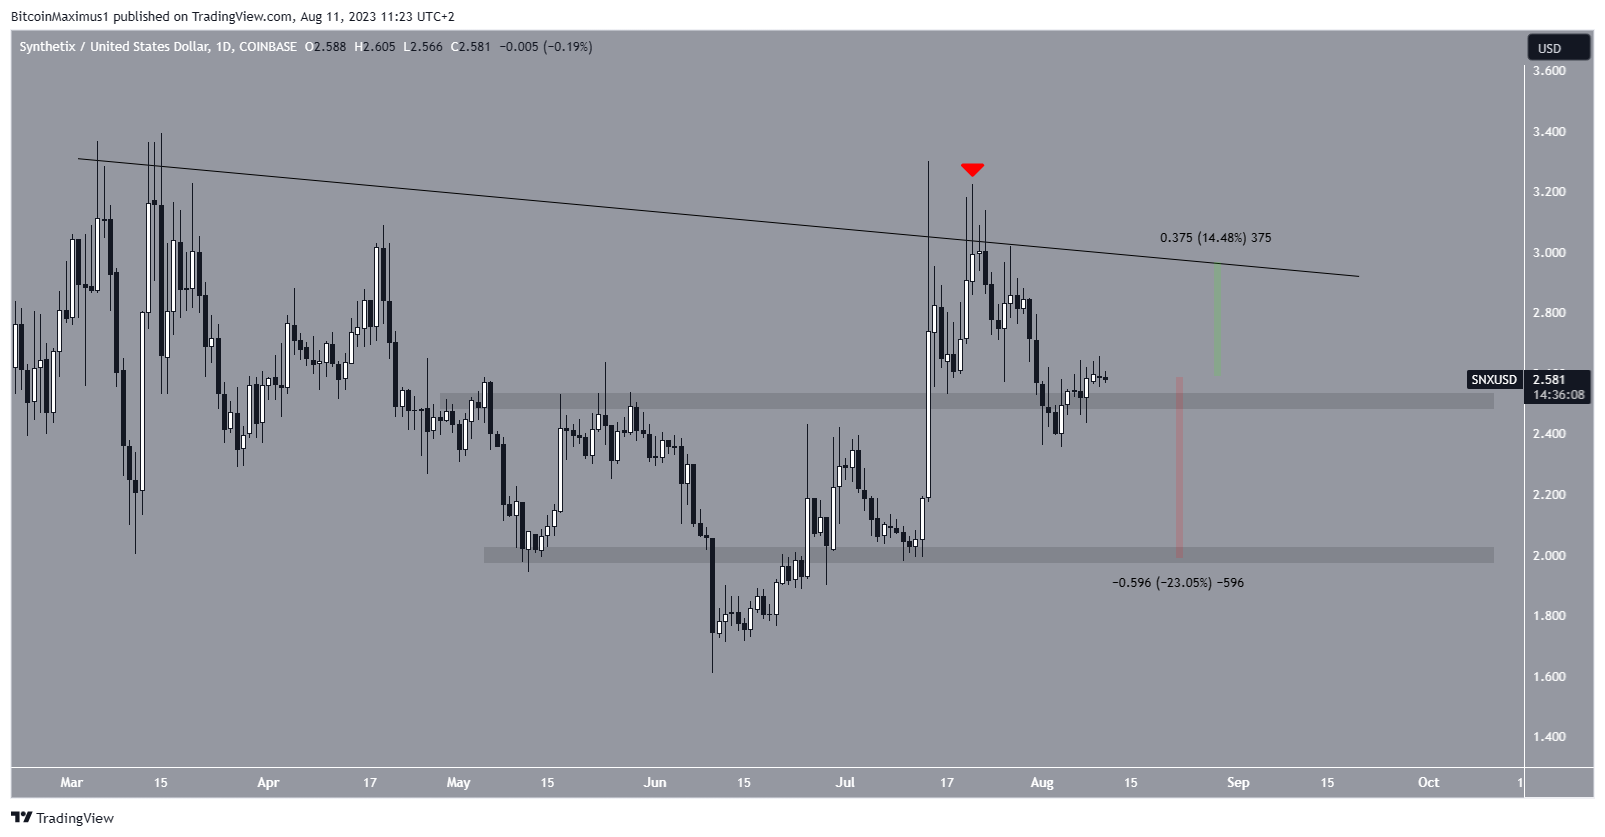
However, if SNX closes below the $2.50 area, a 23% decrease to the $2 support area will be the most likely price outlook.
For BeInCrypto’s latest crypto market analysis, click here


