

ALGO Price Fails to Break Out
The ALGO token price had fallen under a long-term descending resistance line since September 2021. Movements under a downward trending line suggest that the trend is bearish.
While the price attempted to break out from the line this week, that was unsuccessful. Rather, ALGO was rejected and is in the process of creating a bearish engulfing candlestick.
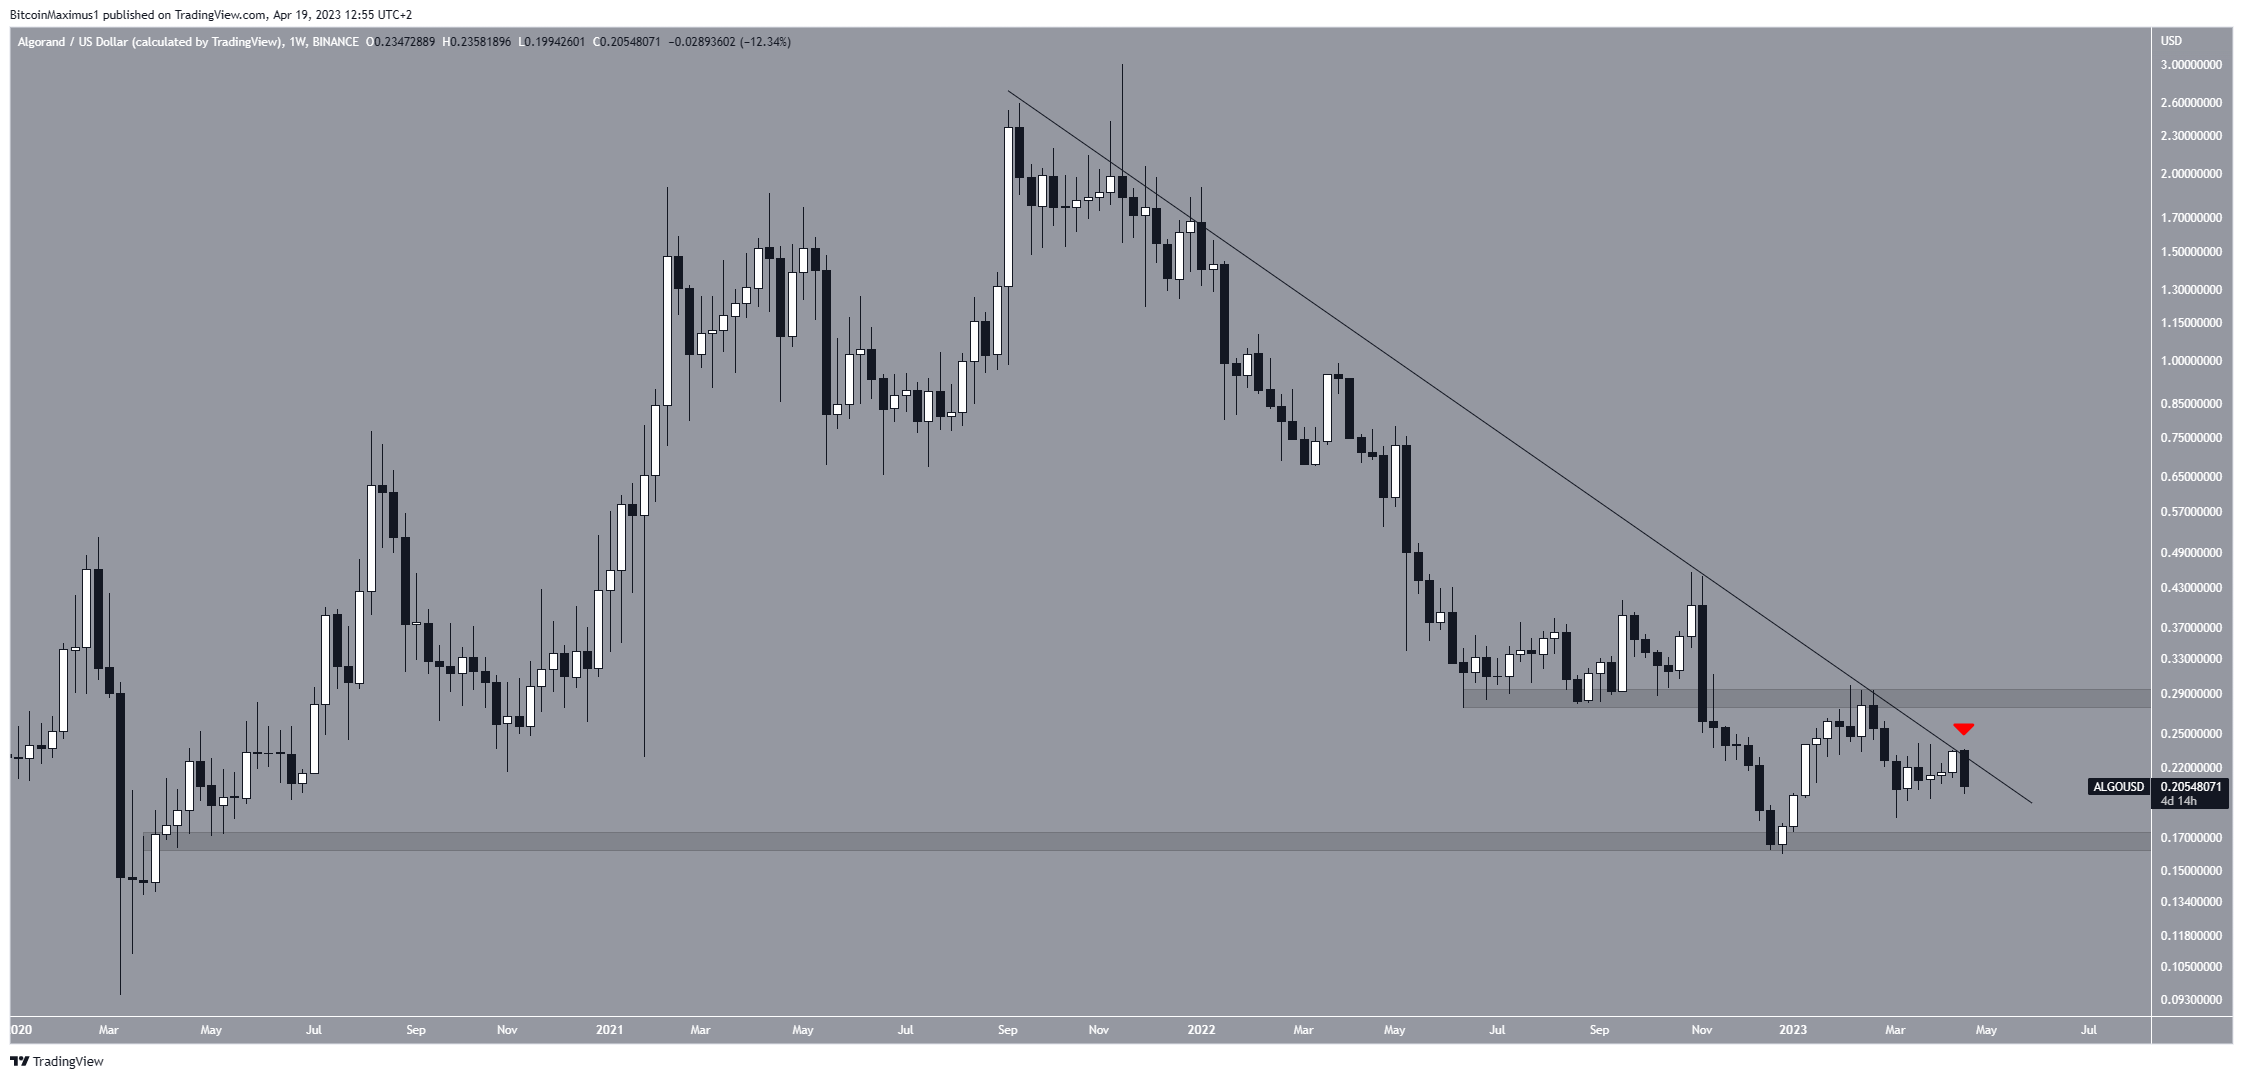
A bearish engulfing candlestick is a type of candlestick in which the entire previous period’s increase is negated in the next period. It is confirmed with a close below the previous period’s opening.
In the case of ALGO, a weekly close below $0.216 would be required to confirm the bearish candlestick. In that case, the next support would be at an average price of $0.170.
Algorand Price Prediction: Correction or Bearish Reversal?
The daily time frame technical analysis also provides a bearish ALGO price prediction. The main reasons for this are the three rejections from the $0.235 horizontal resistance area.
Now, the price has reached an ascending support line that has been in place since the beginning of the year. If the Algorand price breaks down from it, it will confirm that the trend is bearish since the structure that followed the entire movement would now be broken.
The bearish outlook is also evident by the Relative Strength Index (RSI).
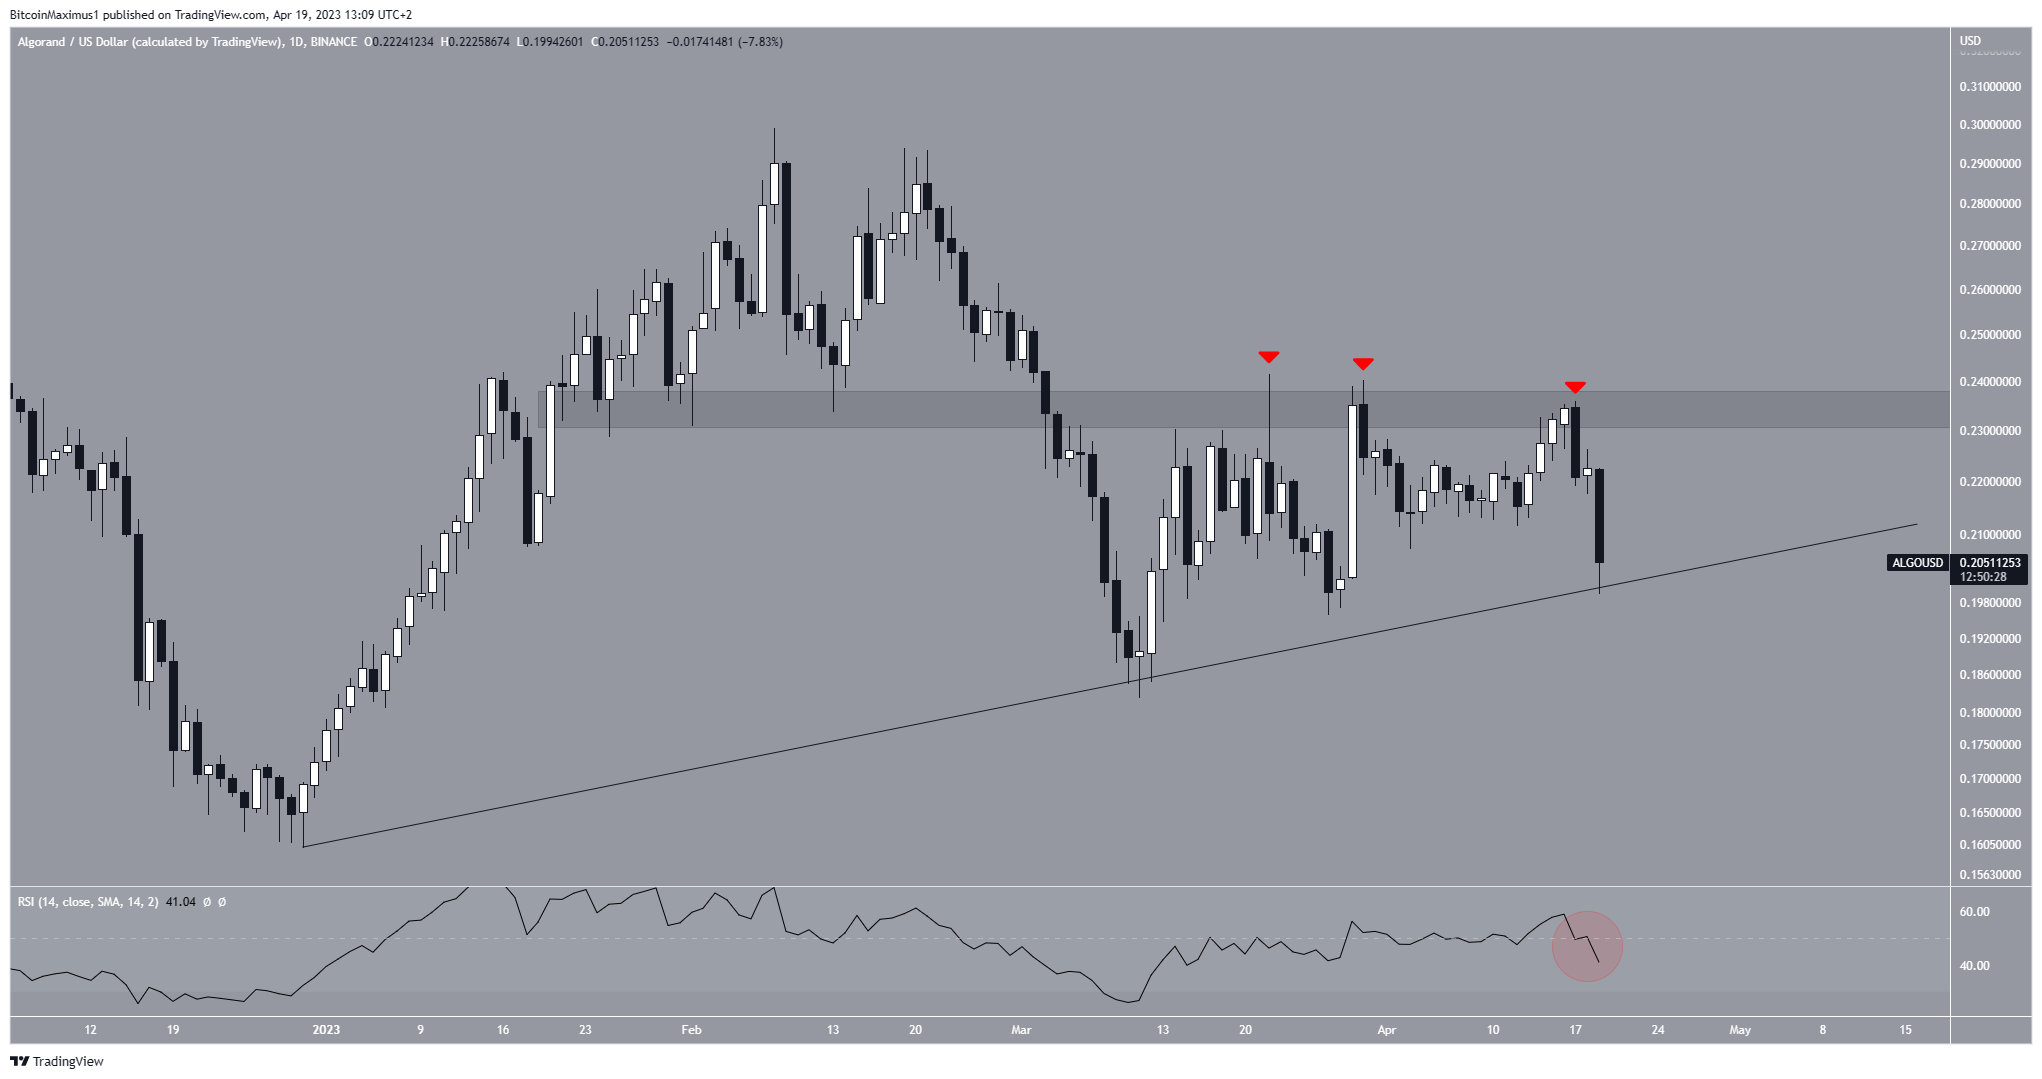
The RSI is a momentum indicator used by traders to determine overbought or oversold conditions. A downward trend and a reading below 50 suggest that the bears have the upper hand. In the case of ALGO, the RSI gave a failed bullish signal by moving above 50. The ensuing decrease (red circle) below it indicates that the trend is still bearish.
On the other hand, a daily close above the $0.235 resistance area would indicate that the trend is bullish instead. In that case, the ALGO price can increase to the yearly highs near $0.295.
For BeInCrypto’s latest crypto market analysis, click here.
Disclaimer
In line with the Trust Project guidelines, this price analysis article is for informational purposes only and should not be considered financial or investment advice. BeInCrypto is committed to accurate, unbiased reporting, but market conditions are subject to change without notice. Always conduct your own research and consult with a professional before making any financial decisions. Please note that our Terms and Conditions, Privacy Policy, and Disclaimers have been updated.
