


Cardano’s price, like many other cryptocurrencies, is currently undergoing a corrective phase. The duration and trajectory of this correction are subjects of speculation among investors and analysts.
The key question remains: Will Cardano (ADA) experience a prompt recovery, regaining lost ground shortly, or is a further decline in its price imminent?
Cardano Price Battles 50-Day EMA Resistance at $0.64
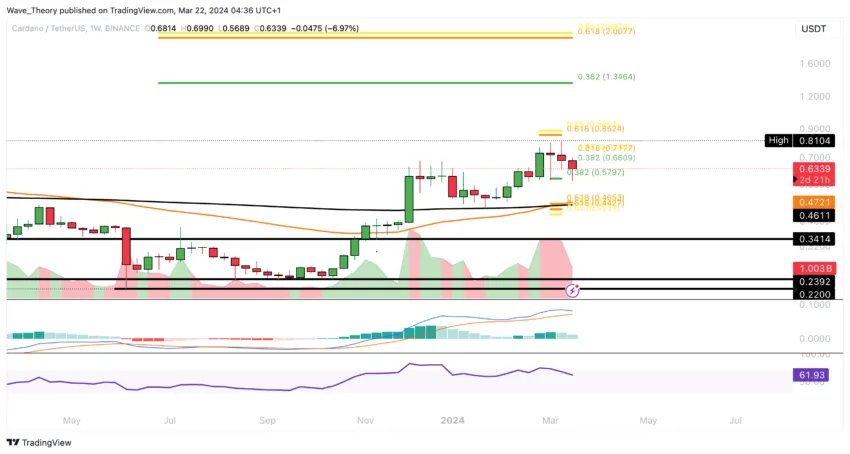
The ADA price experienced a correction from approximately $0.81 to around $0.57, triggered by a bearish divergence detected in the Relative Strength Index (RSI). Cardano found support at the 0.382 Fibonacci level, approximately $0.58, and is now encountering significant resistance at the 50-day EMA, around $0.64.
Breaking this resistance could pave the way for further gains, with the next significant hurdle at approximately $0.66. Alternatively, for Cardano to end its corrective phase, it must surpass the golden ratio level at around $0.72.
This breakthrough would signify a return to the upward trajectory, potentially targeting the golden ratio resistance at approximately $0.86. However, the current indicators present mixed signals on the daily chart.
Read More: How To Buy Cardano (ADA) and Everything You Need To Know
While the EMAs indicate a bullish trend in the short to medium term with a golden crossover, the RSI remains in neutral territory. The Moving Average Convergence Divergence (MACD) lines exhibit a bearish crossover, yet the MACD histogram has shown bullish momentum over the past three days.
Death Cross Looming in Cardano’s 4H Chart?
In Cardano’s 4-hour chart, a looming death cross signifies the potential confirmation of a short-term bearish trend. Adding to this bearish sentiment, the 50-4H and 200-4H EMAs converge at the 0.382 Fibonacci level, approximately at $0.66, serving as additional resistance points.
However, the indicators present a mixed picture. While the RSI remains neutral, the MACD lines are currently crossed in a bullish manner. Conversely, the MACD histogram displays a downward trend, signaling bearish momentum.
Is Cardano Headed Towards $0.47 Golden Ratio Support?
Cardano is anticipated to encounter significant Fibonacci support at the Golden Ratio level, around $0.47, if it undergoes a bearish breach of the 0.382 Fib level at approximately $0.58. This support zone is further reinforced by the presence of the 50-week and 200-week EMAs, which recently underwent a golden crossover, affirming a bullish trend over the medium term.
However, caution is warranted as both the RSI and the MACD histogram exhibited bearish divergences in the weekly chart, indicating downward pressure. Despite this, the MACD lines persist in a bullish cross, suggesting ongoing positive momentum.
As long as Cardano maintains its position above the golden ratio support level at around $0.47, the upward trajectory initiated at the end of the year remains viable.
Cardano Monthly Chart: No Bearish Signals Detected by Indicators
In the monthly chart, Cardano’s indicators remain devoid of bearish signals. Notably, the MACD histogram depicts an upward trend, complemented by bullishly crossed MACD lines, while the RSI maintains a neutral stance.
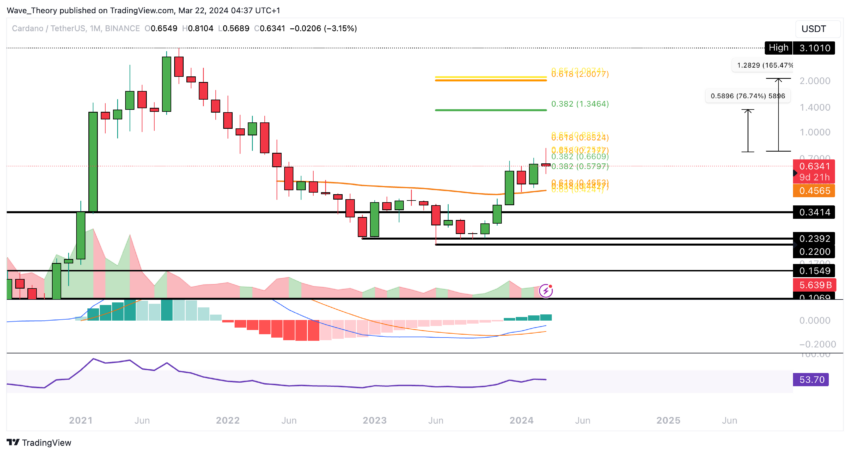
Cardano’s price encounters substantial support at the 50-month EMA, positioned at approximately $0.4565. Further bolstering this support is a robust foundation lying within the price range of $0.45 to $0.47.
Cardano Bears Break Golden Ratio Support Against Bitcoin
Against Bitcoin (BTC), Cardano has recently breached the critical golden ratio support, situated around 0.000011 BTC. Consequently, Cardano now faces horizontal support within the range of approximately 0.0000083 BTC to 0.0000097 BTC.
Furthermore, the current positioning of the MACD lines suggests a neutral stance, providing neither bullish nor bearish signals. However, the MACD histogram illustrates an upward trajectory in the monthly chart.
Read More: Cardano (ADA) Price Prediction 2024/2025/2030
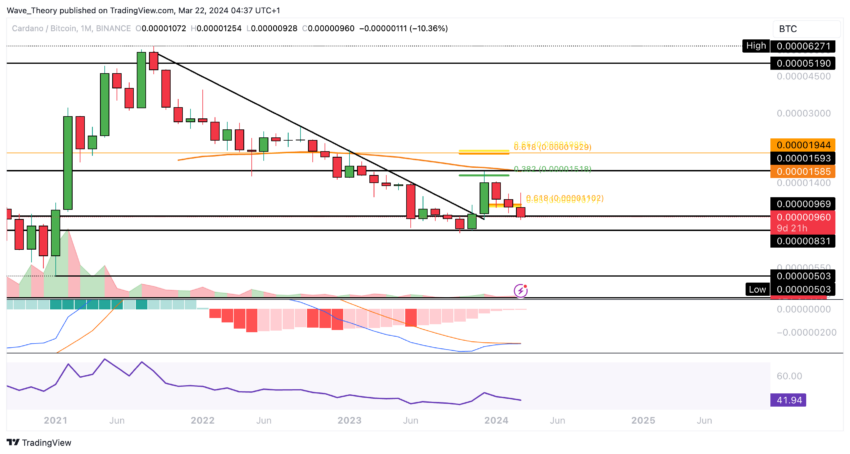
Meanwhile, the RSI maintains a neutral position, refraining from conveying either bullish or bearish signals.


