

Stellar (XLM) has been quietly moving higher, up 10% in the past week and 3% in the last 24 hours, but the pace is far from explosive. This is despite the token breaking out of a bullish pattern on the daily chart earlier this month.
If the structure remains bullish, why hasn’t price surged? The answer lies in a tug-of-war between supply and demand that’s playing out on-chain and on the charts.
Supply Side Pressure: Exchange Balances at Record Levels
The first clue comes from XLM’s exchange balances. Over the past year, these have climbed to a record 1.03 billion XLM (almost $469.7 million), with the July–August reading of 1.02 billion XLM marking one of the highest points in history.

In practice, high balances mean more tokens are sitting on exchanges, readily available for traders to sell.
This creates a ceiling effect: every push higher risks meeting a wave of sell orders. That supply overhang may explain why, even after a bullish breakout, the Stellar price hasn’t yet followed through with the kind of rally seen in other altcoins.
For token TA and market updates: Want more token insights like this? Sign up for Editor Harsh Notariya’s Daily Crypto Newsletter here.
Demand Side Pushback: Money Flow Index Curling Up
Against this heavy supply backdrop, buying pressure hasn’t vanished. The daily Money Flow Index (MFI), which blends price action with volume to track real capital flows, is holding above 50 at 51.32, and has recently curled higher after avoiding a retest of July’s lows near 29.
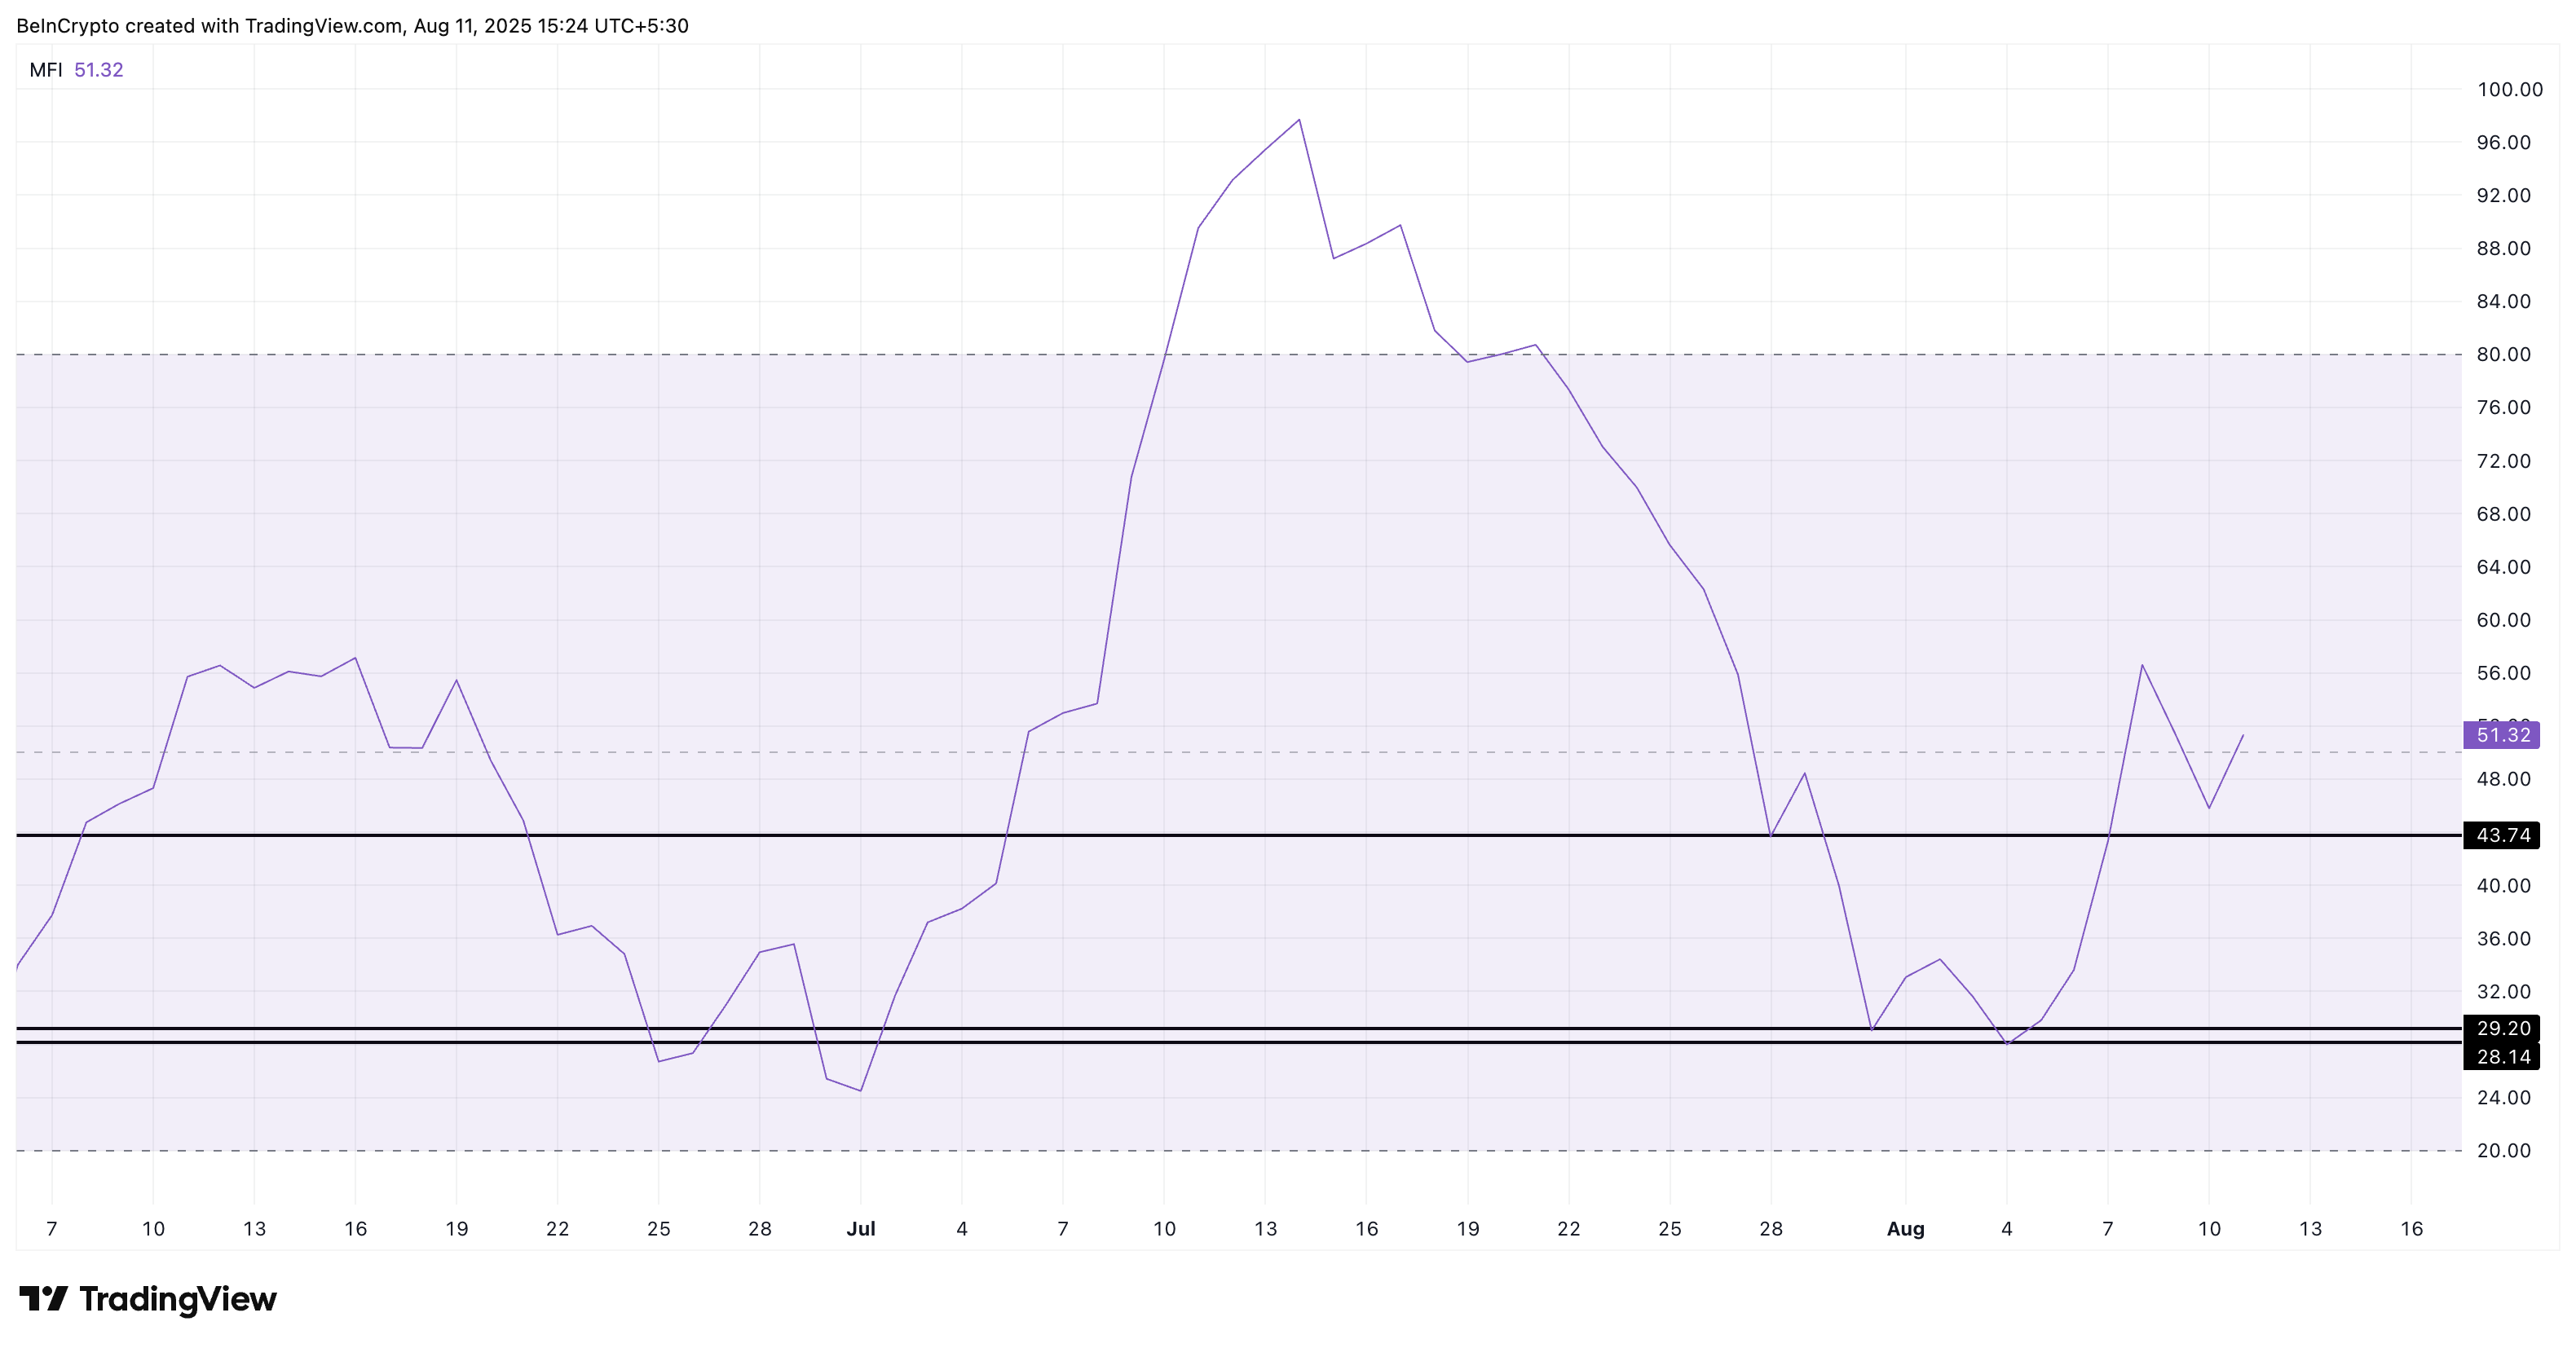
This suggests that while sellers are parked and ready, there’s still meaningful inflow into XLM. Buyers are active enough to keep prices from breaking down, but not yet strong enough to overpower the record supply. This balance of forces is keeping the market in a holding pattern.
Zooming In: 4-Hour Stellar Price Chart Shows a Bullish Structure With Fading Momentum
To see if this buyer-seller deadlock is close to breaking, we turn to the 4-hour chart. Here, the XLM price is holding inside an ascending triangle; a bullish continuation setup, with key support at $0.44 and resistance levels at $0.46 and $0.47.
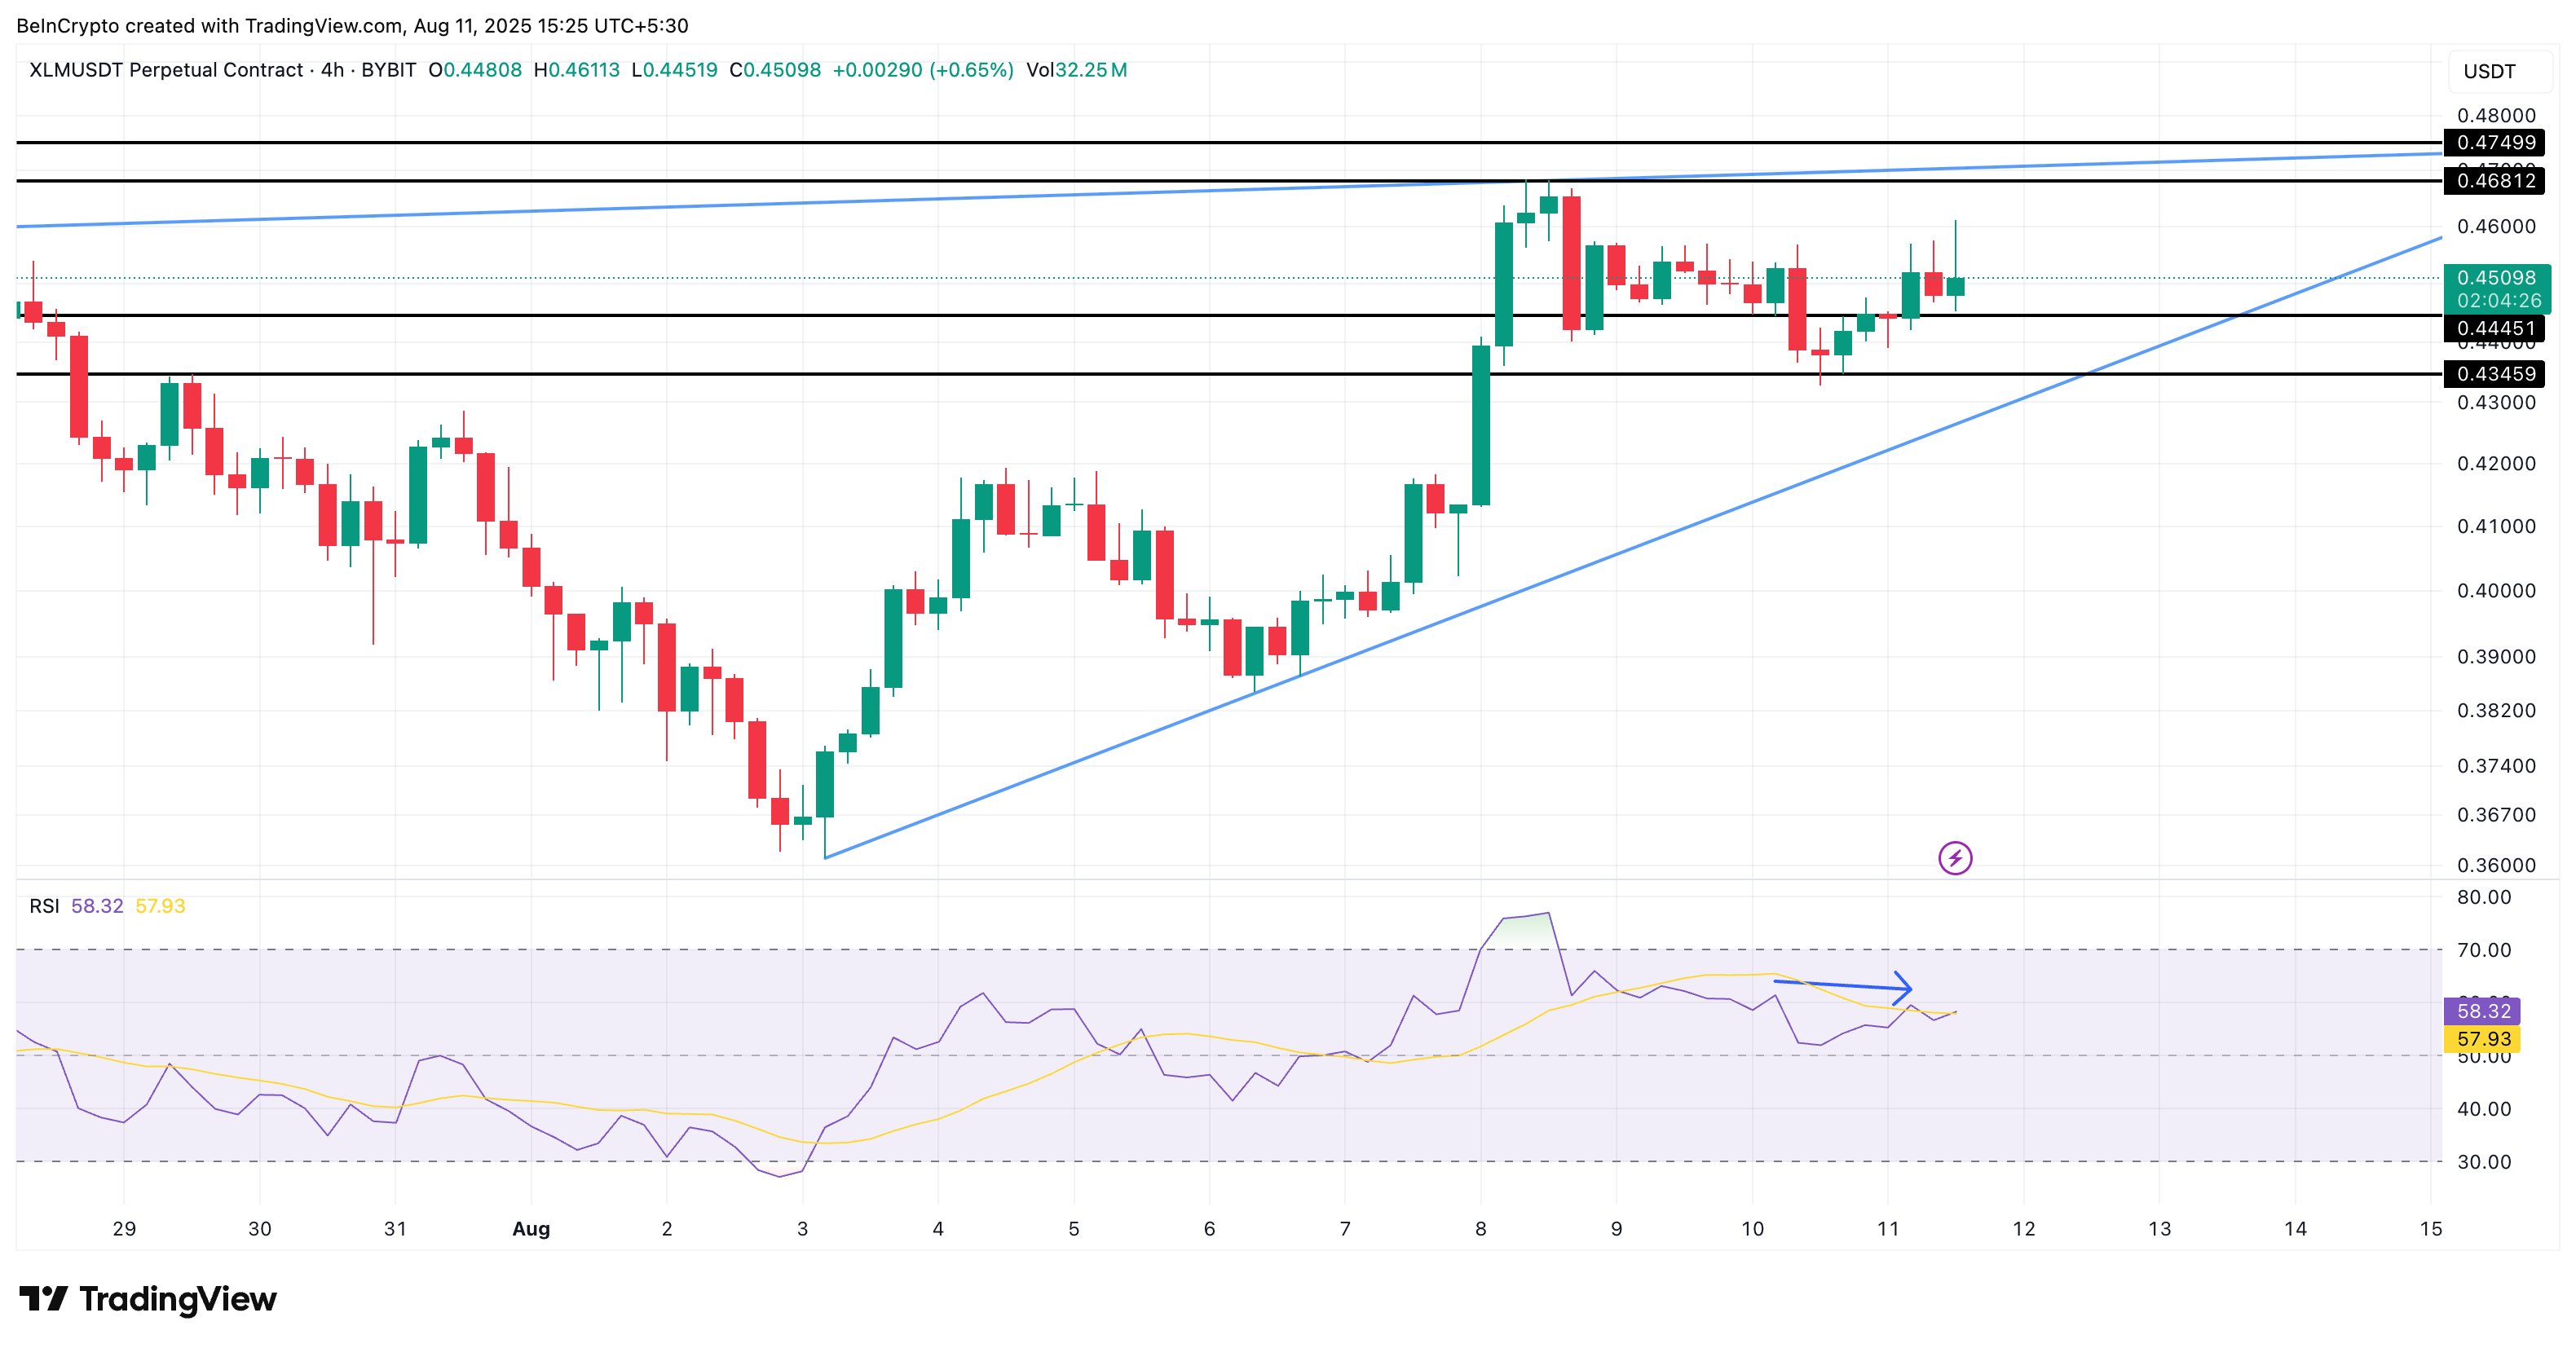
Yet momentum is showing cracks. The RSI on this timeframe has printed a lower high even as the price hit a higher high, hinting at short-term exhaustion. Combined with the high exchange balances, this slowdown explains why Stellar is still range-bound despite a bullish structure.
A break above $0.47 could propel the Stellar (XLM) price to new highs, as that would also mean a clean pattern breakout. That level also aligns with the short-liquidation cluster.
If the price manages to reach $0.47, shorts getting liquidated would be able to push the XLM prices higher, more like a cascading rally.

But then, according to the chart, if the price corrects and dips below $0.43, the bullish structure would be at risk—even from the long-side positions that get liquidated at $0.43 and lower.
Disclaimer
In line with the Trust Project guidelines, this price analysis article is for informational purposes only and should not be considered financial or investment advice. BeInCrypto is committed to accurate, unbiased reporting, but market conditions are subject to change without notice. Always conduct your own research and consult with a professional before making any financial decisions. Please note that our Terms and Conditions, Privacy Policy, and Disclaimers have been updated.
