Ethereum’s (ETH) recent price increase to $2,500 was a much-needed boost for the altcoin, which some crypto investors have written off. As the price increased, holders seized the opportunity to book profits by transferring 163,840 ETH into exchanges in the last 24 hours.
This development has raised concerns about the cryptocurrency’s ability to retest $3,000. With challenges possibly ahead, this on-chain analysis examines the implications of the recent influx.
Ethereum Sees Huge Exchange Inflows
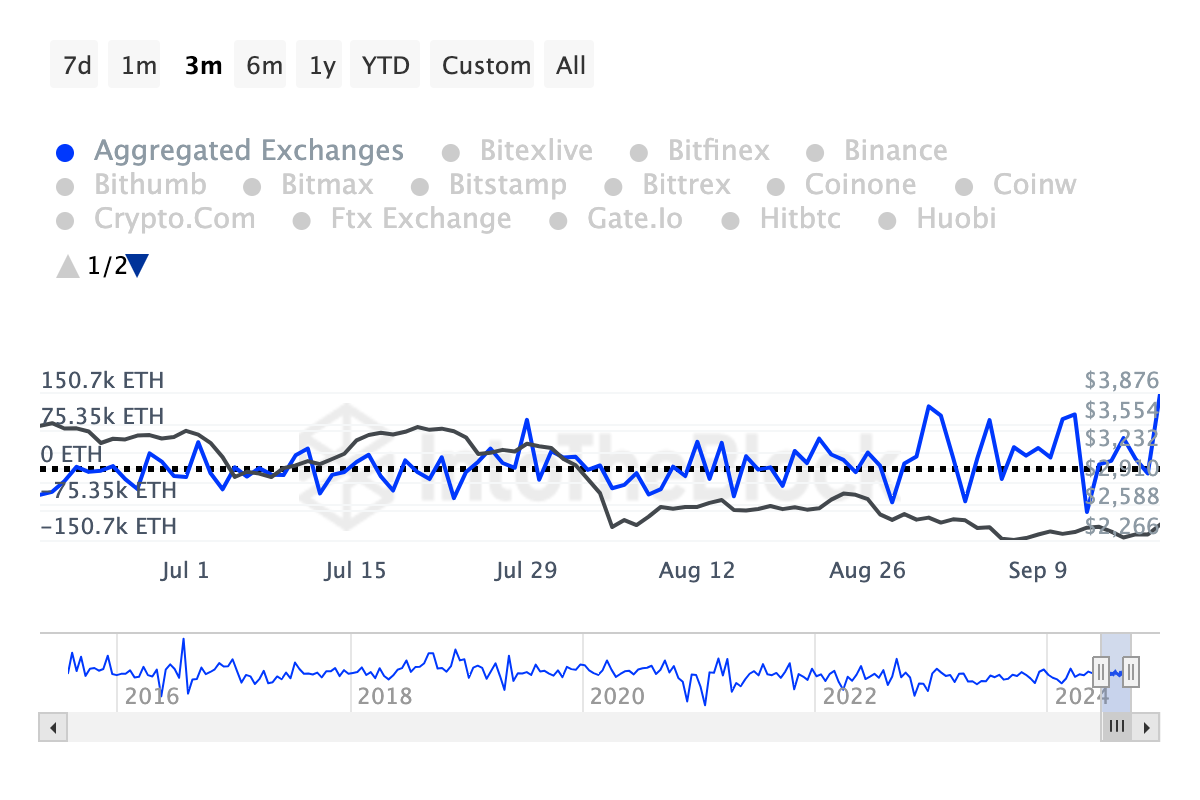
Ethereum’s massive exchange inflow started around September 18. During that period, only a small number flowed into exchanges after the coin positively reacted to the Fed rate cut.
However, according to IntoTheBlock, 163,840 ETH has been sent to exchanges in the last 24 hours. With ETH priced at $2,546, this volume translates to over $400 million. This spike represents the highest inflows since January 23, when 567,390 ETH entered these platforms.
Such significant inflows typically indicate increasing selling pressure, as it appears holders are locking in profits from the recent price hike. Additionally, the surge puts ETH’s price at risk of another downturn.
Read more: 9 Best Places To Stake Ethereum in 2024

For instance, after the massive inflows in January, the altcoin’s value plummeted from $2,454 to $2,217 within a few days. If history repeats itself, Ethereum’s price could decrease in the short term.
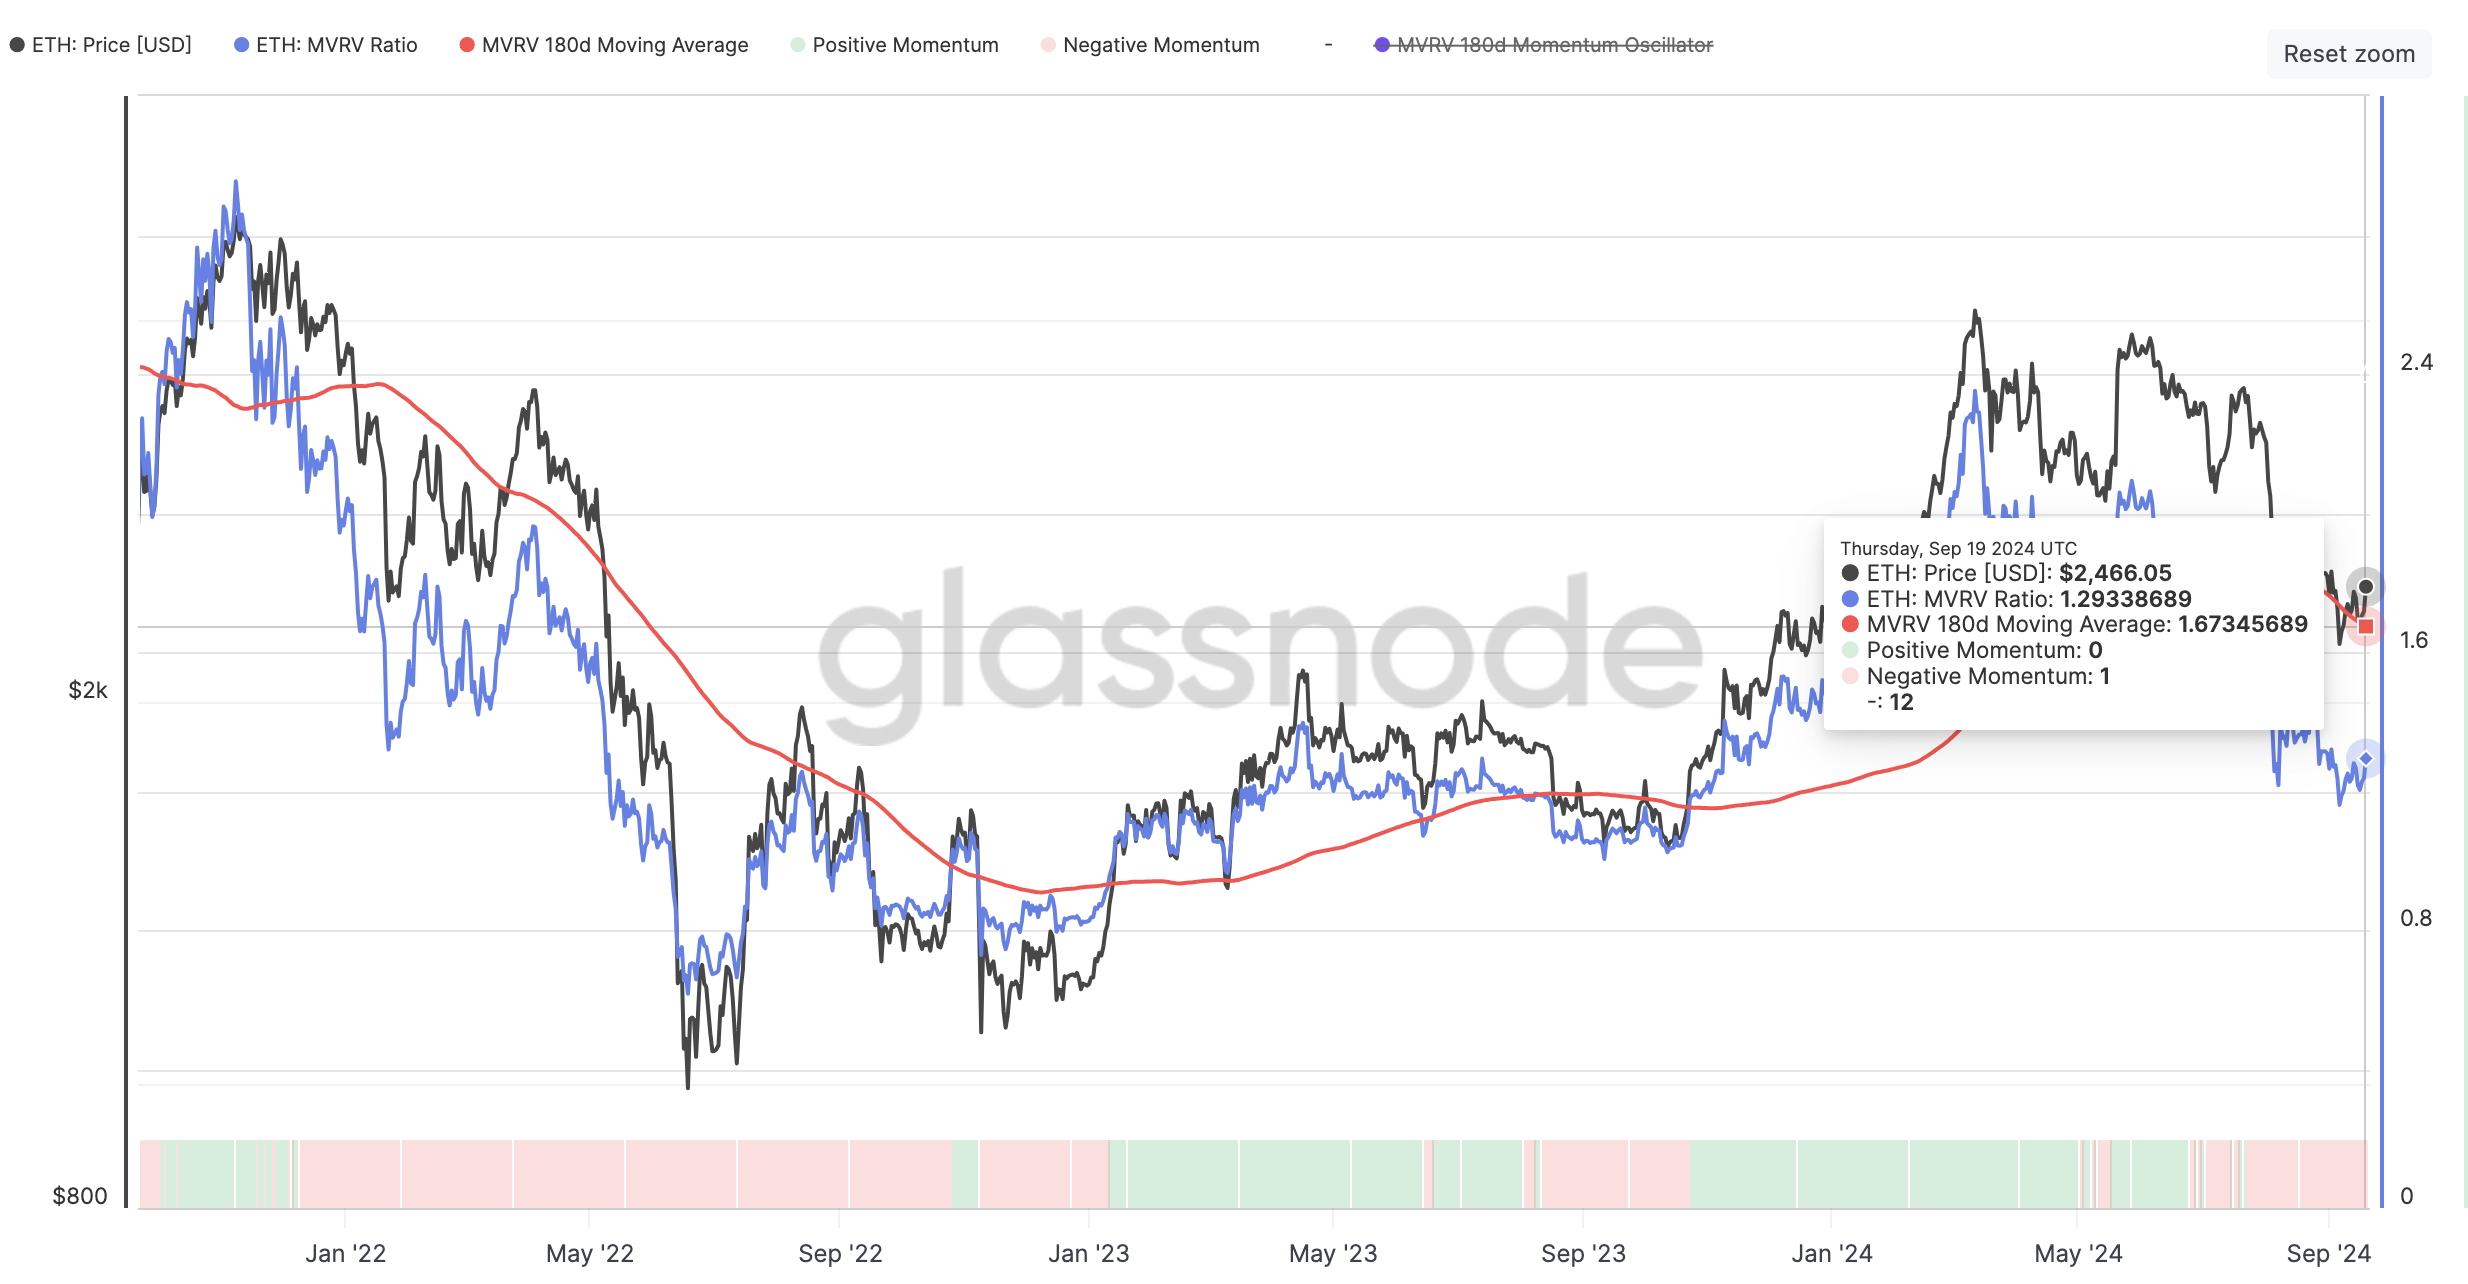
Another indicator suggesting a pullback is Ethereum’s Market Value to Realized Value (MVRV) momentum. This indicator employs the 180-day Simple Moving Average (SMA) to spot periods of uptrends and downtrends.
Positive MVRV momentum shows green bars, indicating that investors acquired large volumes below the current price, and a further uptrend is likely. However, for ETH, the momentum is negative (red), as holders bought large ETH volumes above $2,546, suggesting that the coin could still face heavy distribution.

ETH Price Prediction: Retracement Looms
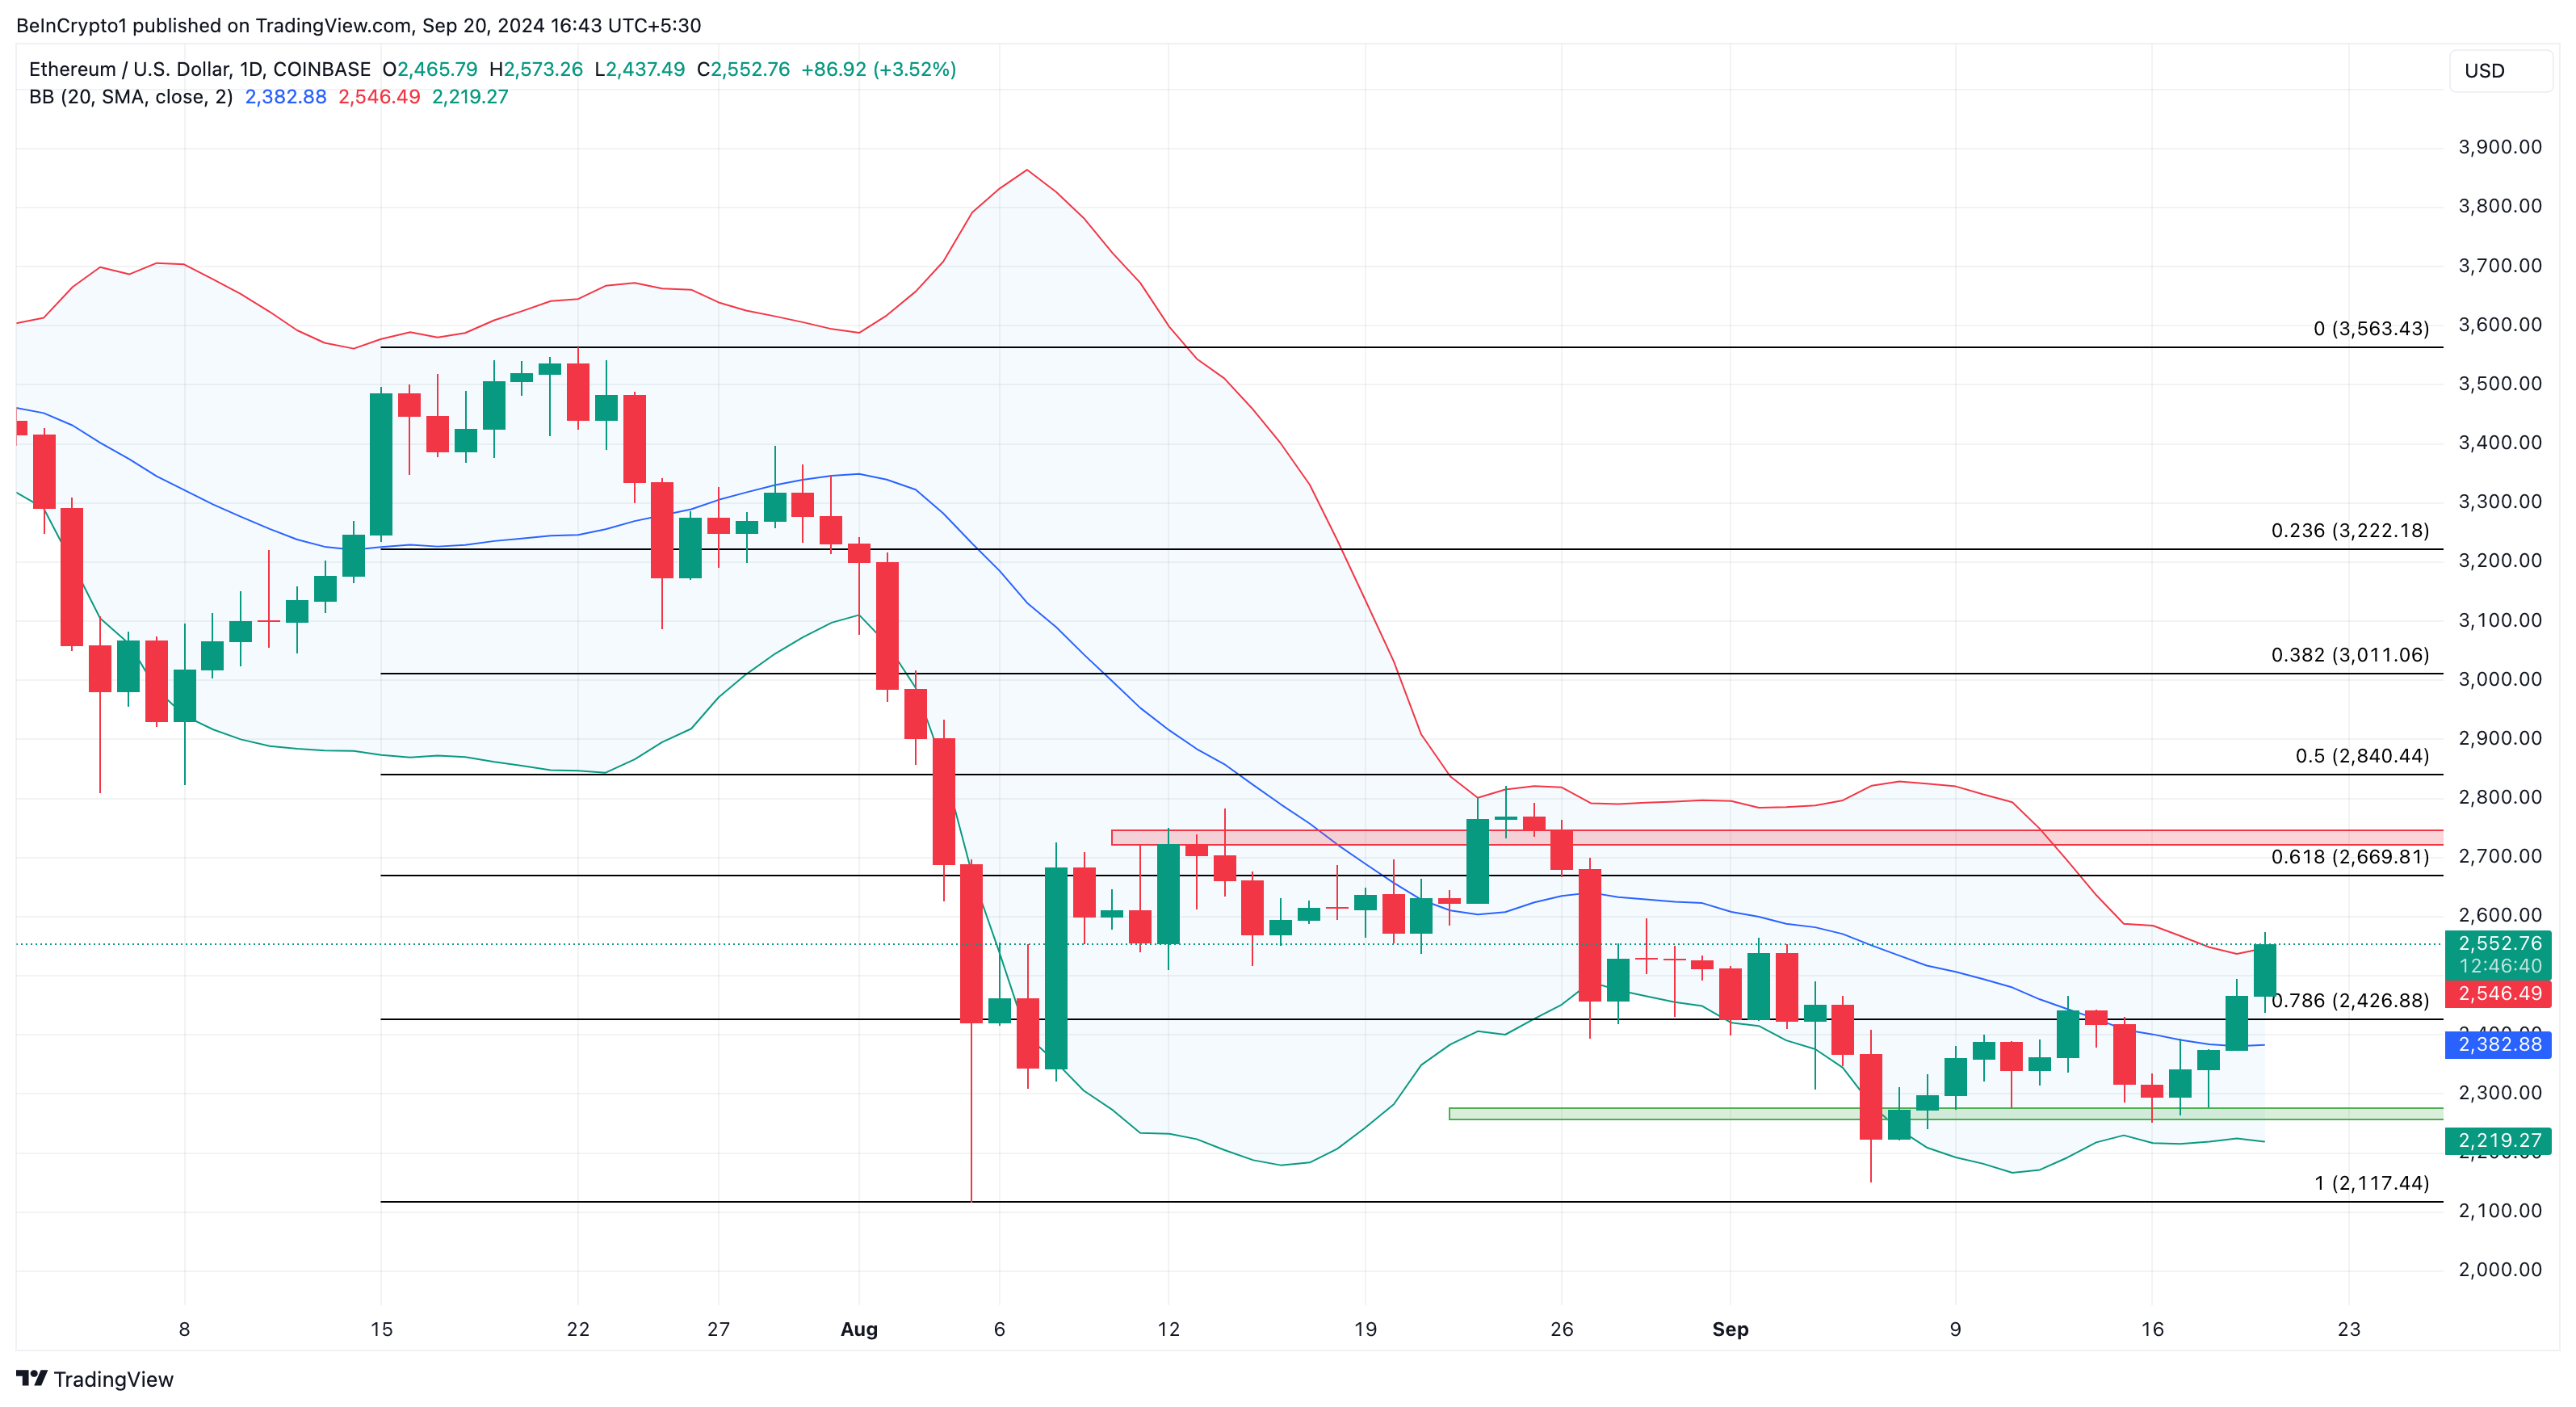
Amid a bullish recovery, Ethereum’s price has recently climbed to $2,554. The last time it traded around that region was in August. As the price climbs higher, the daily chart shows that ETH has hit the upper bands of the Bollinger Bands (BB) indicator.
The BB shows if there is extreme or low volatility around a cryptocurrency. It is also vital in spotting oversold and overbought conditions. When the BB expands, volatility is high, and contraction indicates otherwise.
In addition, if the price hits the lower band of the indicator, a crypto is oversold. In ETH’s case, it is overbought since the altcoin tapped the upper band. Furthermore, BeInCrypto also spots a supply zone around $2,745, which could hinder ETH from revisiting $3,000.
Read more: Ethereum (ETH) Price Prediction 2024/2025/2030

By the look of things, Ethereum’s price could face a drawdown to $2,275 in the short term. On the contrary, if the price bounces above the BB’s upper band, this prediction might be invalidated, and ETH could hit $2,840.
Disclaimer
In line with the Trust Project guidelines, this price analysis article is for informational purposes only and should not be considered financial or investment advice. BeInCrypto is committed to accurate, unbiased reporting, but market conditions are subject to change without notice. Always conduct your own research and consult with a professional before making any financial decisions. Please note that our Terms and Conditions, Privacy Policy, and Disclaimers have been updated.


