
XLM, the token that powers Stellar, a peer-to-peer (P2P) decentralized network, has declined by 15% in the past 30 days.
As trading activity plummets in its spot market, further aggravating the price decline, XLM’s derivatives market has also seen a decrease in its daily trading volume.
Stellar Derivatives Trader Exit Market
At press time, the trading volume in Stellar’s derivatives market is $31.04 million. It has dropped by 52% in the past 24 hours alone.
On-chain data show that since the token’s derivatives trading volume climbed to a year-to-date high of $78.18 million on March 12, it has declined. Since then, it has fallen by 60%. XLM’s trading volume as of this writing represents its lowest since May 1.
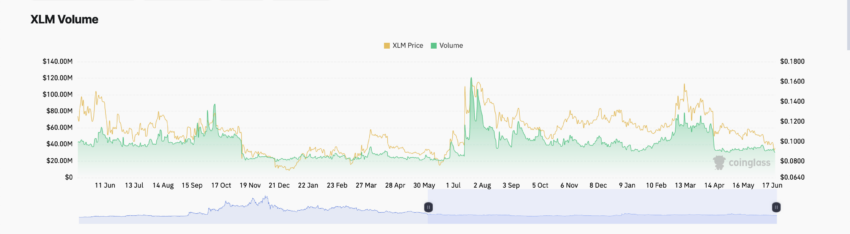
When an asset’s derivatives trading volume drops, it indicates a decline in investor interest in its futures and options contracts.
This decline may be because traders are losing interest in speculating on the asset’s price movements. This suggests that more investors are refraining from trading and are adopting a wait-and-see approach.
This may be the case in XLM’s spot market, as a key on-chain metric suggests a decline in the demand for altcoin. Readings from the token’s Relative Strength Index confirm this. XLM’s RSI is currently at 36.31 and in a downtrend.
Read More: How To Buy Stellar (XLM) and Everything You Need To Know
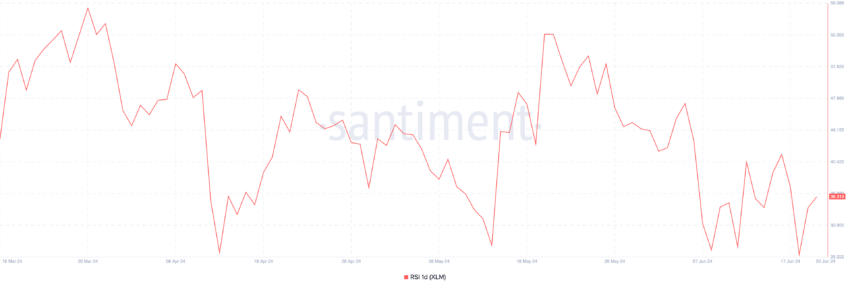
This metric measures an asset’s overbought and oversold conditions by tracking its price moments.
It ranges between 0 and 100, with values above 70 suggesting that an asset is overbought and due for a correction. In contrast, values below 30 indicate that the asset is oversold and may witness a rally.
At 35.26, XLM’s RSI shows that selling pressure outweighs buying momentum among market participants.
XLM Price Prediction: The Bulls Have to Defend Support
On June 8, XLM dropped below the lower line of a descending triangle, breaching a support level at $0.10 that had held from April 12 to June 7.
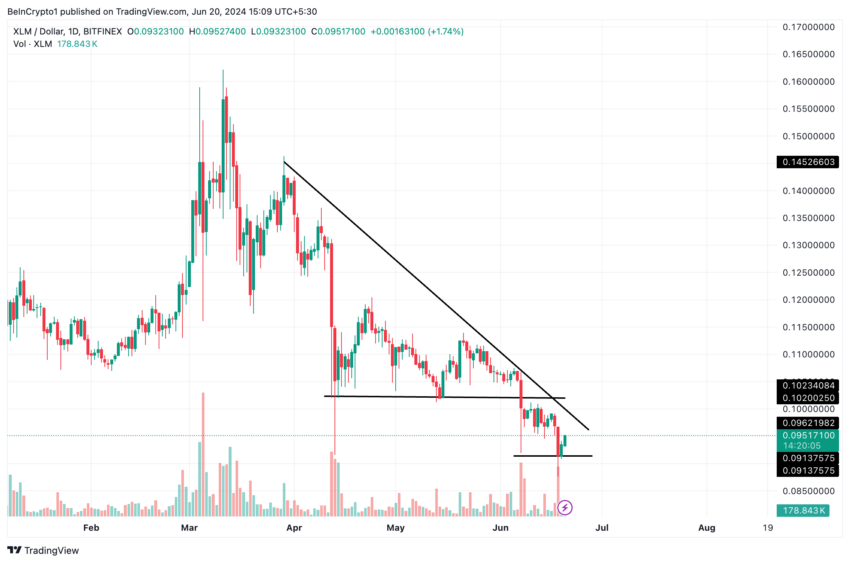
Since it broke below support, the token has lingered within a range, forming a horizontal channel. The long-term support level was flipped into resistance, and a new support level has since been formed at $0.09.
If demand for the altcoin continues to crater, the bulls might be unable to defend this new support level, and the token’s price might fall to $0.08.
However, if a spike in XLM demand occurs, this projection would be invalidated, and the token’s price might rally to $0.1
Disclaimer
In line with the Trust Project guidelines, this price analysis article is for informational purposes only and should not be considered financial or investment advice. BeInCrypto is committed to accurate, unbiased reporting, but market conditions are subject to change without notice. Always conduct your own research and consult with a professional before making any financial decisions. Please note that our Terms and Conditions, Privacy Policy, and Disclaimers have been updated.