The Cardano (ADA) price is trading in the middle of a long-term range after it was rejected by the range high in July.
The rejection was accentuated when the price broke down from a short-term ascending support line, suggesting that the ADA price is correcting.
Cardano Price Falls After Rejection From Range High
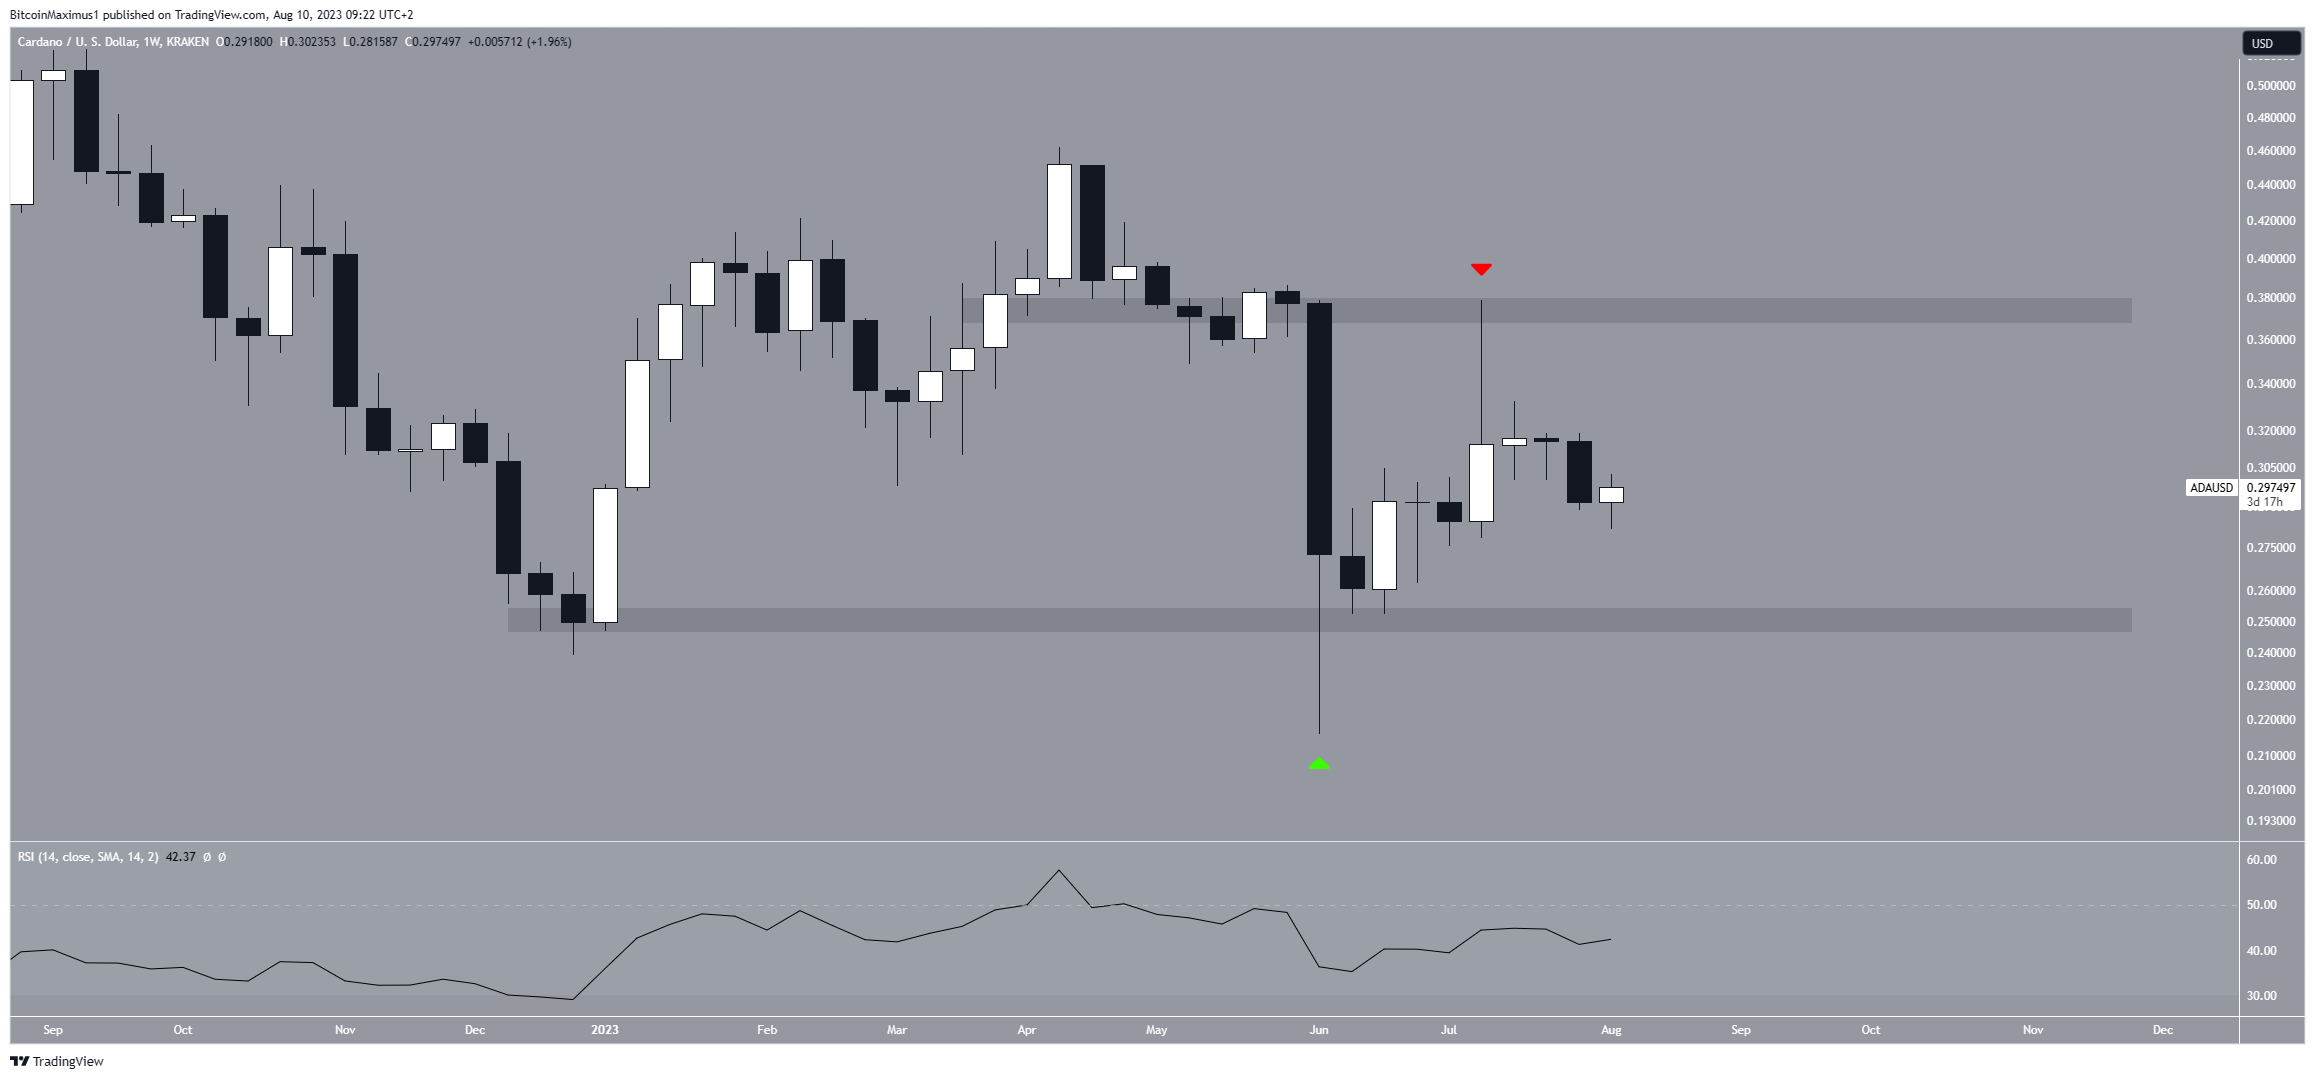
The technical analysis for the weekly timeframe shows that the ADA price has traded above the $0.25 horizontal area since the beginning of the year. While ADA briefly fell below it in June, it created a long lower wick (green icon).
This is considered a sign of buying pressure. Moreover, it saved the breakdown from the $0.25 horizontal area, both signs of a bullish trend.
Crypto investing, simplified. Get price predictions here:
While ADA reached a high of $0.38 in July, it failed to break out from the $0.38 horizontal area. Then, it validated it as resistance (red icon). The ADA price now trades between the $0.25 and $0.38 areas.

The weekly RSI does not confirm the trend’s direction. With the RSI as a momentum indicator, traders can determine whether a market is overbought or oversold and decide whether to accumulate or sell an asset.
Bulls have an advantage if the RSI reading is above 50 and the trend is upward, but if the reading is below 50, the opposite is true. While the RSI is increasing, it is below 50. Therefore, it fails to confirm the trend’s direction.
Nonetheless, it’s important to note that Charles Hoskinson, the creator of Cardano, revealed plans for a network enhancement aimed at significantly boosting the speed and effectiveness of the Cardano blockchain.
Read More: Best Crypto Sign-Up Bonuses in 2023
ADA Price Prediction: Breakdown Can Accelerate Drop to $0.25
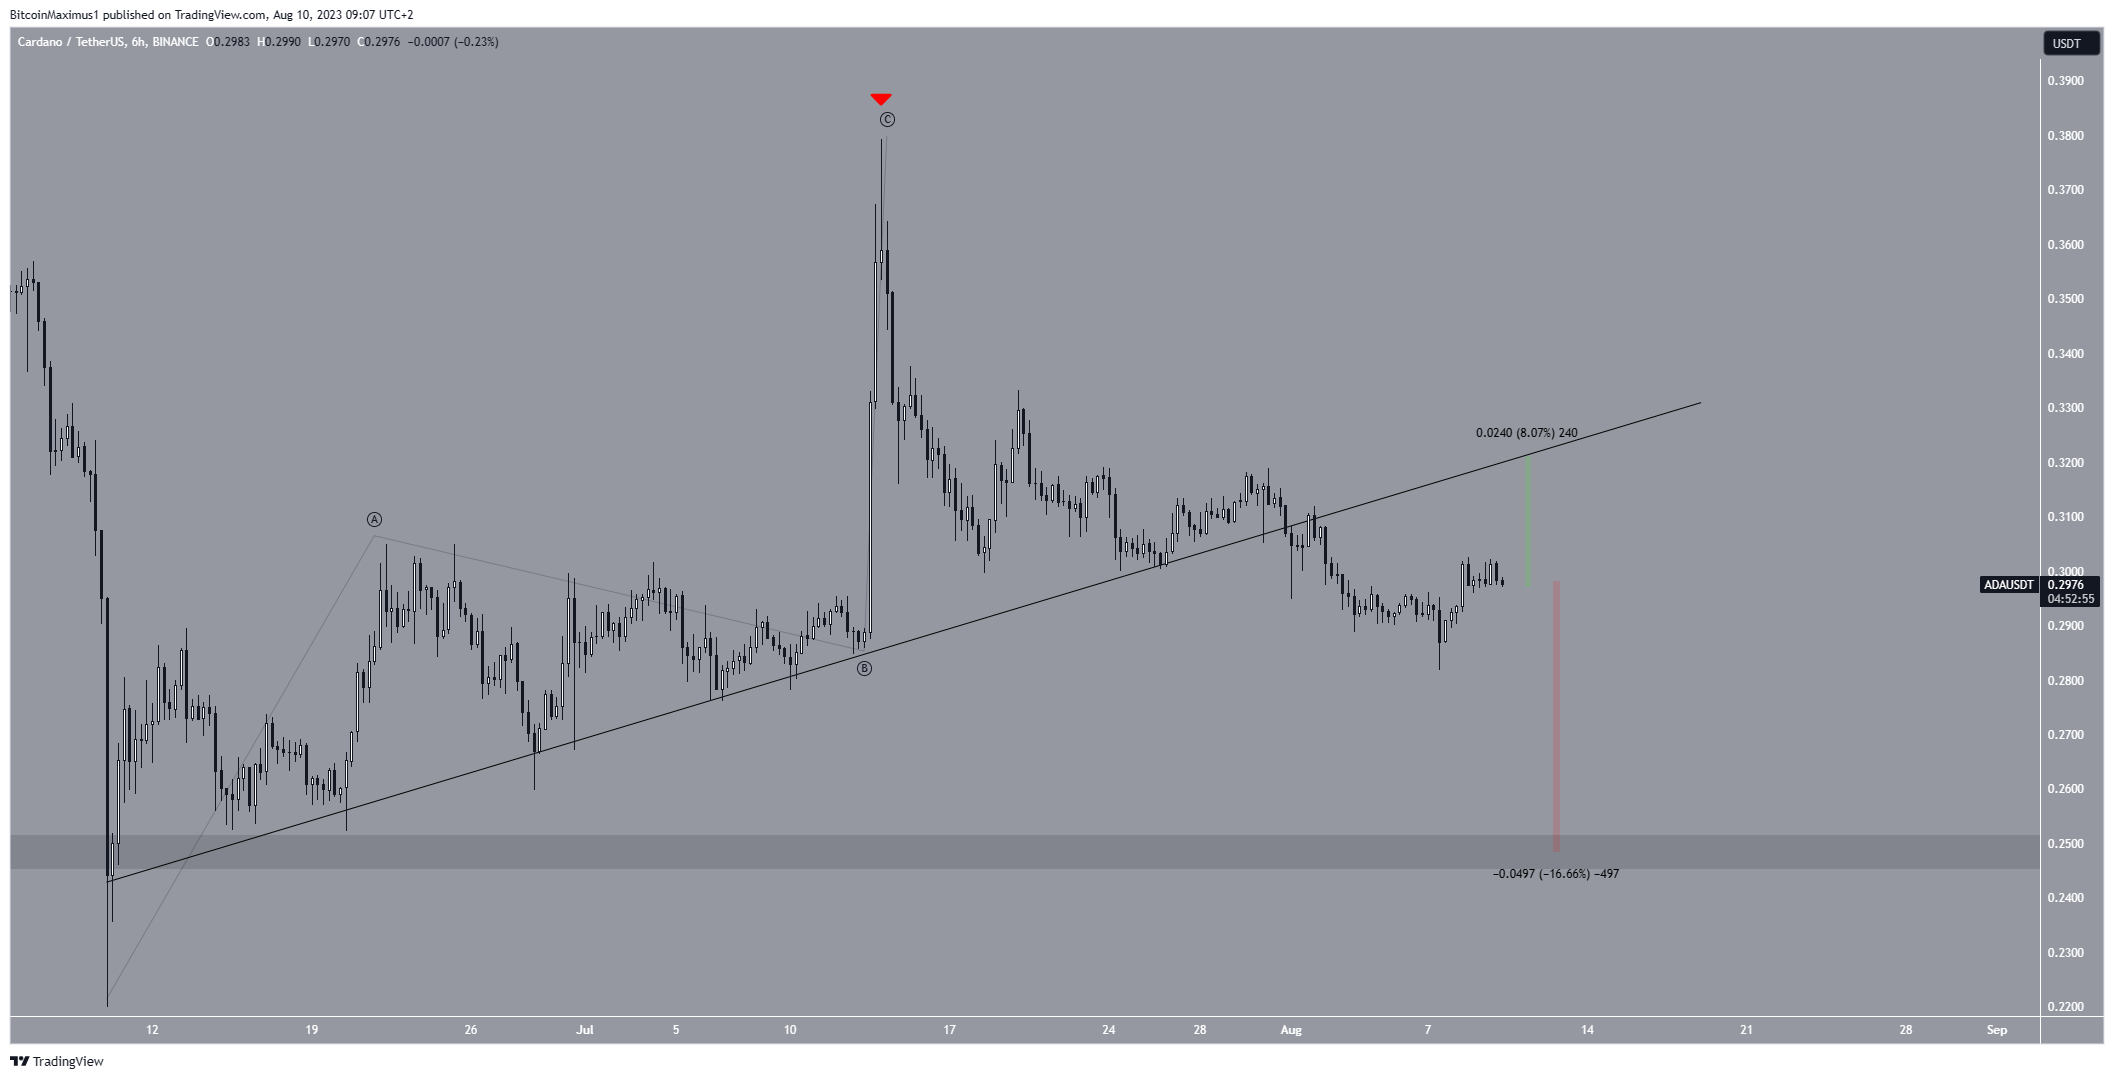
The technical analysis from the six-hour timeframe gives a bearish interpretation. This comes from both the price action and the Elliott Wave count.
The analysis of the Elliott Wave pattern indicates the conclusion of a corrective A-B-C structure (black). Given its upward orientation, this implies a likely emergence of a bearish trend.
Technical experts rely on the Elliott Wave theory to spot recurring extended price trends and investor sentiments, aiding in forecasting the trajectory of the trend.
This bearish outlook gained confirmation when the ADA price broke down from the short-term ascending support line on July 31. This event signifies the termination of the preceding increase.
If the ADA price continues to fall, it can decrease by another 17% and reach the $0.25 horizontal support area. However, if the price regains strength, it can increase by 8% and reach the ascending support line, validating it as resistance.

The ADA price prediction is bearish, and a drop to the $0.25 area is expected. Reclaiming the ascending support line will invalidate this bearish outlook. The ADA price can increase to the next resistance at $0.38 in that case.
For BeInCrypto’s latest crypto market analysis, click here.
Disclaimer
In line with the Trust Project guidelines, this price analysis article is for informational purposes only and should not be considered financial or investment advice. BeInCrypto is committed to accurate, unbiased reporting, but market conditions are subject to change without notice. Always conduct your own research and consult with a professional before making any financial decisions. Please note that our Terms and Conditions, Privacy Policy, and Disclaimers have been updated.


