
Even though April was a relatively stable month for the cryptocurrency market, these four altcoins managed to sustain most of their gains and even post a positive performance.
May has the potential to be a significant month for the altcoin market. If the market sees an upswing during this time, many altcoins could reach new all-time highs. This makes it an exciting time for traders and investors to keep a close eye on the market movements and take advantage of potential opportunities. BeinCrypto looks at 4 cryptos that could hit new all-time highs in May:
Render Token (RNDR) Clears Crucial Hurdle
The RNDR price has been one of the biggest gainers since the beginning of 2023, increasing by 500% in the process. This week, it managed to clear the $2.10 horizontal resistance area. This was a crucial level since the price had traded below it since April 2022.
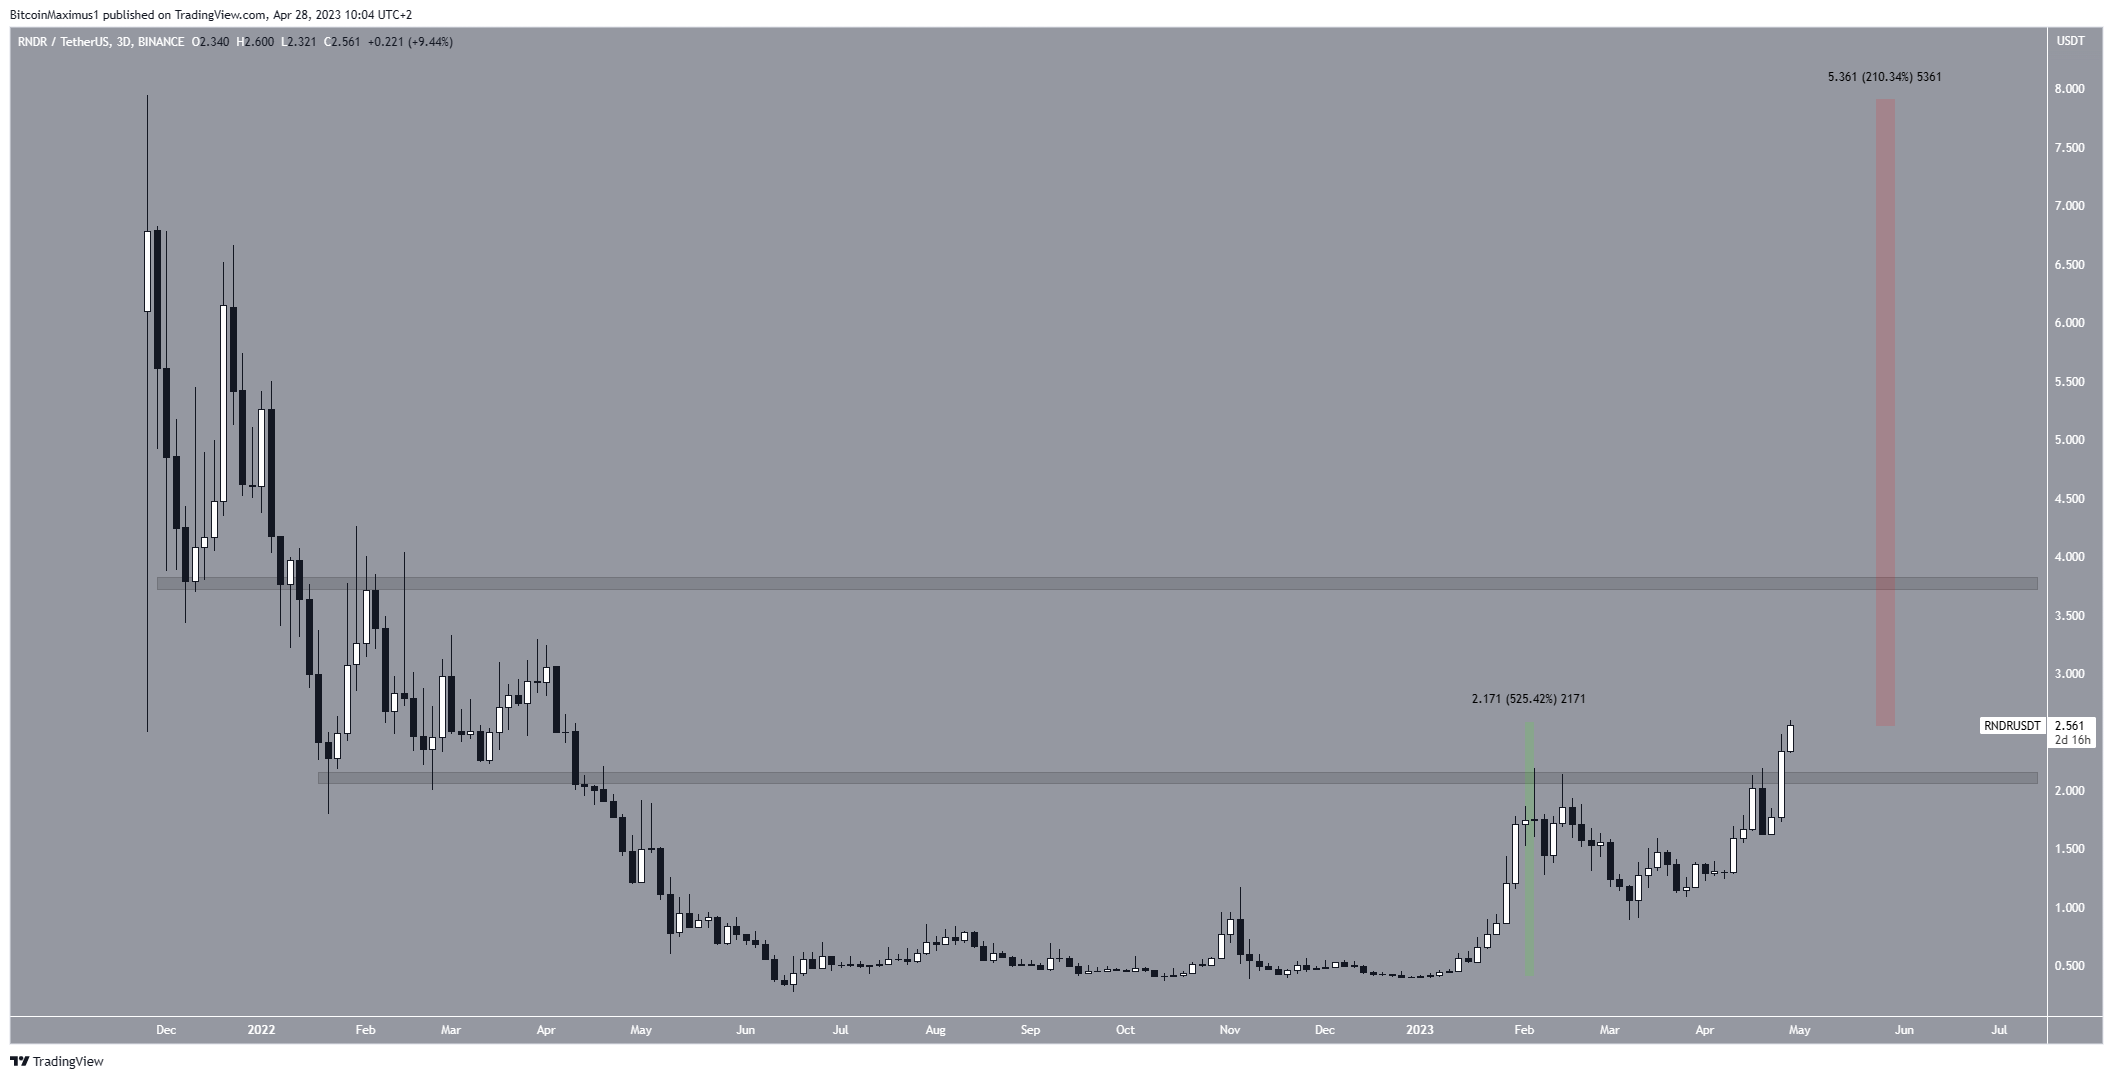
Even though the RNDR price is still 210% below its all-time high, only one major resistance remains at $3.80. So, if the price clears it, it will have an easier path at increasing to a new all-time high.
OKB (OKB) Price Wave Count Can Lead to New All-Time High
The OKB price has increased rapidly since June 2022. The increase resembles a five-wave (white) upward movement. If so, OKB is currently in wave four.
Technical analysts employ the Elliott Wave theory as a means to identify recurring long-term price patterns and investor psychology, which helps them determine the direction of a trend.
The shape of wave three and the presence of a symmetrical triangle in what could be wave four suggests that this is the correct count.
If so, the OKB price will break out from the triangle and increase toward the next resistance at $72.10. This would be a new all-time high price.
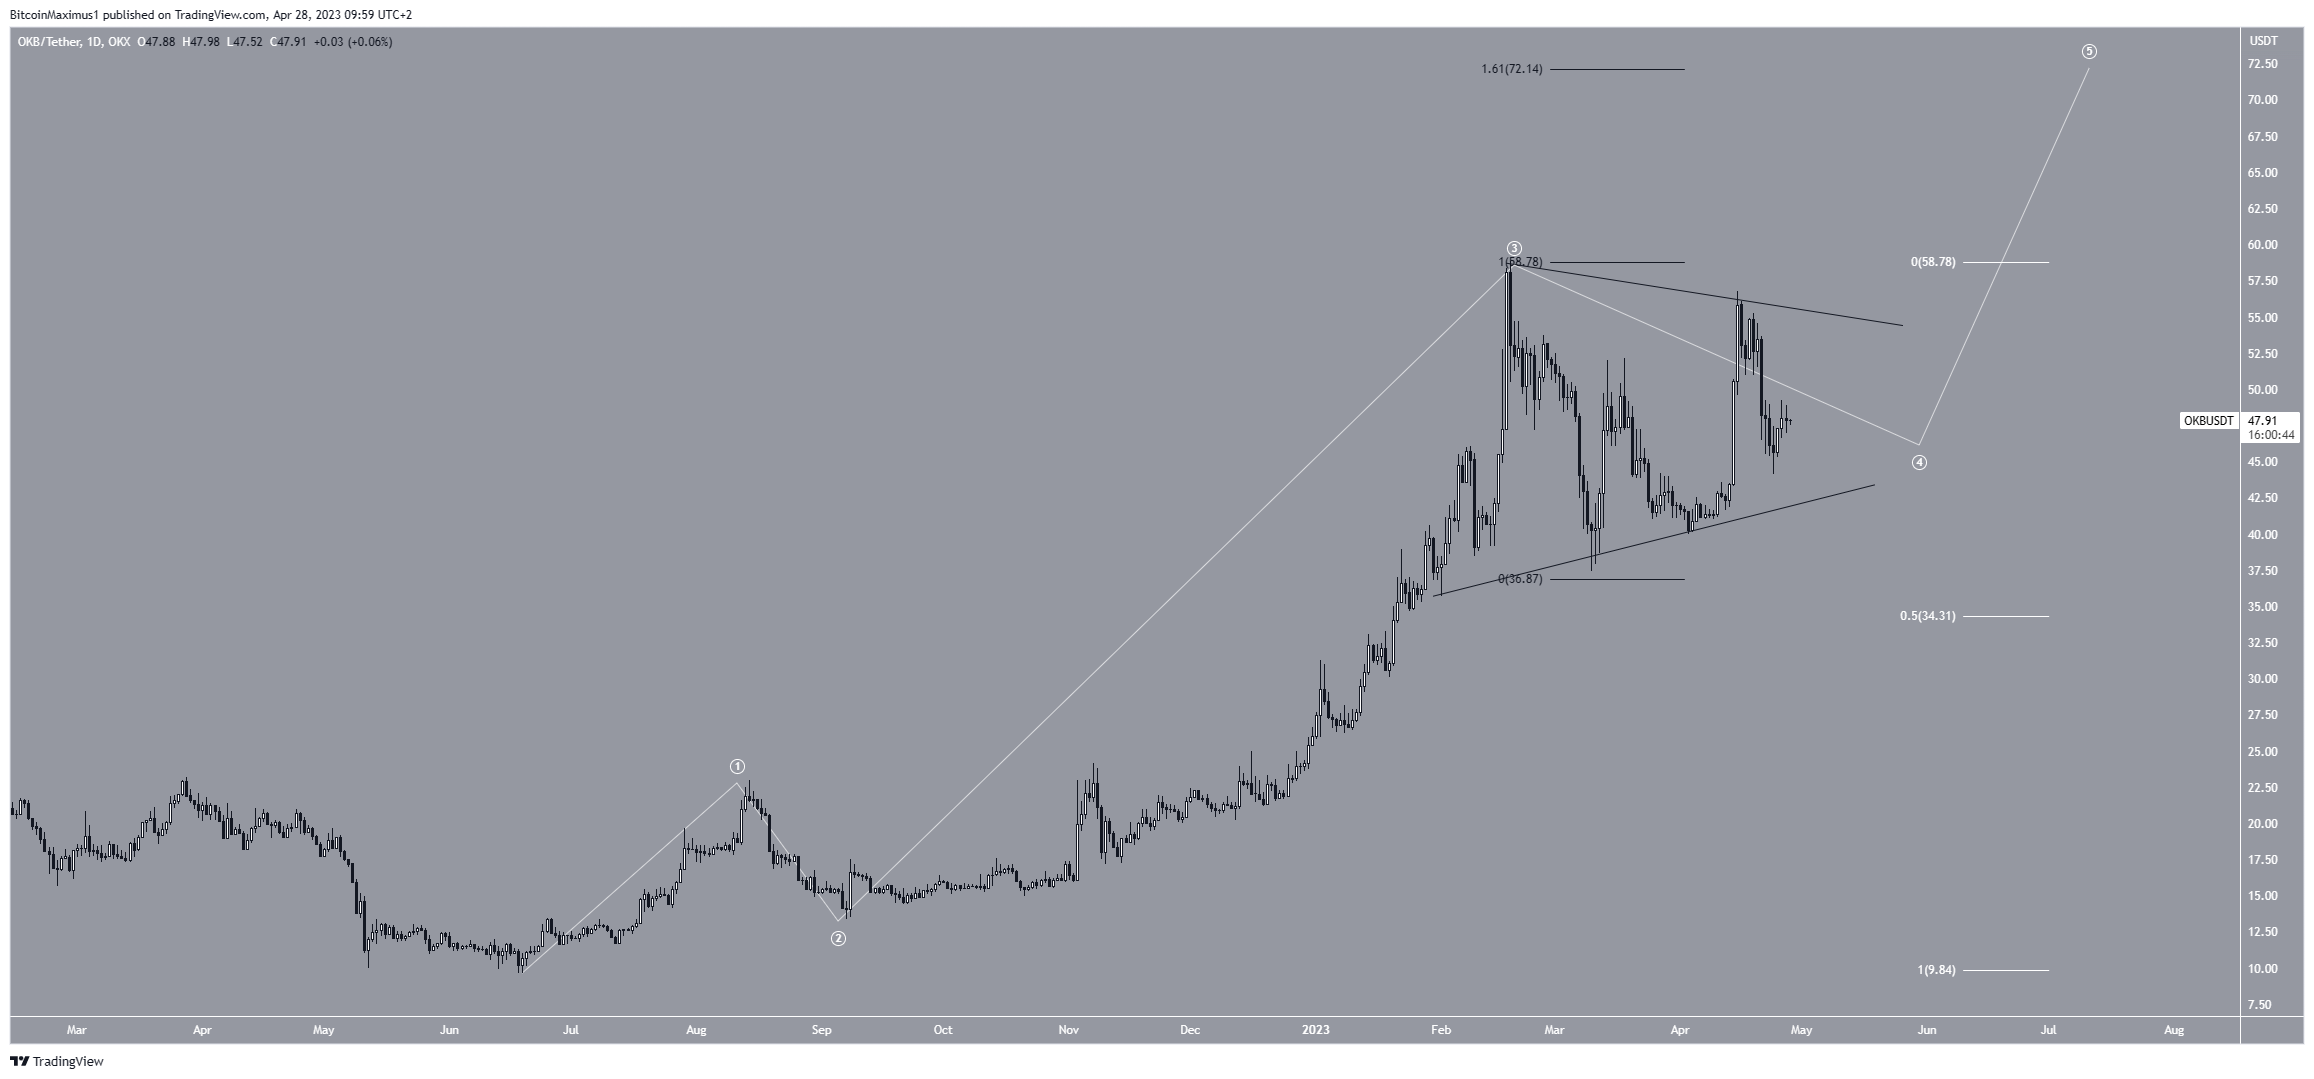
However, a breakdown from the triangle will invalidate this bullish OKB price prediction and can lead to a drop toward $34.30.
RocketPool (RPL) Cryptocurrency Price Attempts to Begin Upward Movement
The RPL price has increased inside an ascending parallel channel since January 18. While doing so, it reached a new all-time high of $65.30 on April 16.
However, it was rejected by the channel’s resistance line (red icon) and has fallen since. The long upper wick created at the channel’s resistance line is considered a bearish sign since it means that buyers were not able to sustain the price. Rather, sellers took over and pushed it down.
Currently, the RPL price trades in the lower portion of the channel. While this is considered a bearish sign, the price is very close to a confluence of support levels at $43, which could initiate a bounce.
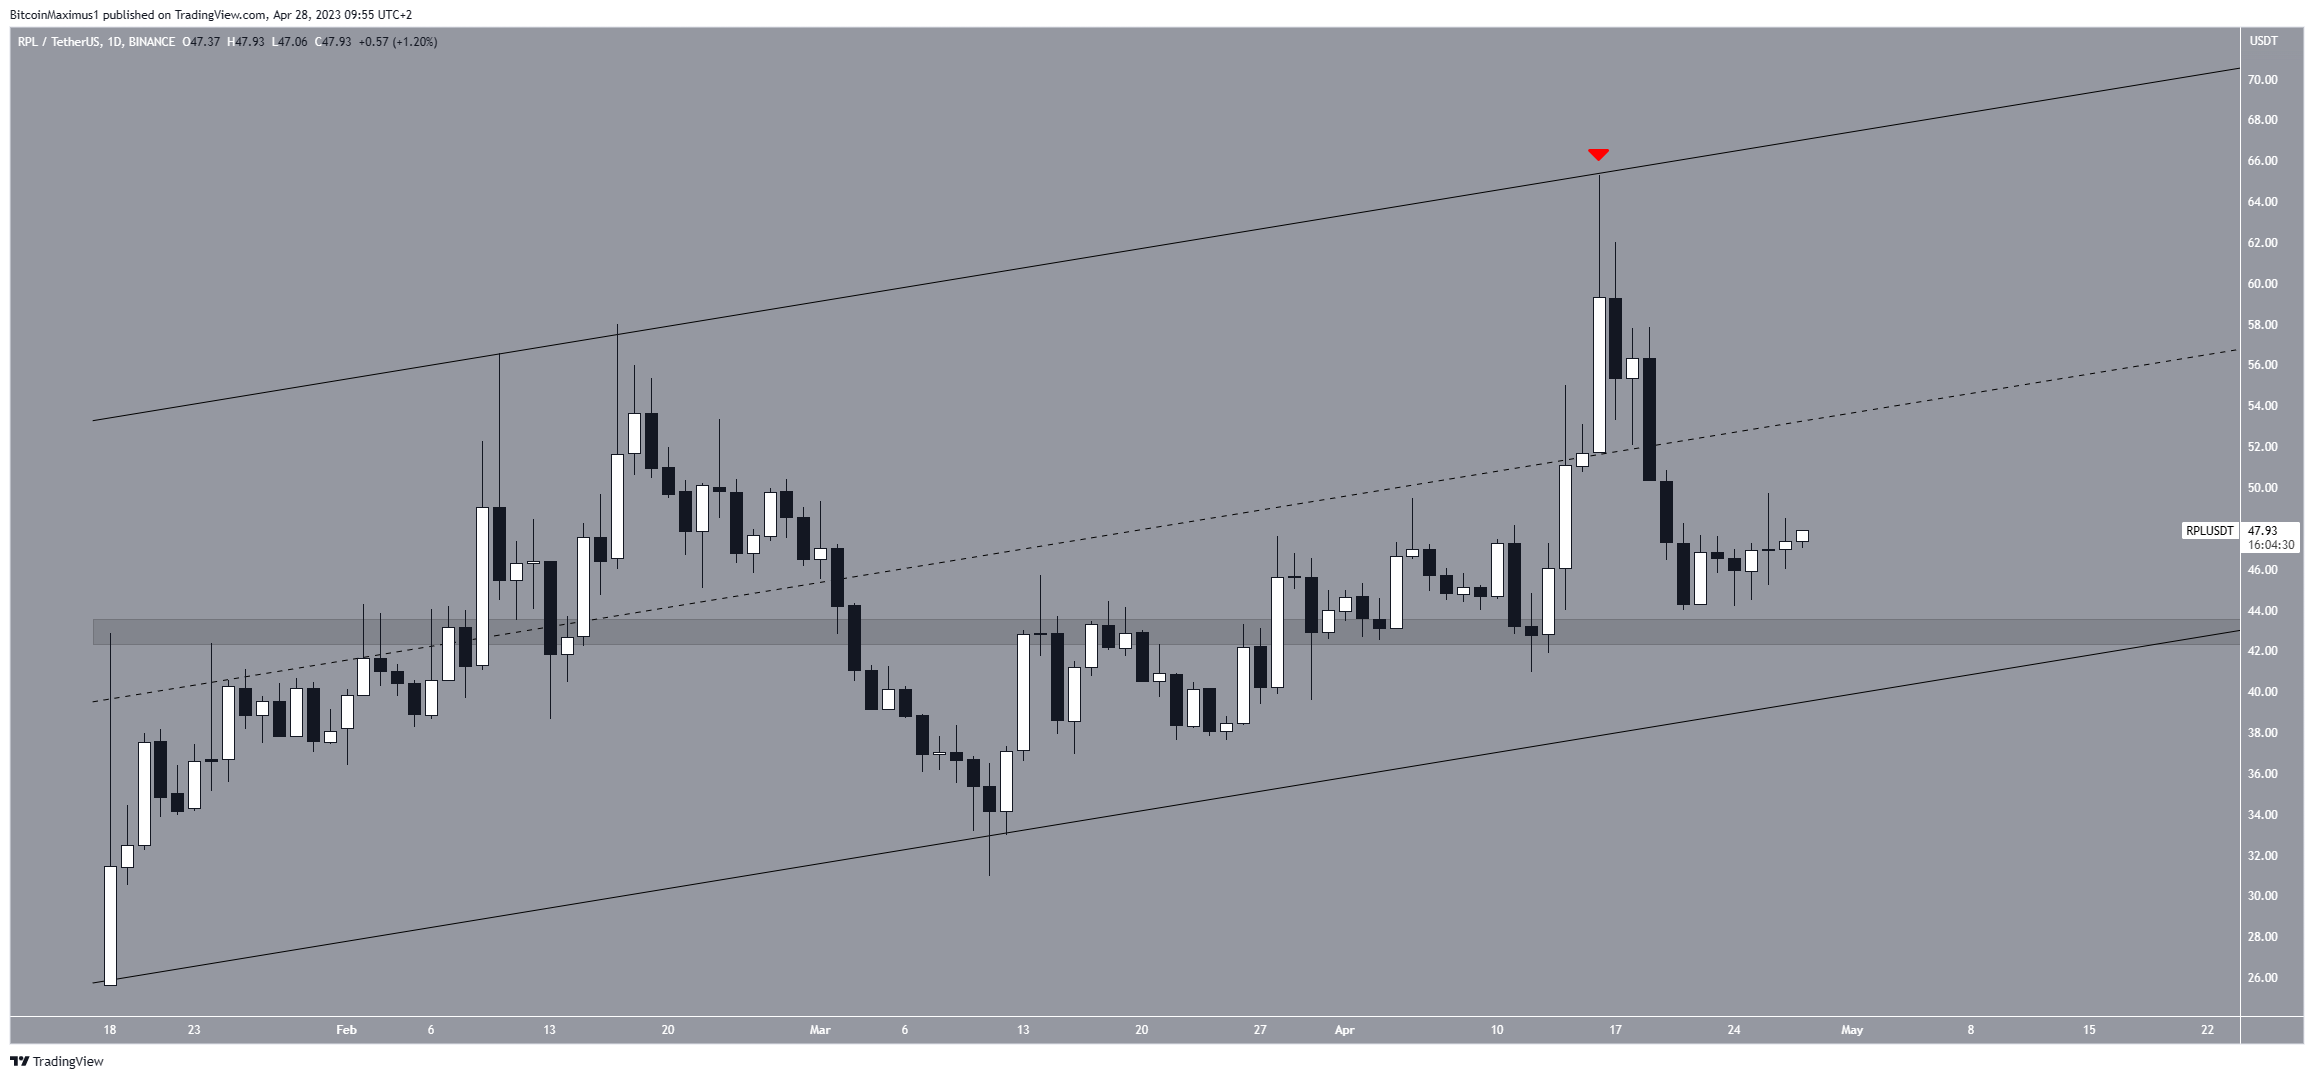
If the cryptocurrency manages to move above the channel’s midline, it could increase toward its resistance line.
Since a breakout from the channel is not needed for a new all-time high, RPL may reach the resistance line once more and create a new all-time high in the process.
Can BNB Price Clear Major Resistance?
The BNB price has increased considerably since its June 2022 low of $183. During this period, it followed an ascending support line, which measured the slope of the increase. Besides the line, the BNB price also faces resistance from the $345 horizontal resistance area.
Combined, they create an ascending triangle, which is considered a bullish pattern.
If the BNB token price breaks out from it, the price could reach a high of $510, slightly below the all-time high and at a long-term descending resistance line.
The weekly Relative Strength Index (RSI) supports the possibility of a breakout. By using the RSI as a momentum indicator, traders can determine whether a market is overbought or oversold and decide whether to accumulate or sell an asset. If the RSI reading is above 50 and the trend is upward, bulls have an advantage, but if the reading is below 50, the opposite is true.
Since the RSI is above 50 and increasing, it means that the trend is bullish.
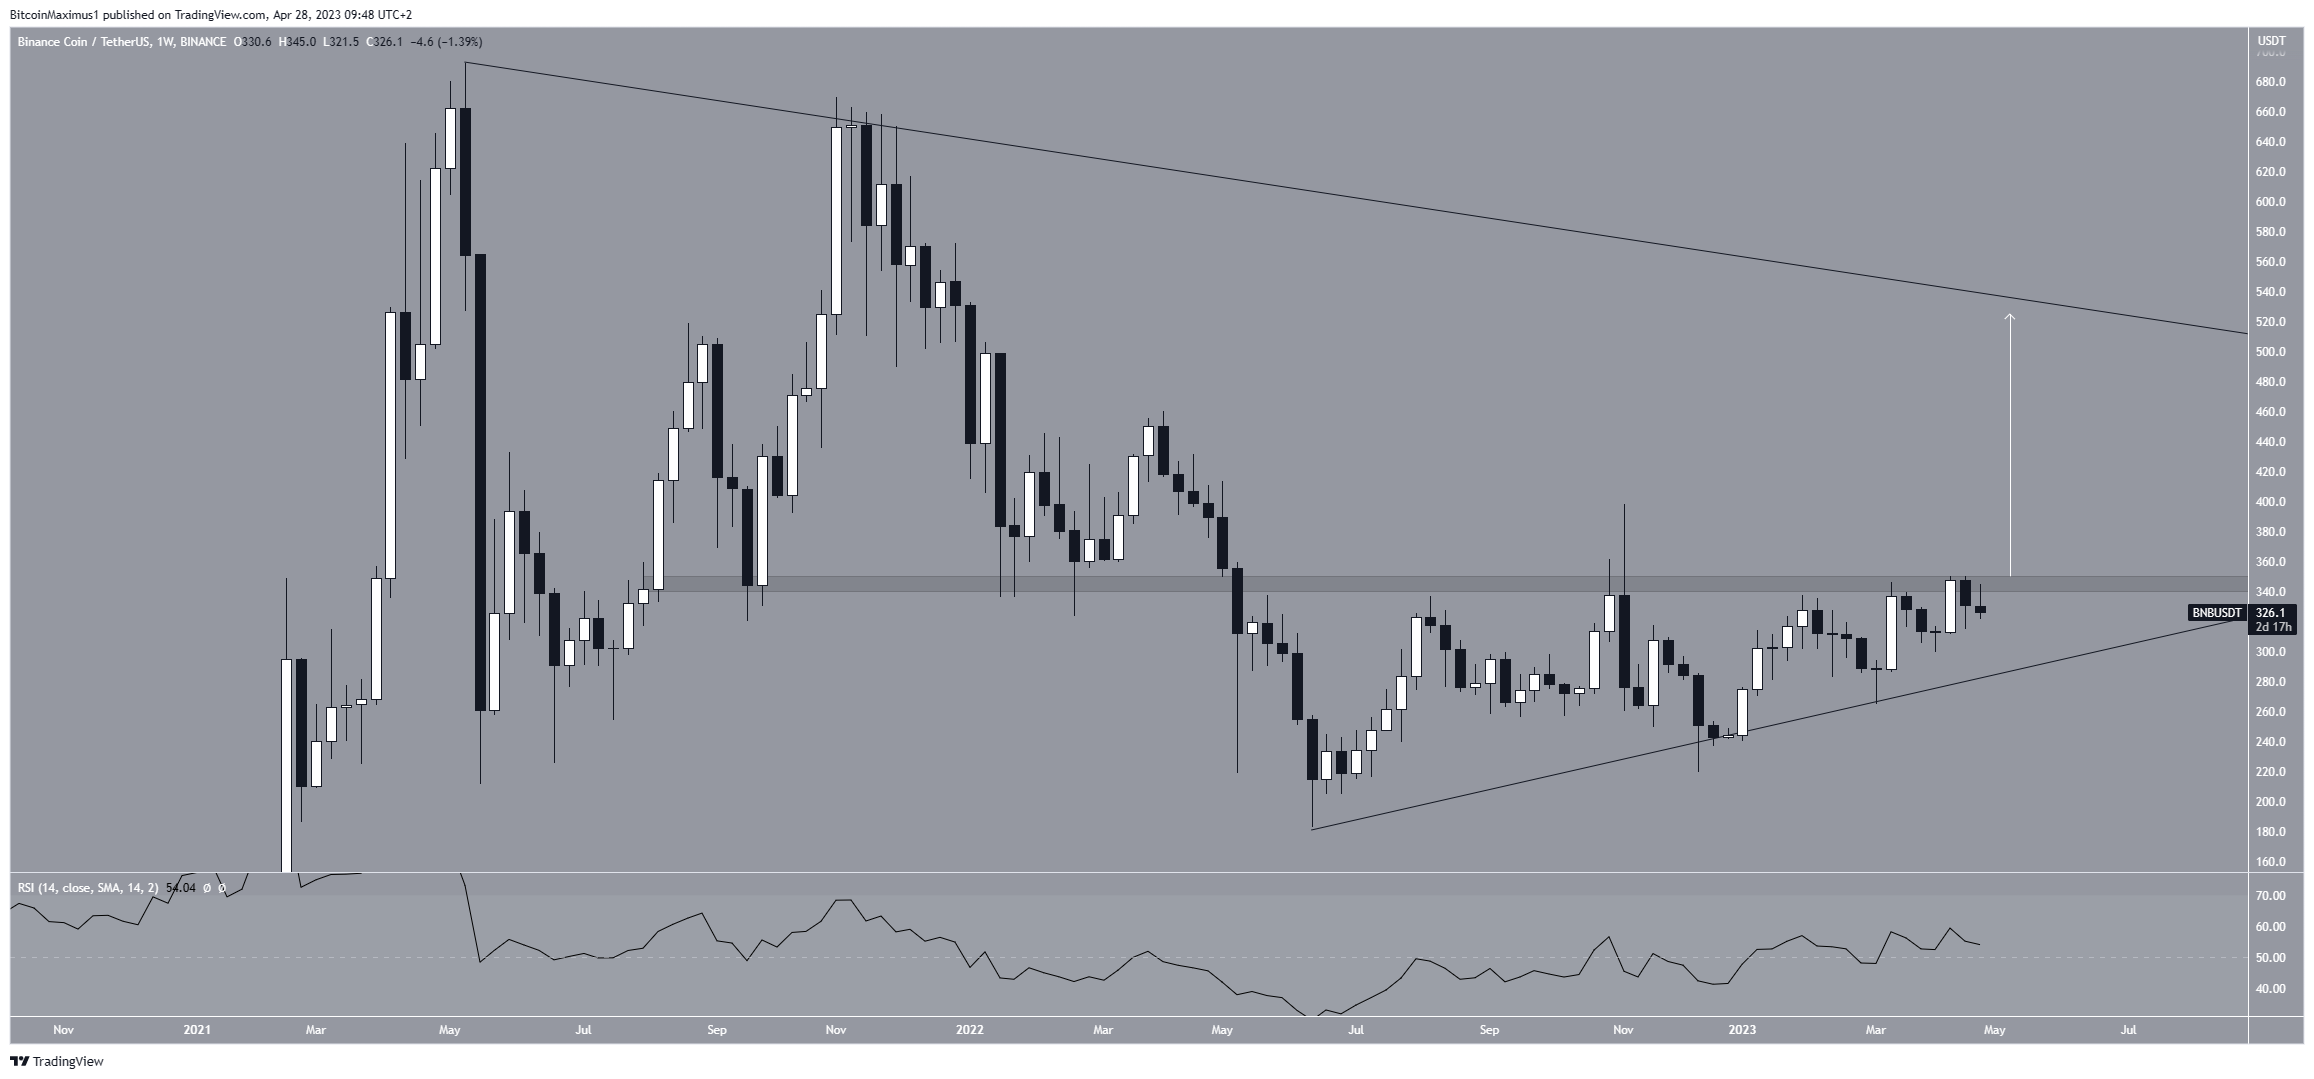
However, if the cryptocurrency closes below the ascending support line, it will invalidate the bullish hypothesis and could cause a drop to $200.
For BeInCrypto’s latest crypto market analysis, click here
