


June was a positive month for the cryptocurrency market. This was especially prevalent in the case of Bitcoin (BTC), which reached a new yearly high on June 23.
July has the potential to be a very important month for the altcoin market. While the Bitcoin dominance rate (BTCD) is currently increasing, there is potential for altcoins to flourish if the BTC price consolidates.
This makes it an exciting time for traders and investors to closely monitor the market movements and take advantage of potential opportunities. BeinCrypto looks at three cryptos that could hit new all-time highs in July:
Can Stacks (STX) Resume Its Upward Movement?
The STX price has increased sharply since the beginning of the year. The upward movement looks like a completed five-wave increase (black). If so, it would mean that the STX price has begun a new bullish trend reversal.
After reaching a new yearly high of $1.31 on March 20, the STX price corrected for 82 days, leading to a low of $0.44 on June 10. The price bounced immediately afterward, reclaiming the $0.55 area in the process.
As a result, the previous breakdown is considered invalid. Such deviations and reclaims often lead to pronounced upward movements.
Therefore, the STX price may have begun a new five-wave increase that could take it to its all-time high of $3.
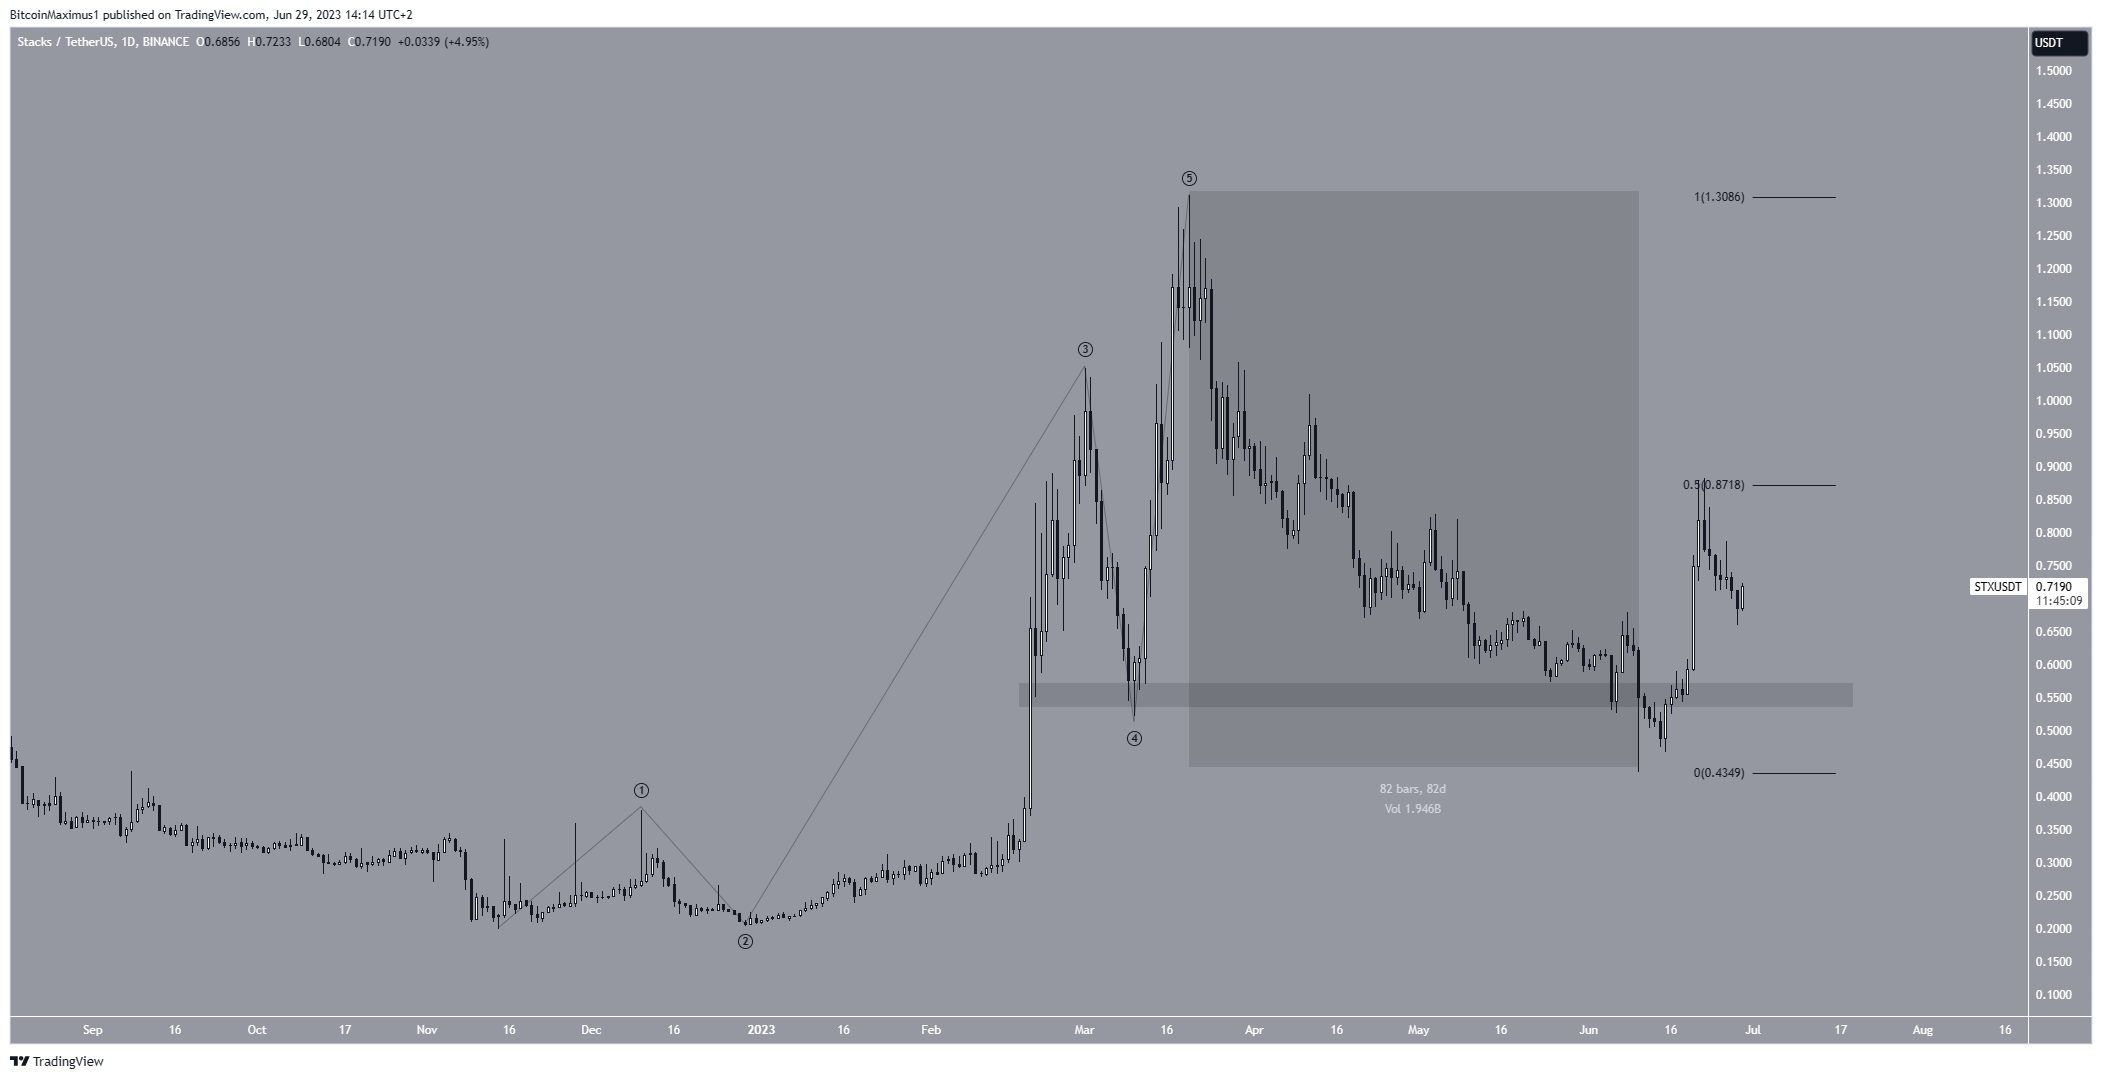
Despite the bullish outlook, if the STX price fails to move above the 0.5 Fib retracement resistance at $0.87, it could drop to the $0.55 area again.
Bullish Injective (INJ) Count Can Lead to New Highs
The price of INJ has experienced a significant increase since the start of the year. This upward movement can be compared to a five-wave pattern (black).
Technical analysts utilize the Elliott Wave theory to identify recurring long-term price patterns and investor psychology, aiding them in determining the trend’s direction. If so, the INJ price is currently in wave three of this increase.
The sub-wave count is given in white, suggesting that the INJ price has just begun the fifth and final sub-wave.
If the count is accurate, INJ’s price is expected to complete its third wave close to the $14 level, which acts as a horizontal resistance. Although this is below its previous record high, it represents the final obstacle before reaching a new all-time high.
Hence, if the price surpasses the $14 resistance, it could reach a new peak. This would align with wave five’s completion at a new all-time high.
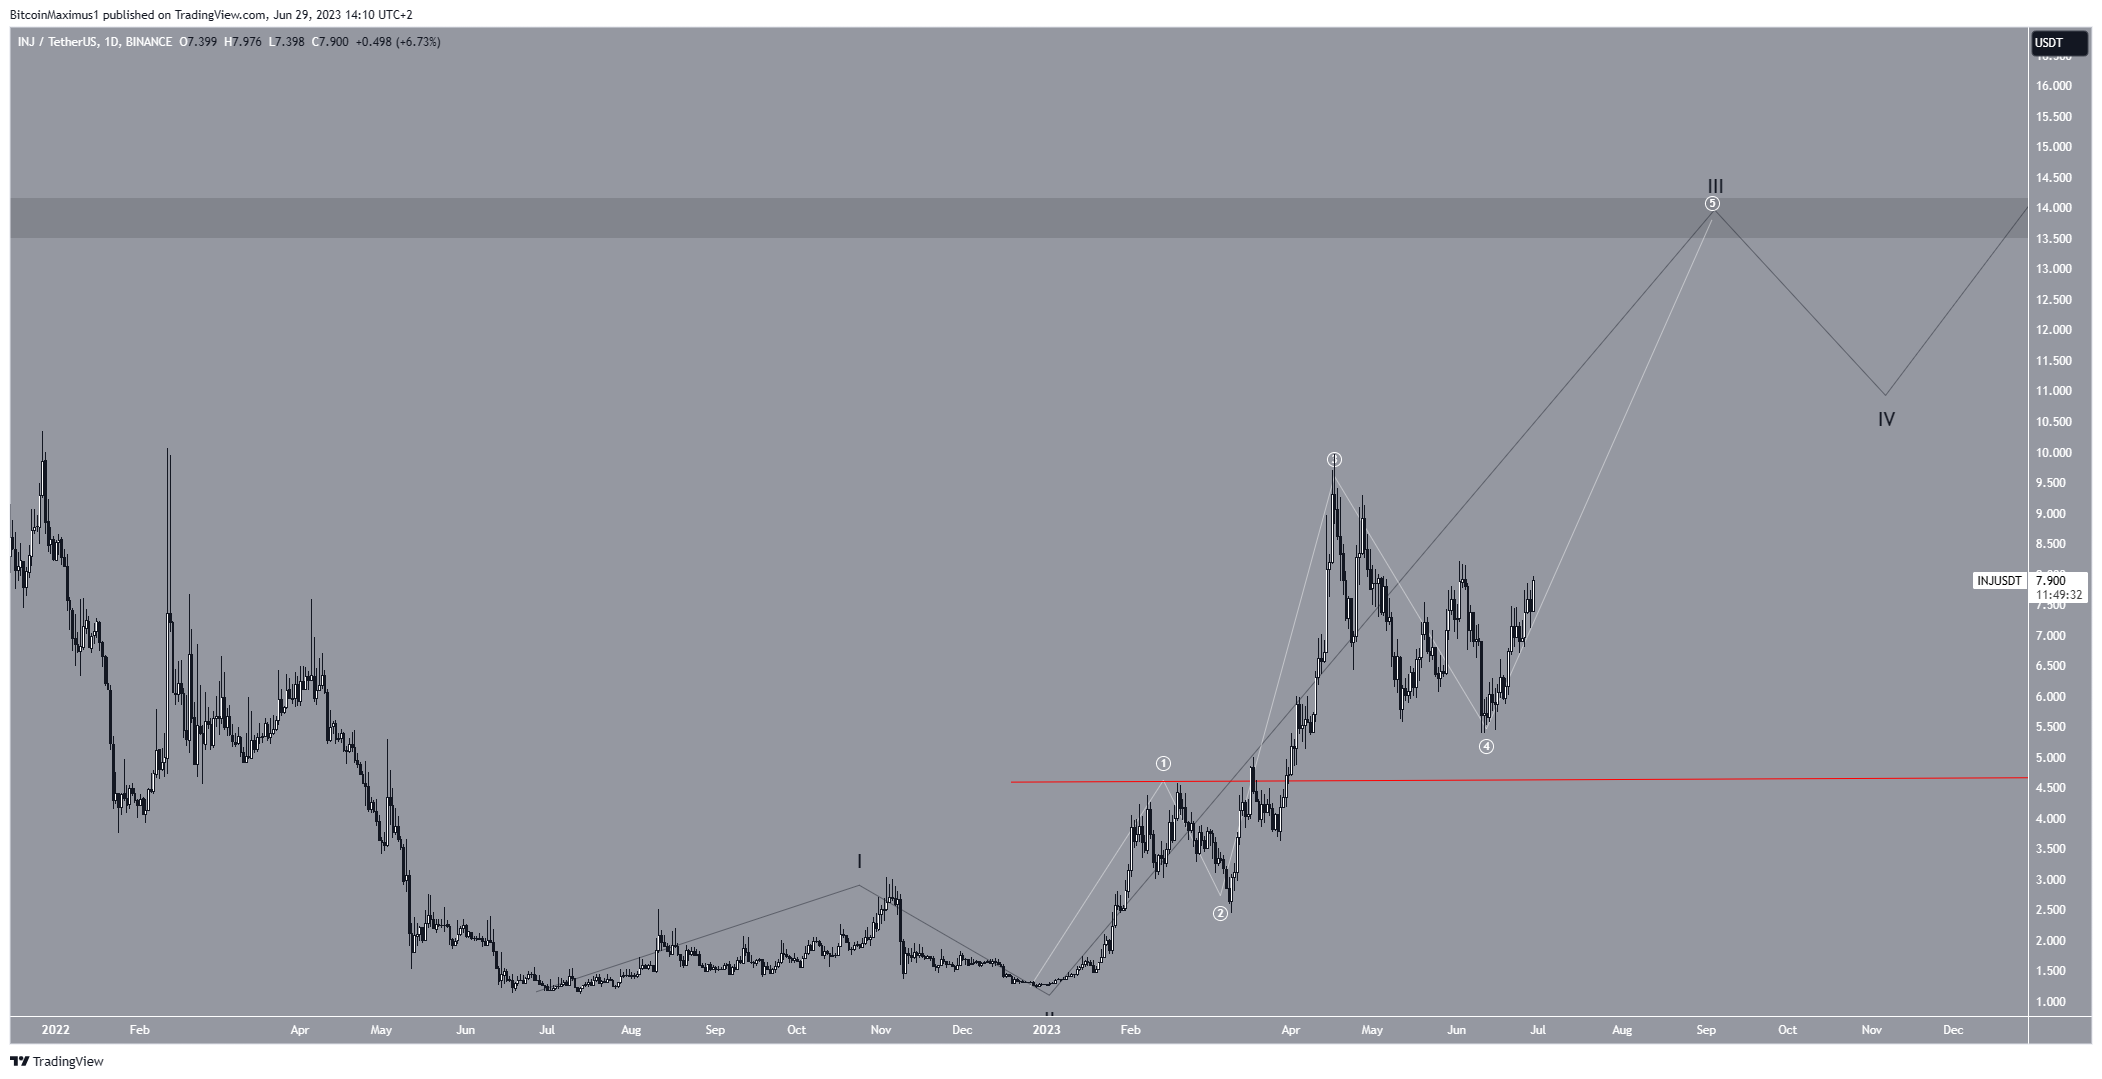
However, if the price falls below the high point of the first sub-wave (indicated by the red line) at $4.58, it would invalidate the optimistic prediction for INJ.
The count would suggest a bearish outlook in such a scenario, and the price might decline toward $3.0.
Read More: Best Crypto Sign-Up Bonuses in 2023
Will Aptos (APT) Price Begin Road to Recovery?
The APT price has fallen under a descending resistance line for the past 154 days. So, the trend is considered bearish until the price breaks out. Moreover, the decrease took the APT price below the $8 horizontal area, which had previously provided support.
While the price action so far is bearish, the APT price is in the process of breaking out from the line. Since the $8 area is in close proximity to the line, a breakout from the former would also likely cause a reclaim of the latter.
If the APT price does break out, the only resistance before the all-time high would be $13.50. The lack of overhead resistance will allow for a quick rally if the price breaks out.
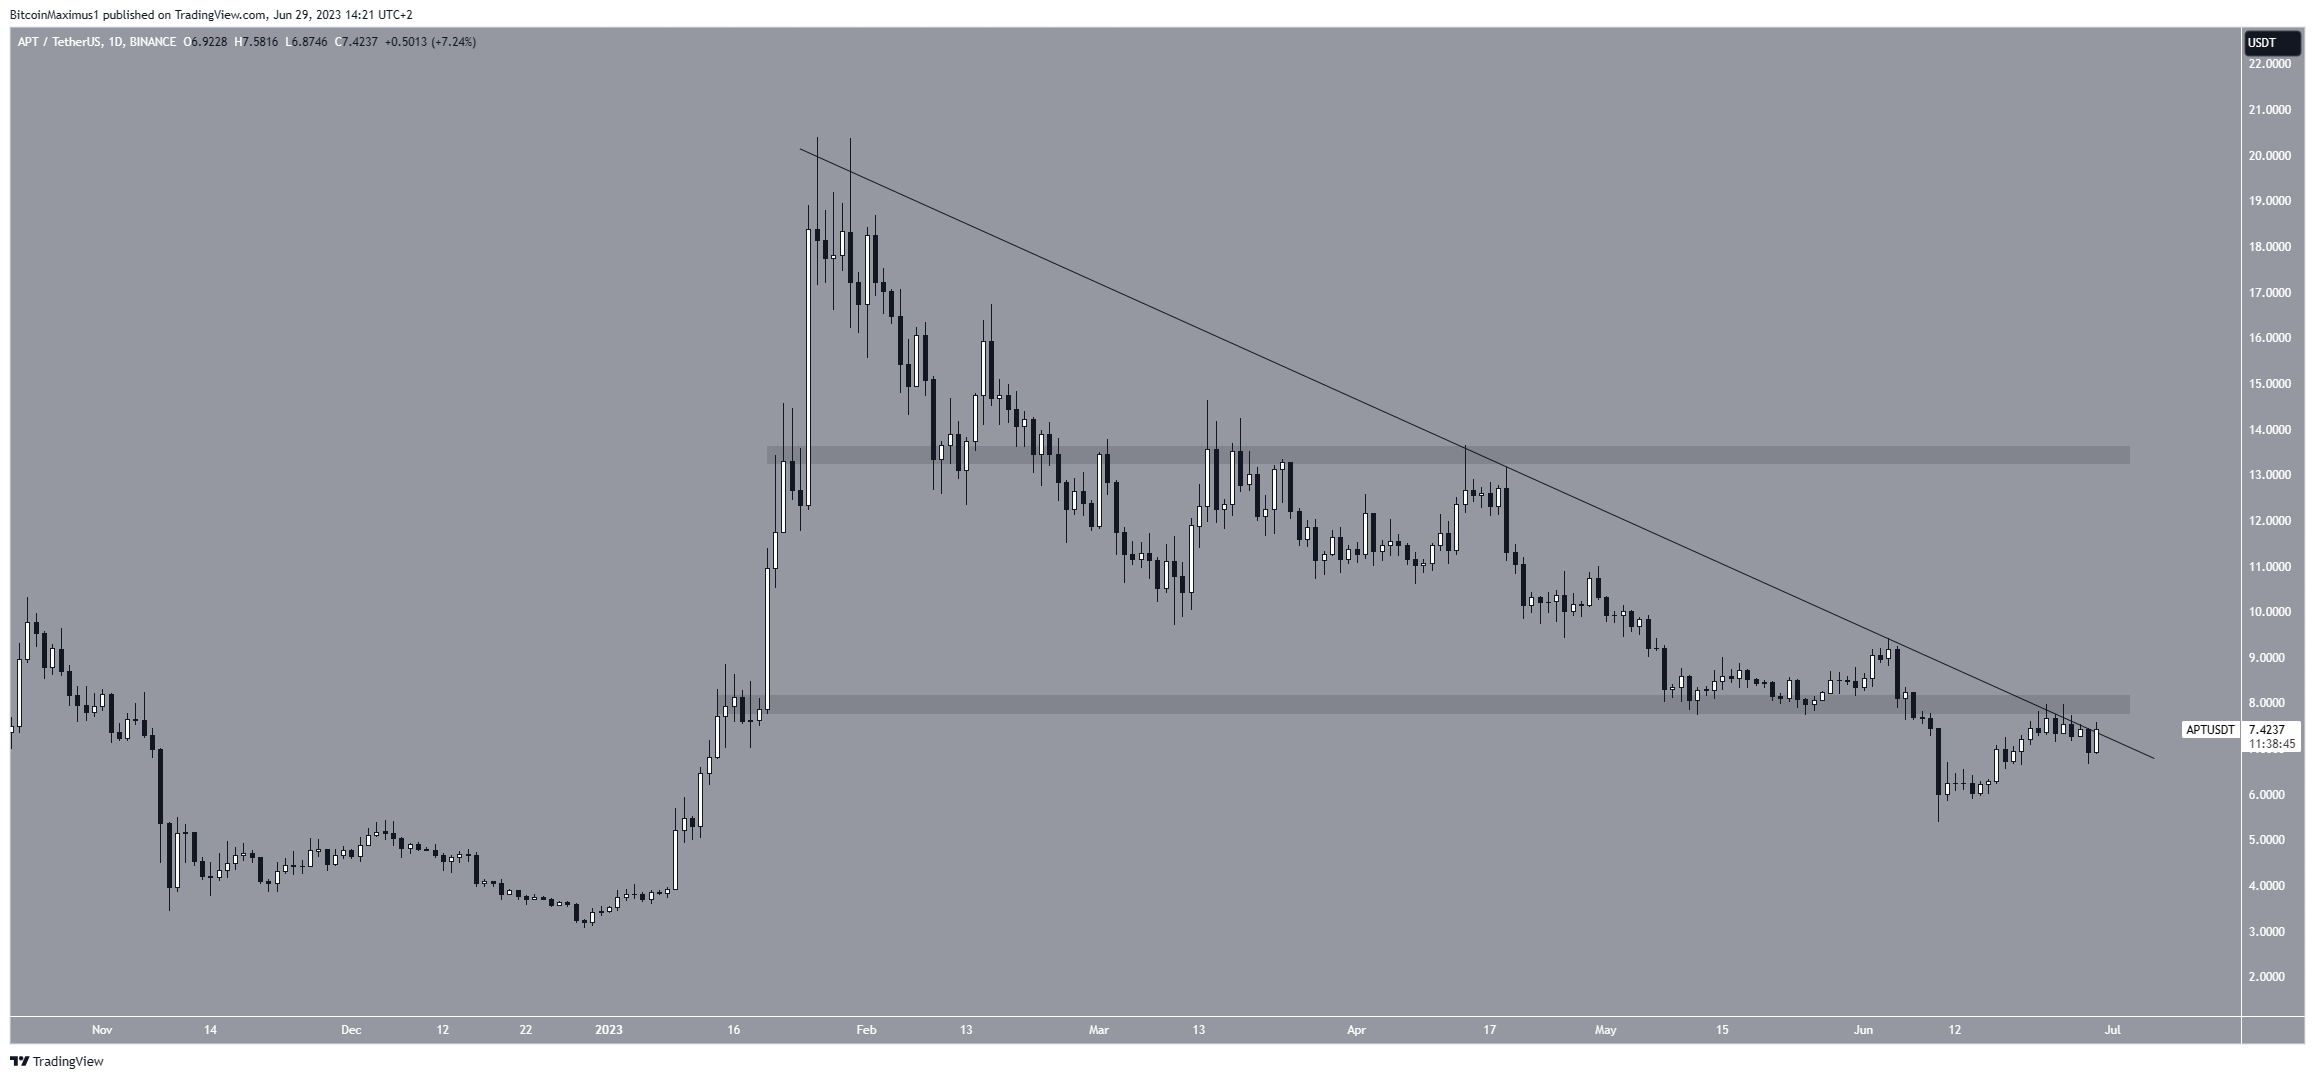
However, if APT gets rejected, it could fall to the next closest support at $4.0.
More From BeInCrypto: 9 Best AI Crypto Trading Bots to Maximize Your Profits
For BeInCrypto’s latest crypto market analysis, click here


