


The Ripple XRP price has increased significantly before the Ripple Swell conference, reaching a high above $0.70.
XRP broke out from a descending resistance trend line during the increase and reclaimed a long-term horizontal resistance area.
XRP Increases After Close Above Resistance
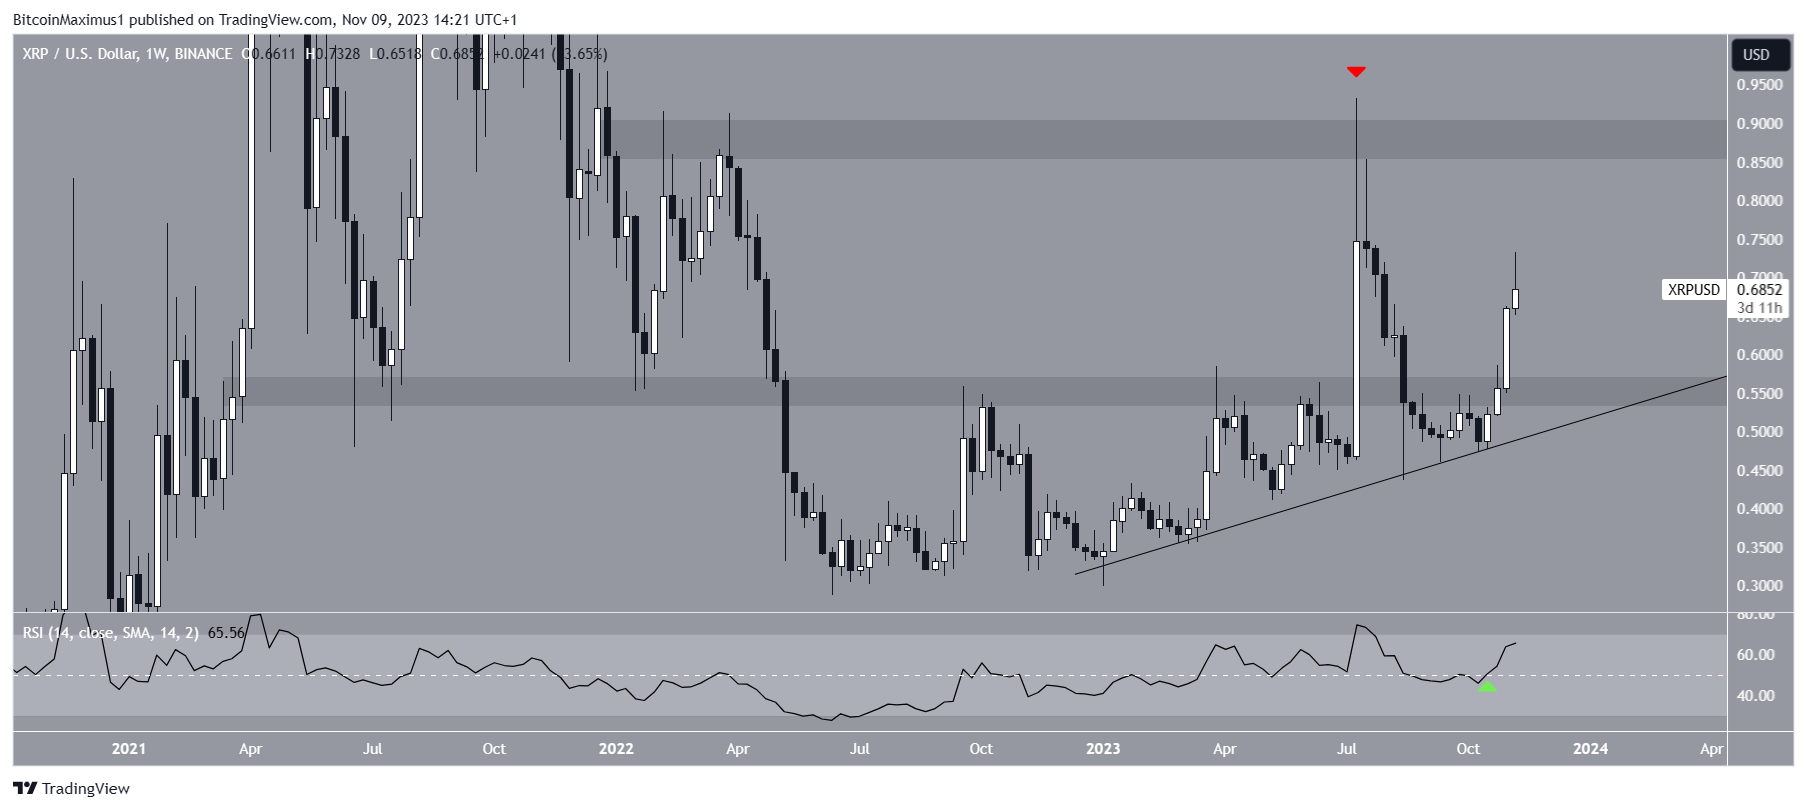
XRP’s weekly technical analysis indicates a consistent price increase since June, aligning with an ascending support trend line. The price bounced off the trend line in March and peaked at $0.94 in July (red icon). The value still stands as a yearly high.
XRP broke through the $0.55 horizontal resistance area during this ascent. Despite a dip below in August, the recent upward movement successfully reclaimed this zone last week, the first close above this level since August. XRP reached a high of $0.73 this week.
Read more: Best Crypto Sign-Up Bonuses in 2023
The weekly Relative Strength Index (RSI), a momentum indicator, gives a positive reading. Traders often use RSI to assess whether a market is overbought or oversold, influencing their decisions to buy or sell an asset.
A reading above 50 in an upward-trending market favors the bulls, and last week’s RSI crossing above 50 is a positive sign.
The two-day Ripple Swell conference began yesterday. The Ripple team announced on X (formerly Twitter) that:
“Leaders from Circle, Dubai Blockchain Center, Fuze, and Crypto Oasis took the stage to discuss real-world utility and building in the Dubai crypto ecosystem, and what’s bringing entrepreneurs to the region.”
Read more: (XRP) Ripple Price Predictions
What Do Analysts Say About the Increase?
Cryptocurrency analysts on X have a mostly bullish outlook on the future XRP movement. DefendDark uses Elliott Wave Theory to suggest that XRP will reach a new all-time high.
Technical analysts employ the Elliott Wave Theory as a means to identify recurring long-term price patterns and investor psychology, which helps them determine the direction of a trend.
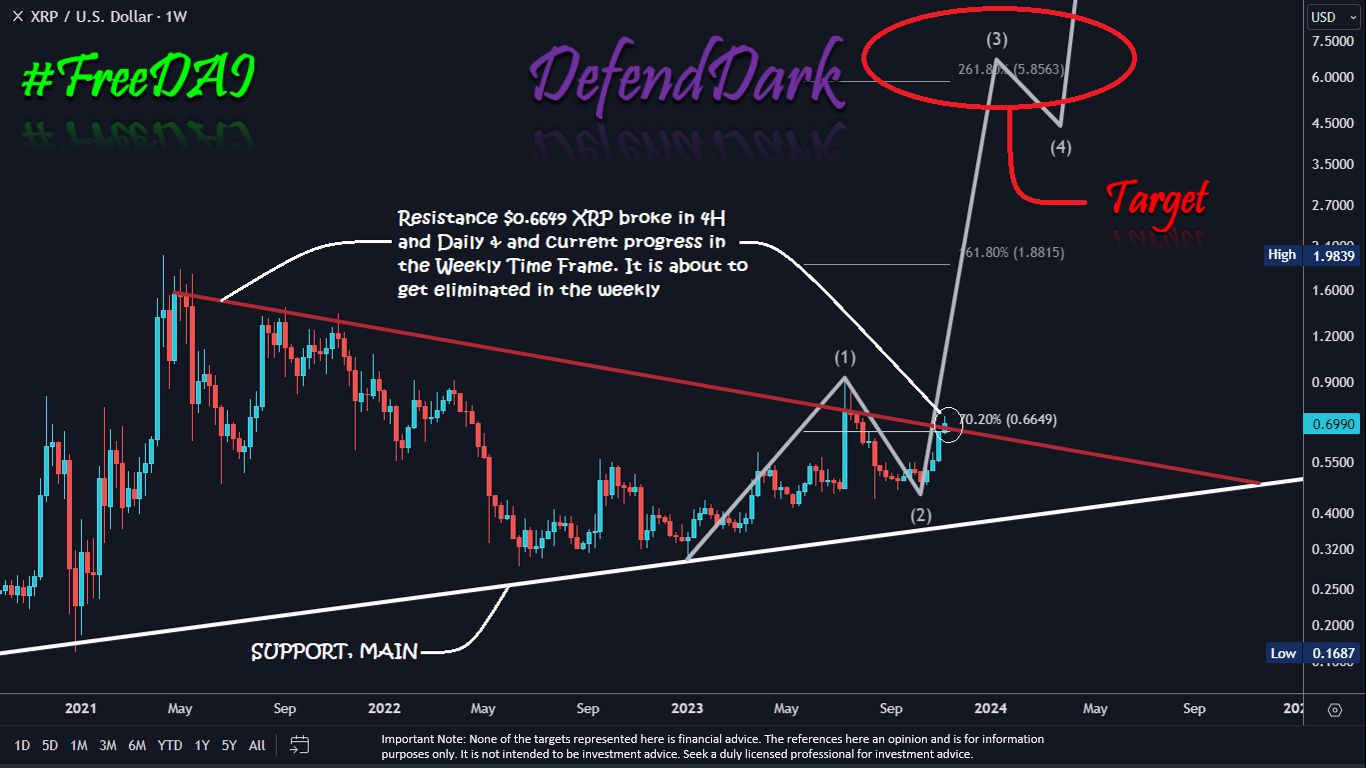
According to the chart, the price is in wave three of a five-wave increase that will conclude well above the all-time high.
Cryptotoes_ta also believes that the trend is bullish. He stated that:
“XRP closed another day above the 0.382 fib level
“This needs to start moving today, or it could be a sign that we are losing momentum Stay tuned for updates on XRP.”
Finally, RealXRPWhale believes that the back test of $0.70 is the sign that the XRP price will head higher.
Ripple XRP Price Prediction: Is $1 Attainable?
The technical analysis from daily time frame reinforces the bullish sentiment observed on the weekly one.
To begin with, the XRP price experienced a breakout from a descending resistance trend line on Oct. 19, a significant development considering the trend line’s 98-day existence before the breakout.
Furthermore, the daily RSI continues to support the bullish outlook, displaying an upward trend and maintaining its trend above 50. The bullish divergence trend line (green) that preceded the upward movement adds an extra layer of optimism.
The price currently trades inside the $0.68-$0.74 resistance zone. This area is defined by the 0.5-0.618 Fib retracement resistance levels.
Read more: How To Buy XRP and Everything You Need To Know
Following Fibonacci retracement principles, after a substantial price shift in one direction, there tends to be a partial retracement before resuming the original trajectory. The $0.68-$0.74 range represents the last hurdle before reaching $1.
A successful breakout beyond this level could trigger a nearly 40% price increase, taking XRP to its yearly high of $0.94.
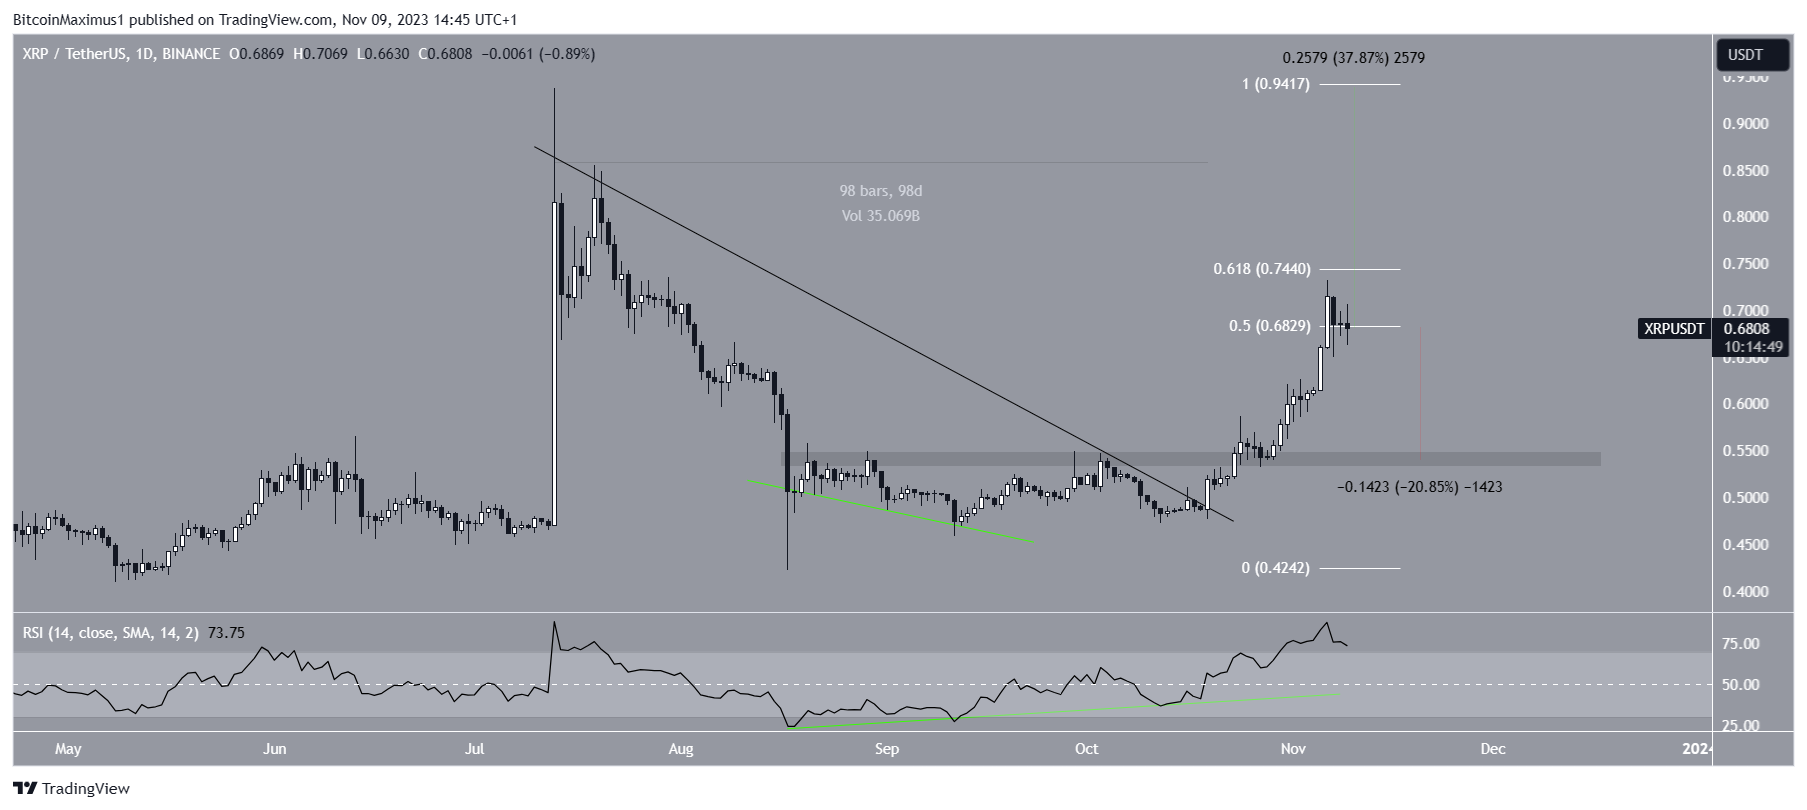
Despite this bullish XRP price prediction, a daily close below the 0.5 Fib retracement support level at $0.68 can cause a deeper retracement. XRP could fall by 20% to the $0.55 support area if that happens.
For BeInCrypto’s latest crypto market analysis, click here.


