


Be[in]Crypto takes a look at the price movement for seven different cryptocurrencies, including Zilliqa (ZIL), which increased considerably on May 4.
BTC
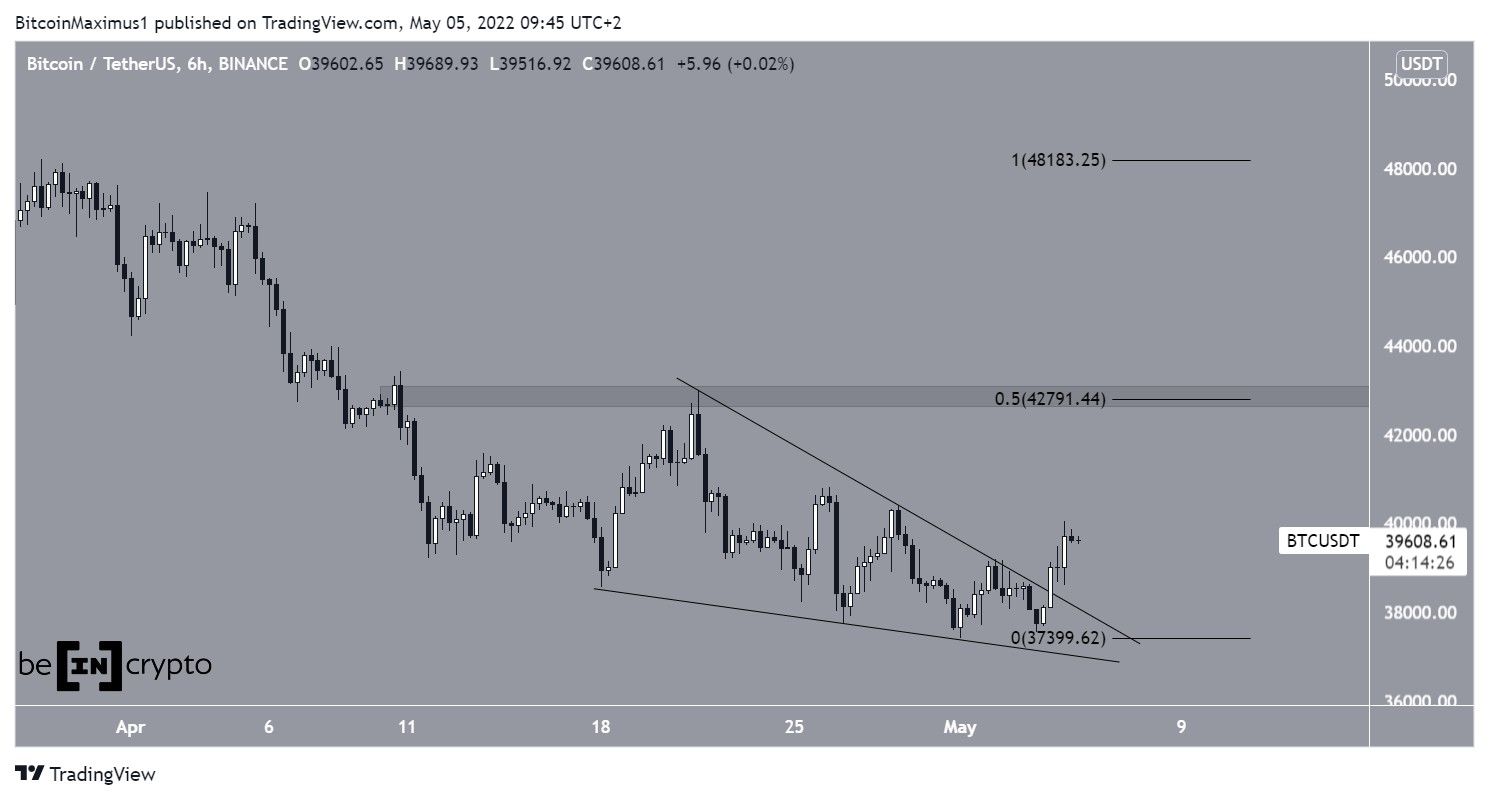
Bitcoin (BTC) had been decreasing inside a descending wedge since April 18. The wedge is considered a bullish pattern, meaning that a breakout from it would be likely.
On May 5, BTC managed to break out.
If the upward movement continues, the closest resistance area would be at $42,800. This is the 0.5 Fib retracement resistance level and a horizontal resistance area.
ETH
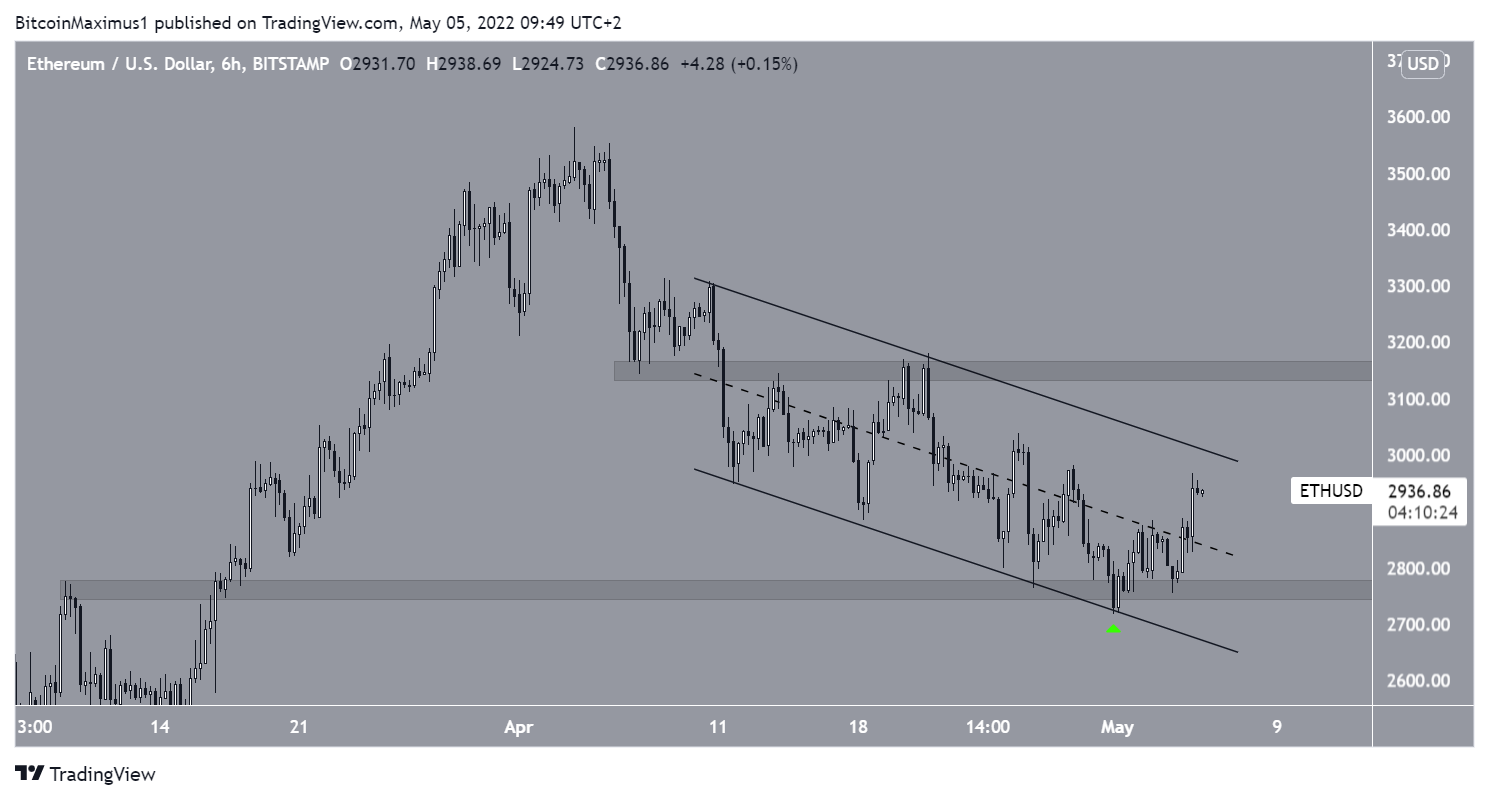
Ethereum (ETH) has been decreasing inside a descending parallel channel since April 10. The movement led to a low of $2,716 on April 30, before the price bounced (green icon). The bounce served to validate the $2,750 support area and the support line of the channel.
If ETH follows the lead set by BTC, it will break out from the channel in the near future. If so, the next closest resistance would be at $3,150.
XRP
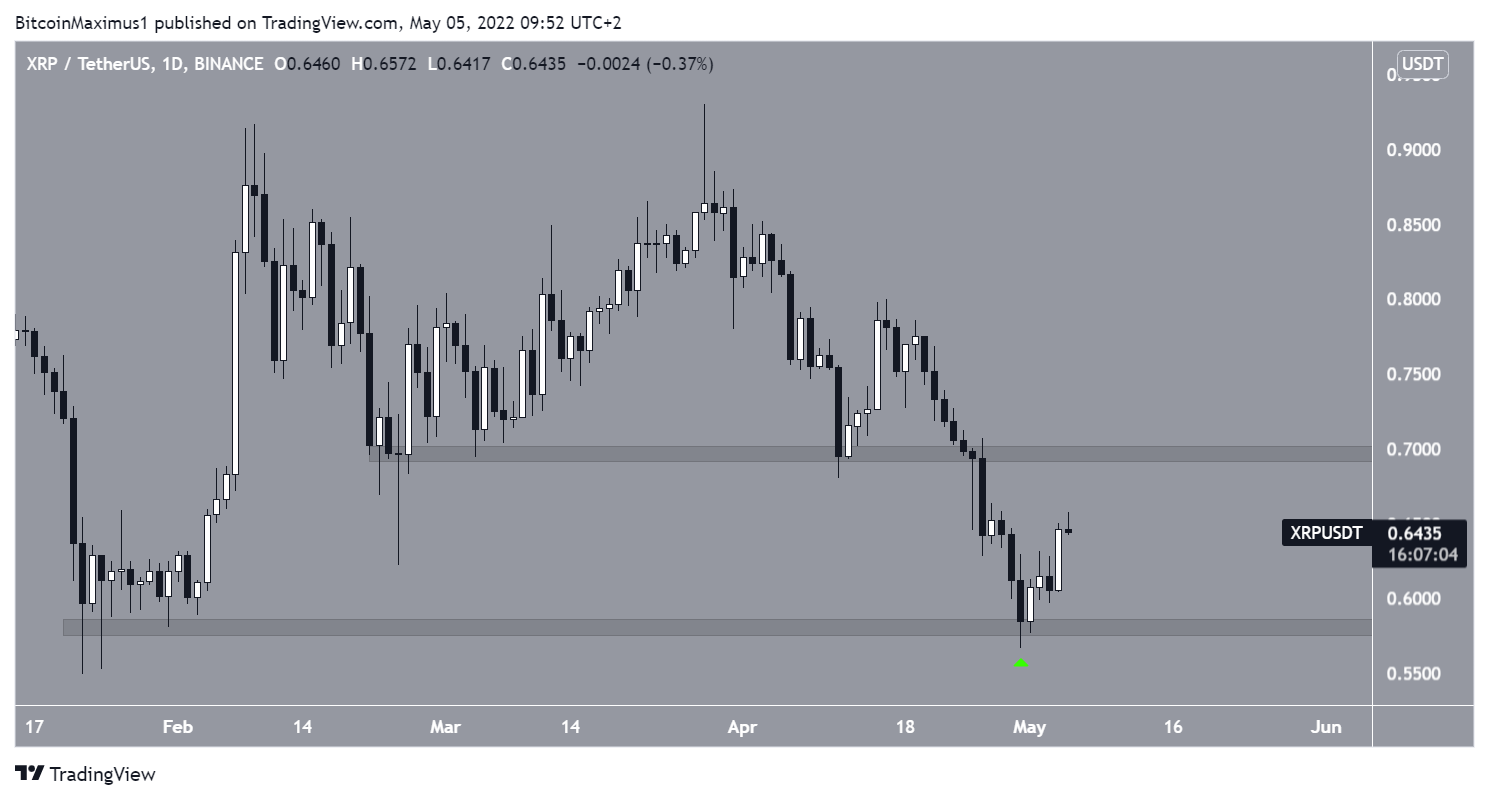
XRP has been falling since reaching a high of $0.93 on March 28. The downward movement led to a low of $0.56 on April 30.
Afterward, the price bounced, validating the $0.57 horizontal area as support (green icon).
If the upward movement continues, the next closest resistance area would be at $0.70.
SHIB
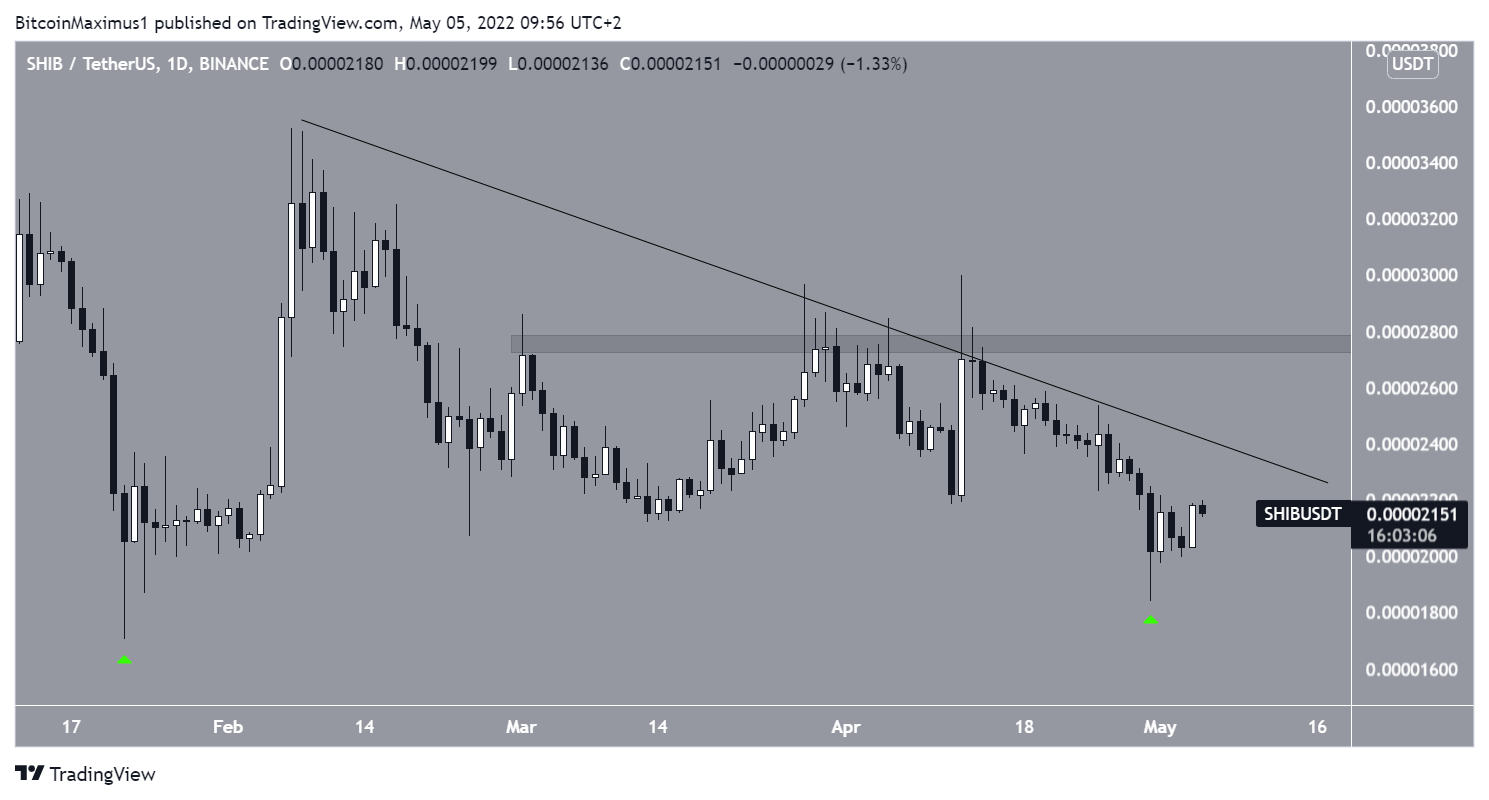
Shiba Inu (SHIB) has been decreasing underneath a descending resistance line since Feb 8. This led to a low of $0.000018 on April 30.
The ensuing bounce created a long lower wick and created a double bottom pattern relative to the price in Jan (green icons). The double bottom is considered a bullish pattern and often leads to trend reversals.
A breakout from the resistance line would confirm the validity of the pattern. If so, the next resistance would be at $0.0000275.
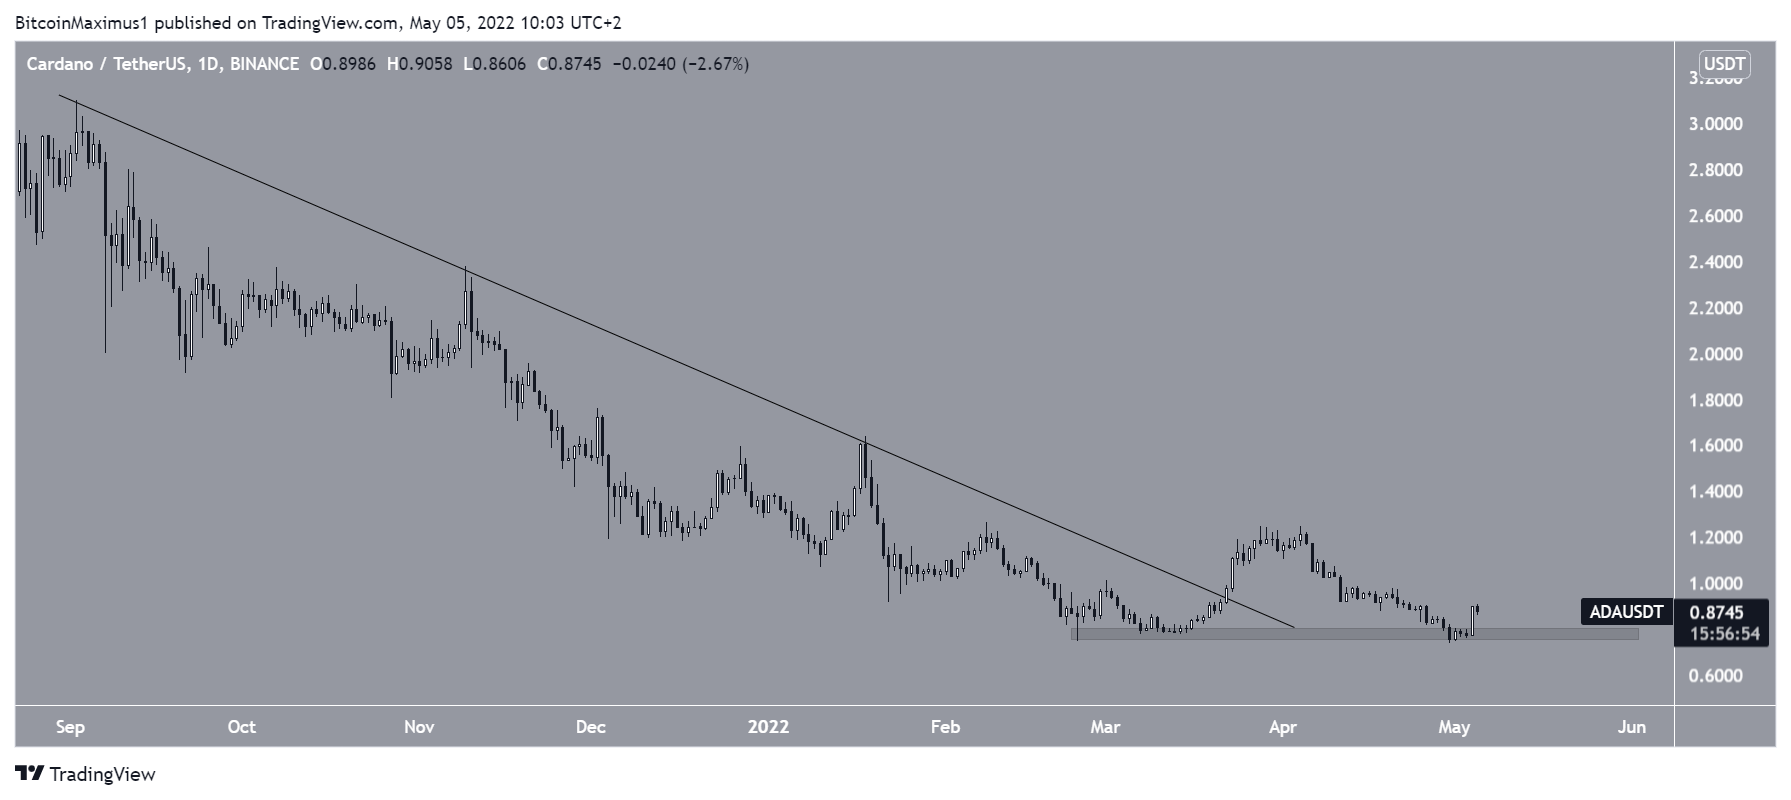
ADA
Cardano (ADA) had been decreasing alongside a descending resistance line since reaching an all-time high price of $3.02 on Sept. 2.
On March 22, the price broke out and proceeded to reach a high of $1.245 on April 4. However, the upward movement could not be sustained and the price decreased until it reached a low of $0.73 on April 30.
The downward movement caused a sweep of the Feb lows before the price bounced considerably.
Due to the bounce, the $0.78 area is now expected to provide support once more.
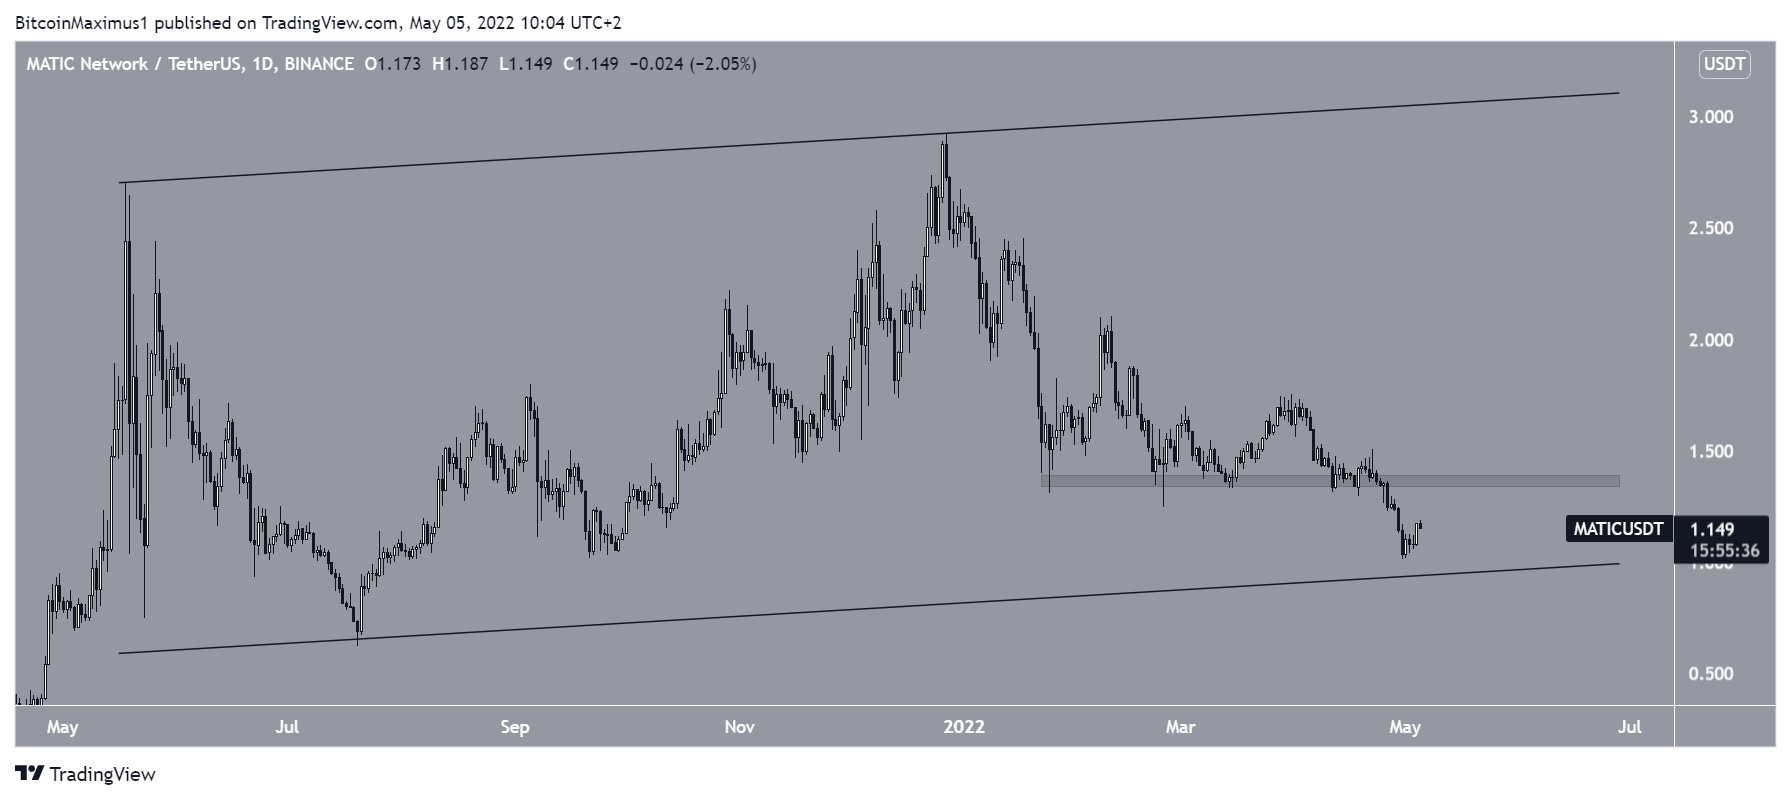
MATIC
Polygon (MATIC) has been trading inside a long-term ascending parallel channel since May 2021. It has been decreasing since reaching an all-time high price of $2.92 on Dec 27.
Initially, the price bounced at the $1.37 area, but failed to initiate any sort of upward movement, and broke down on April 24. This led to a low of $1.01 on April 30. The low was made very close to the support line of the long-term channel and led to a significant bounce.
If the upward movement continues, the previous support area at $1.37 would be expected to provide resistance.
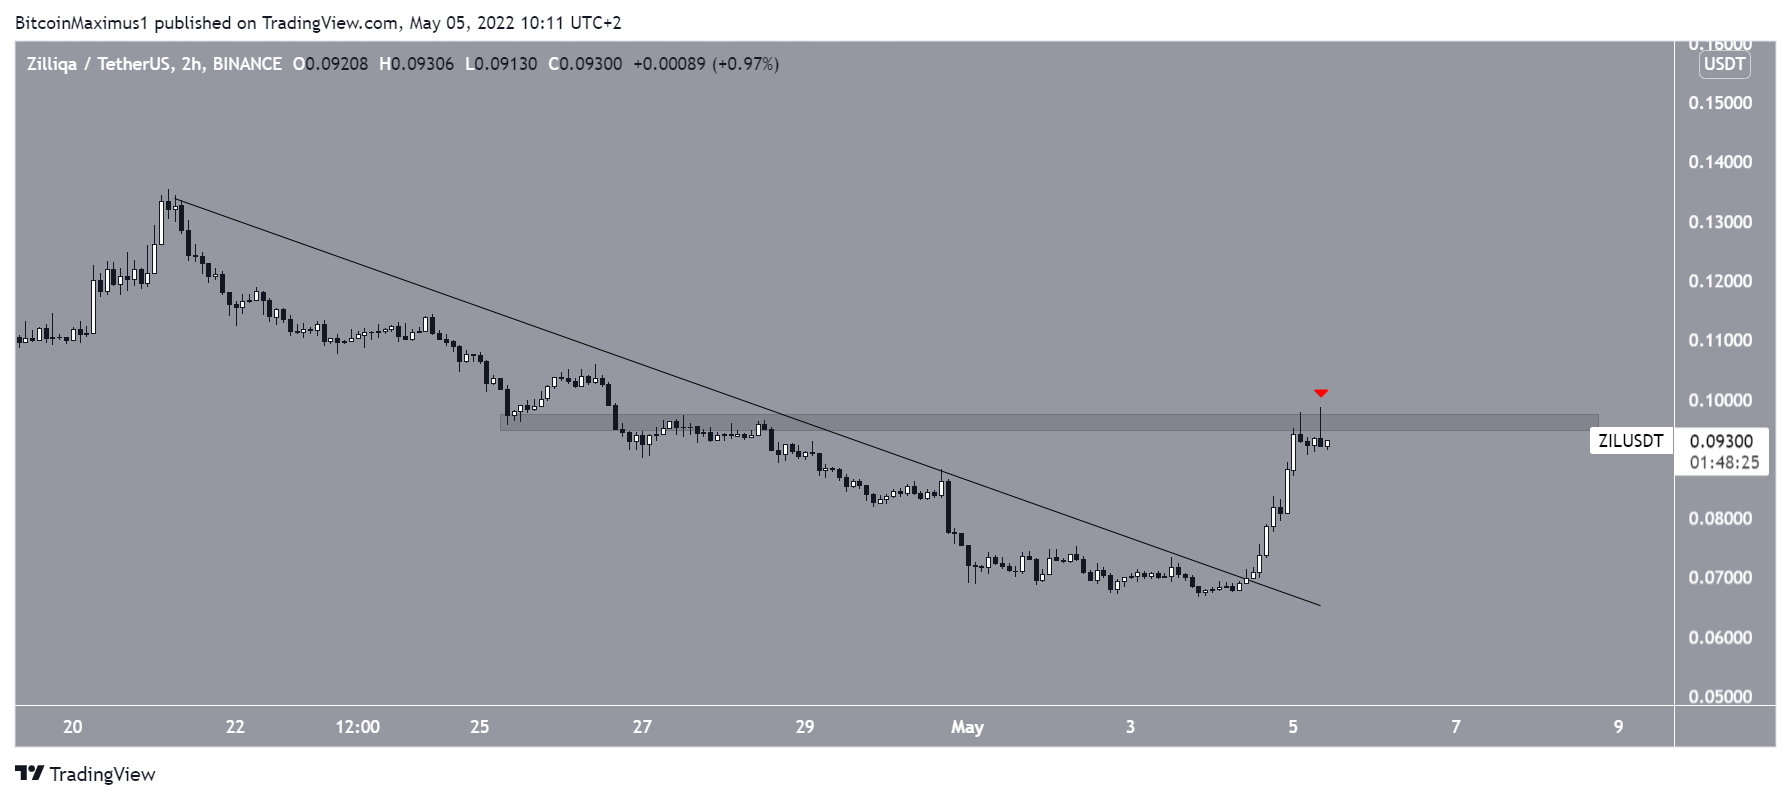
ZIL
Zilliqa (ZIL) had been decreasing underneath a descending resistance line since April 11. The downward movement led to a low of $0.066 on May 3.
However, the price initiated a significant upward movement the next day and managed to break out. So far, it has reached a high of $0.098.
The high was made inside the $0.096 resistance area and created a long upper wick (red icon). This is the final resistance area prior to the April highs.
For Be[in]Crypto’s latest Bitcoin (BTC) analysis, click here


