


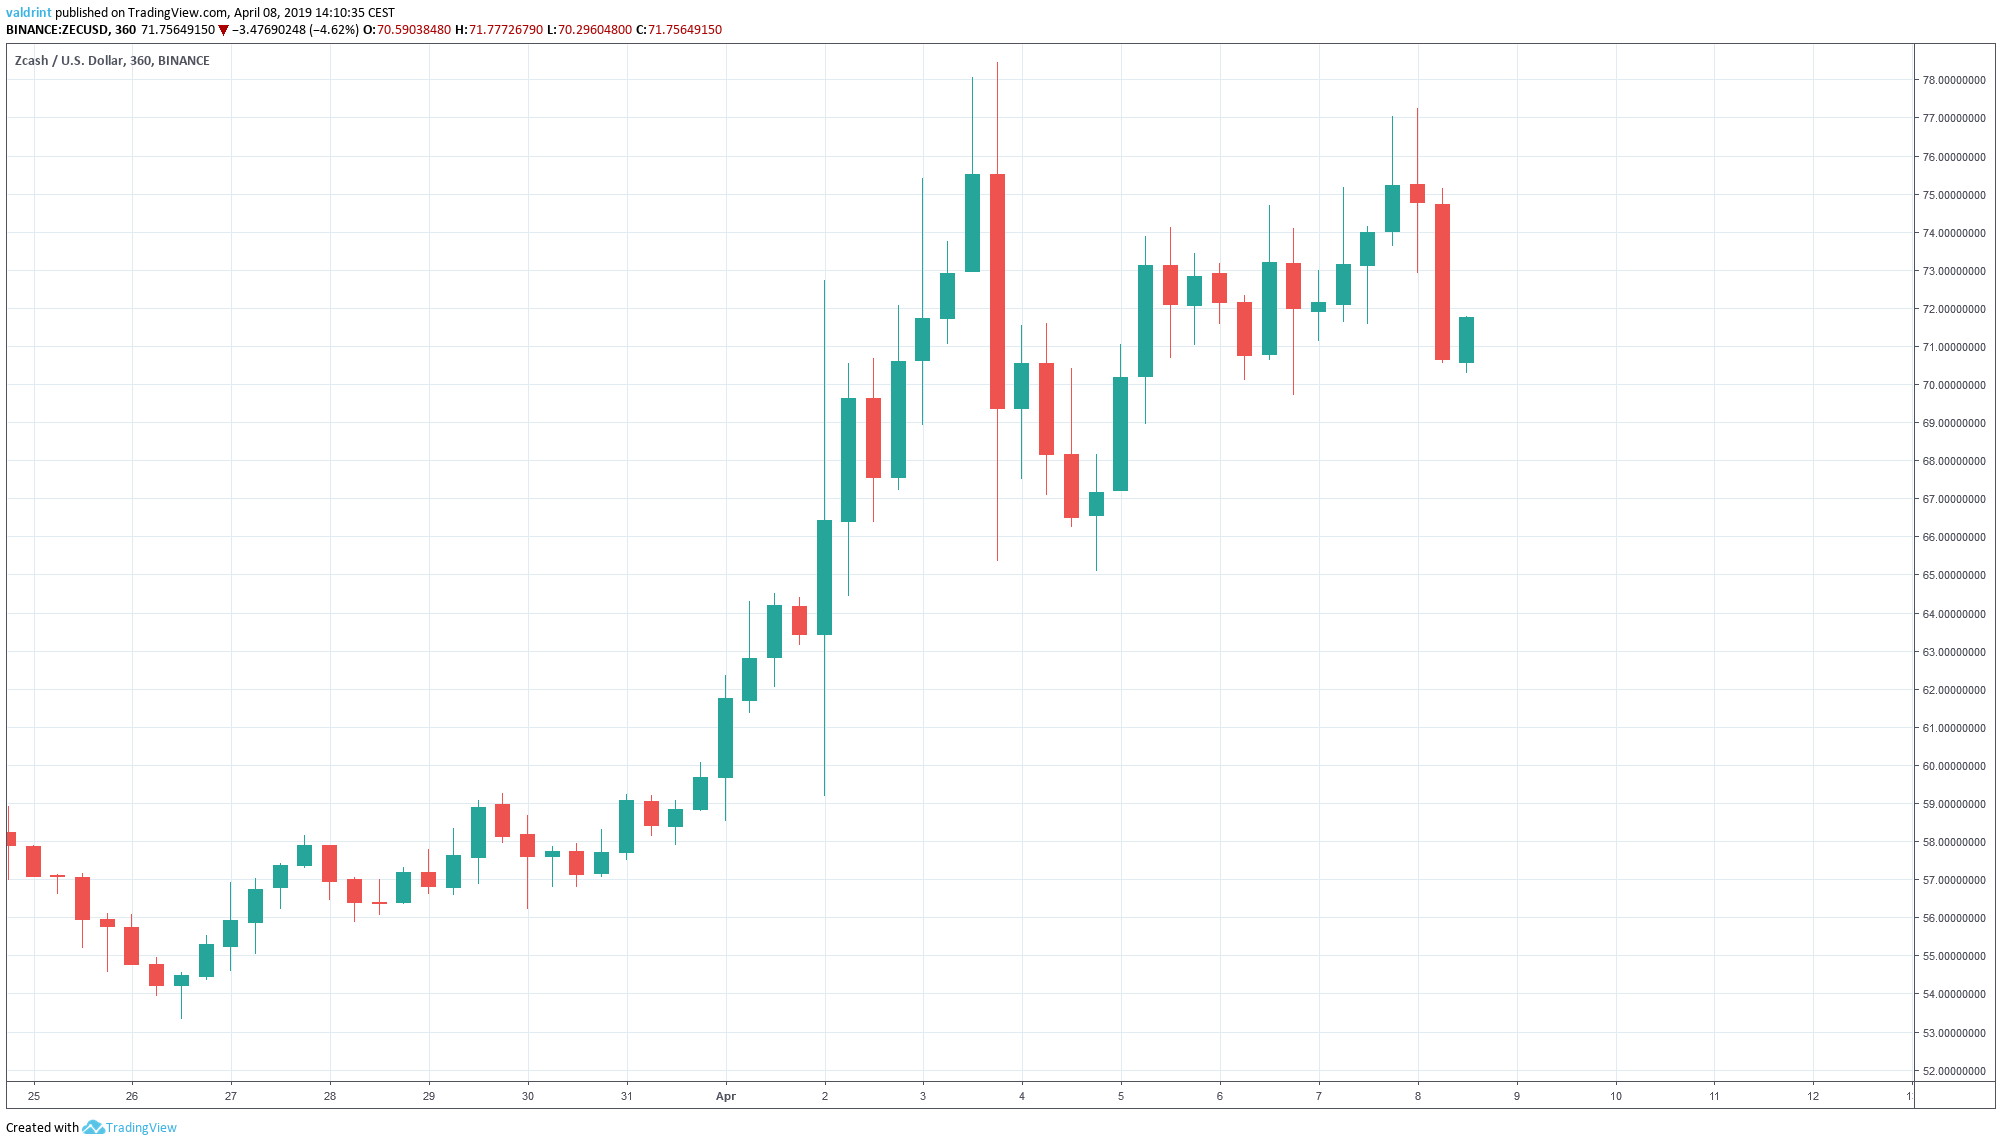
On Mar 26, 2019, Zcash reached a low of $53. A gradual increase accelerated in early April. Zcash reached nearly a high of nearly$80 on Apr 3.
A sharp drop followed this peak. Lows of around $65 were experienced on Apr 4.
Since that time, the price has been on a gradual increase with a high of over $77 experienced on Apr 8.
Is the price of Zcash going to continue rising or is a reversal coming soon?
Let’s find.
Learn more About Privacy Coins Here!
Zcash (ZEC): Trends and Highlights for Apr 8, 2019
- The price of Zcash has been on a gradual uptrend since Mar 26.
- ZEC is following an ascending support line.
- It has made a double top pattern.
- Bearish divergence developing in the RSI.
- There is resistance near $77 and support near $59.
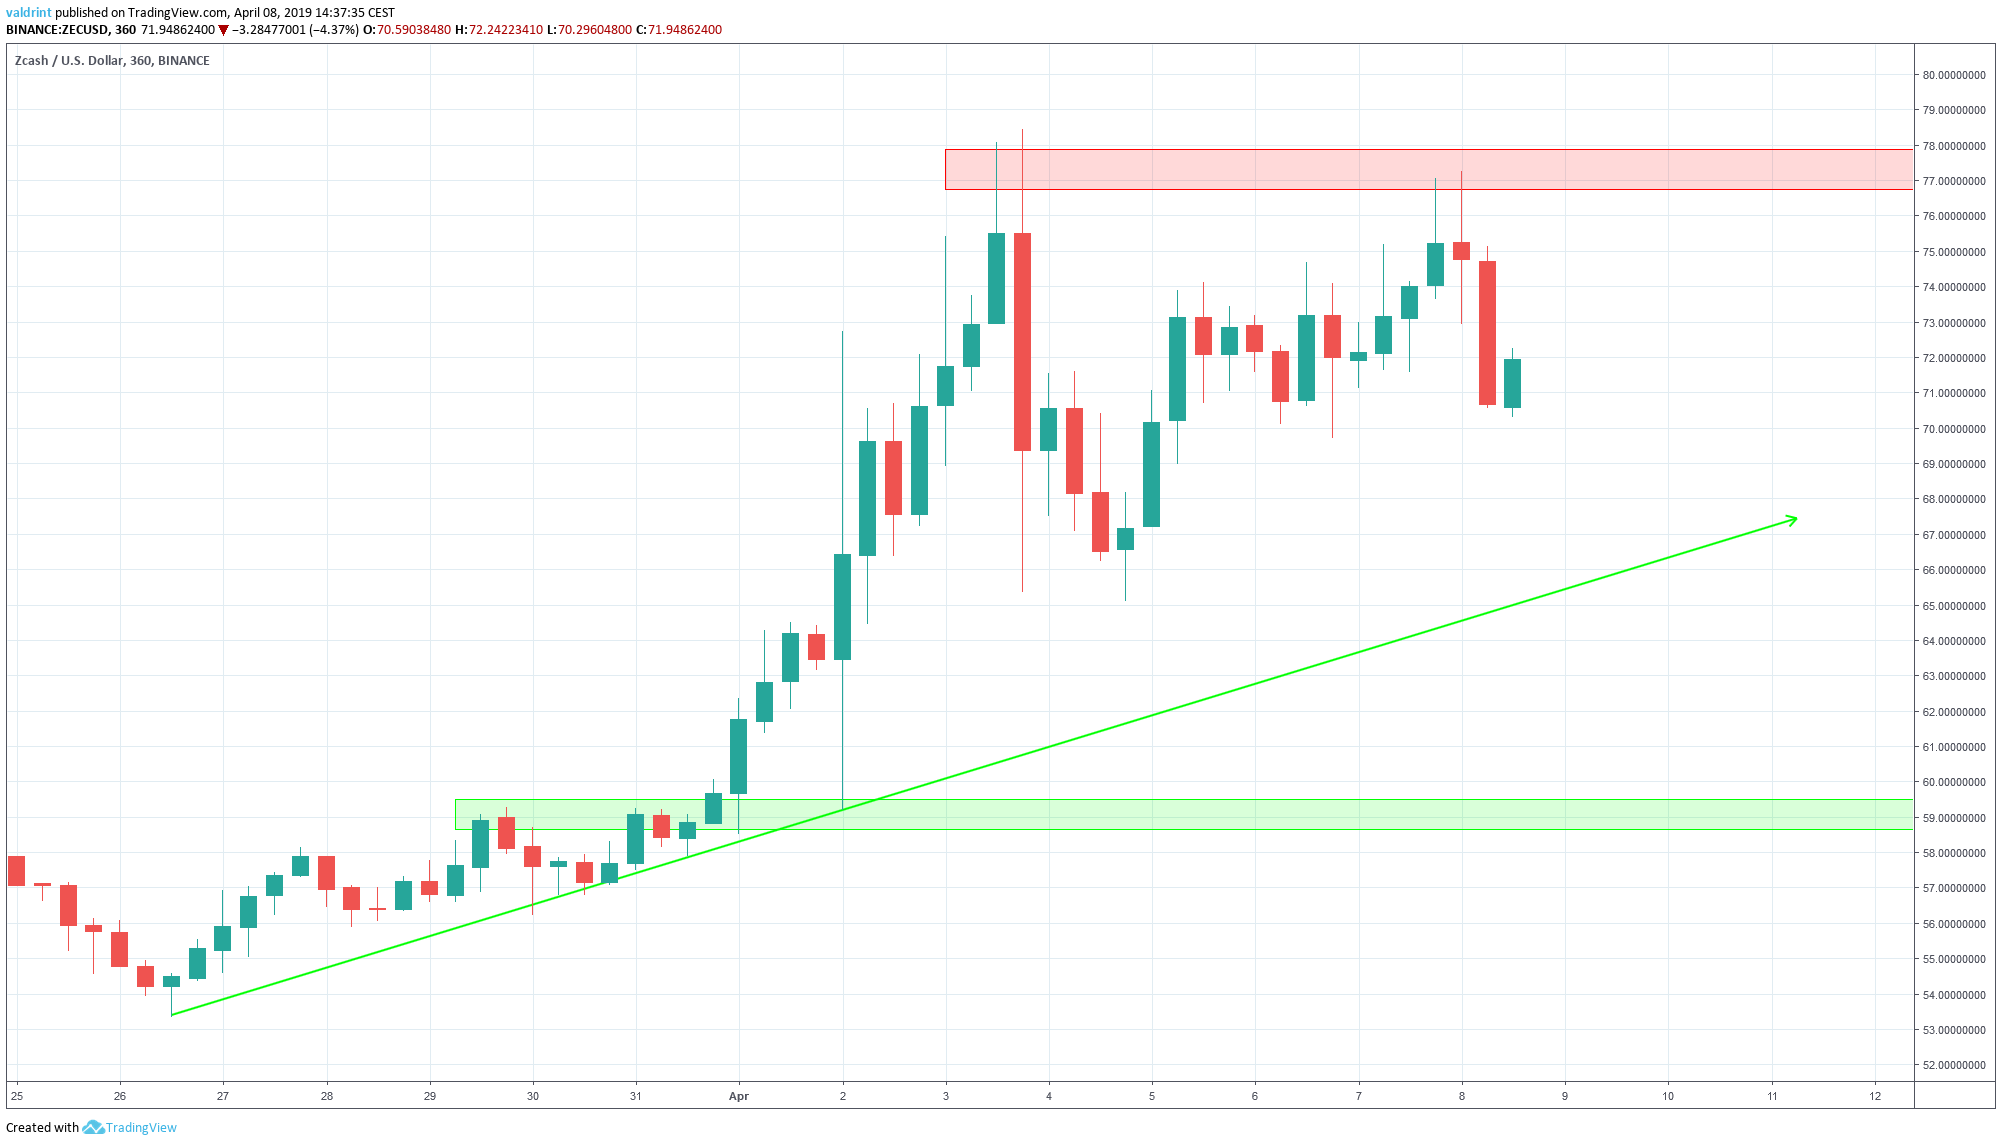
Ascending Support Line
The price made a low of $53.60 on Mar 26. A gradual upward move followed. Several market cycles have been completed since and after each one the lows have been higher than the preceding ones.
Tracing these lows gives us an ascending support line:
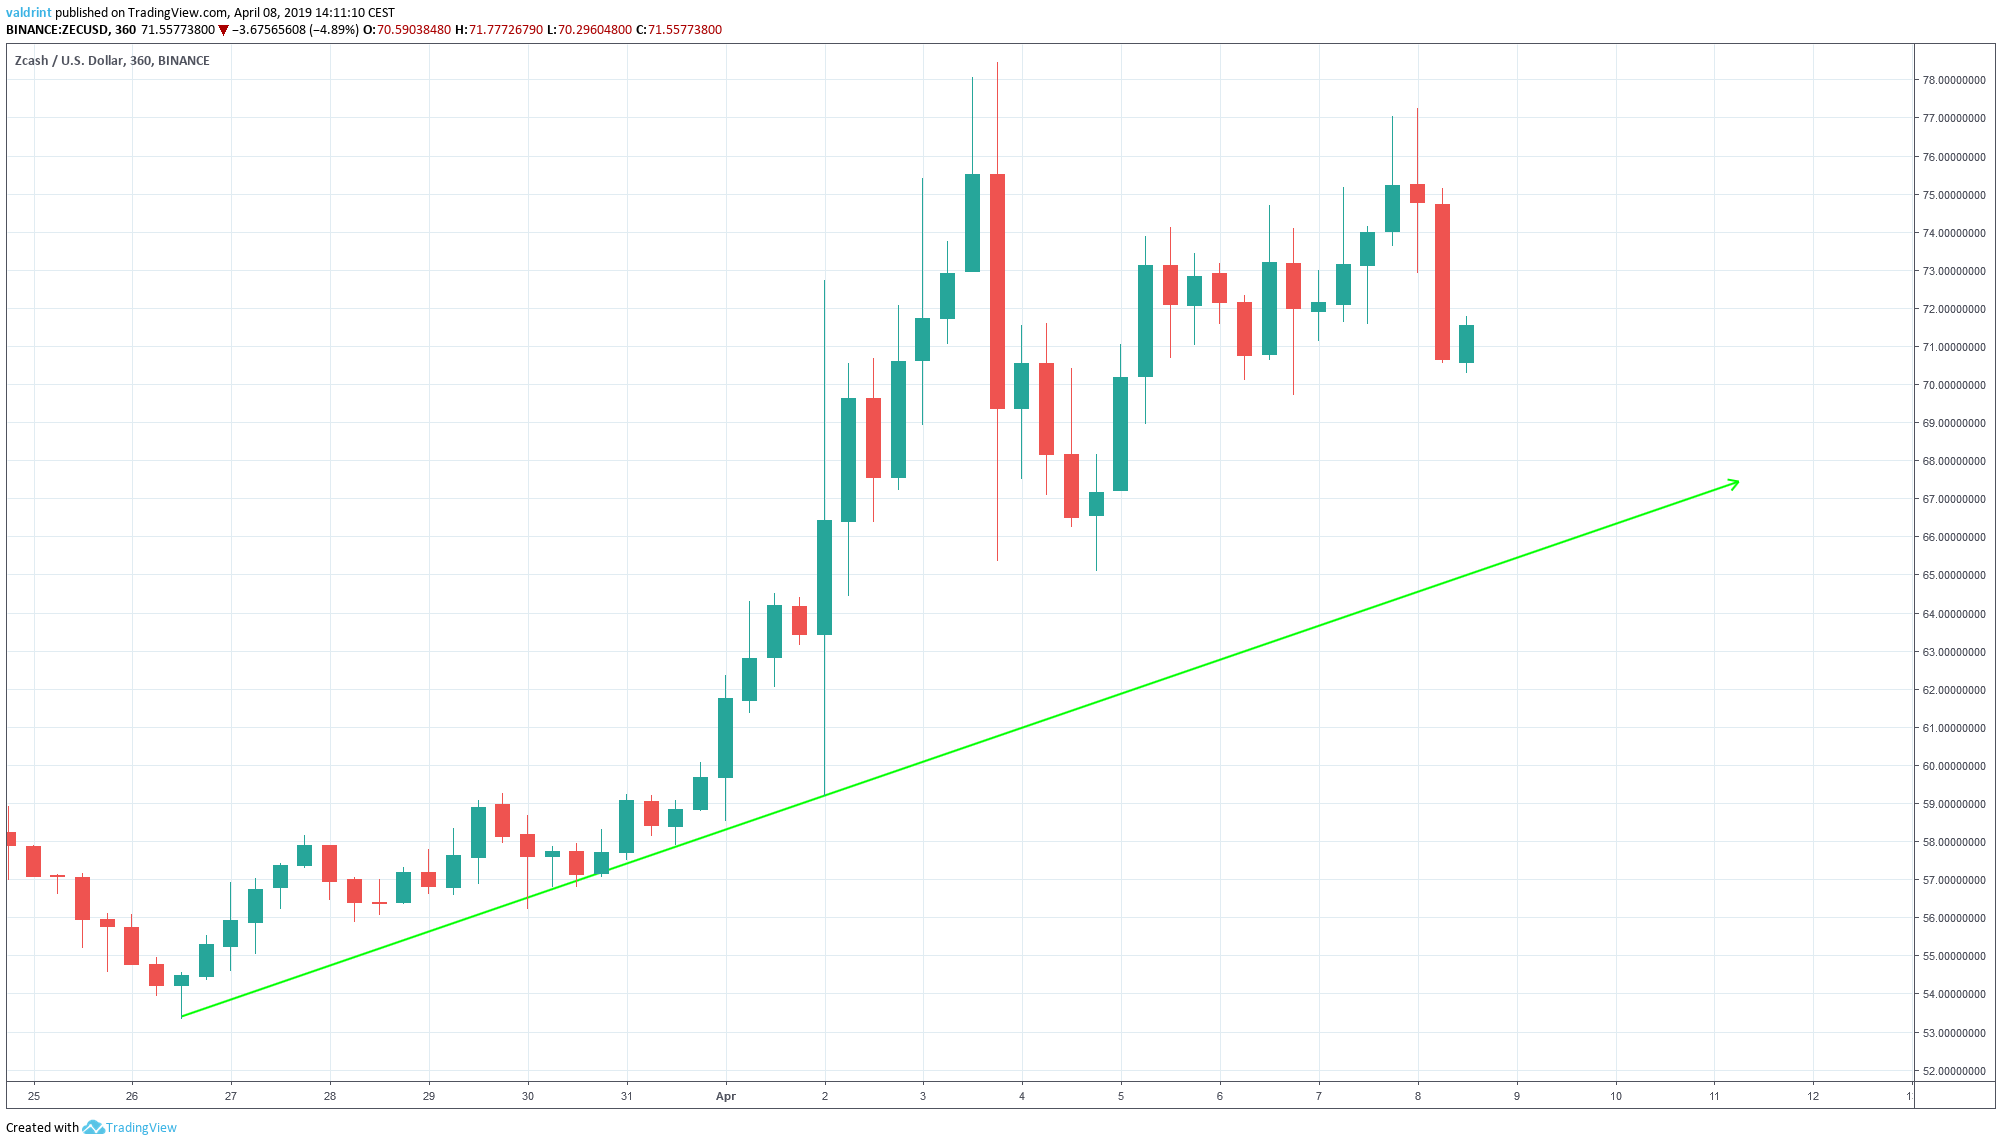
There is no visible resistance line. However, there is a possible bearish pattern forming. Let’s learn more.
Bearish Pattern
The bearish pattern that appears to be developing is referred to as a “double top.”
On Apr 3, the price reached a high of $78.45. It reached a similar high of $77.25 on Apr 8.
The arrows in that chart below locate these two points:
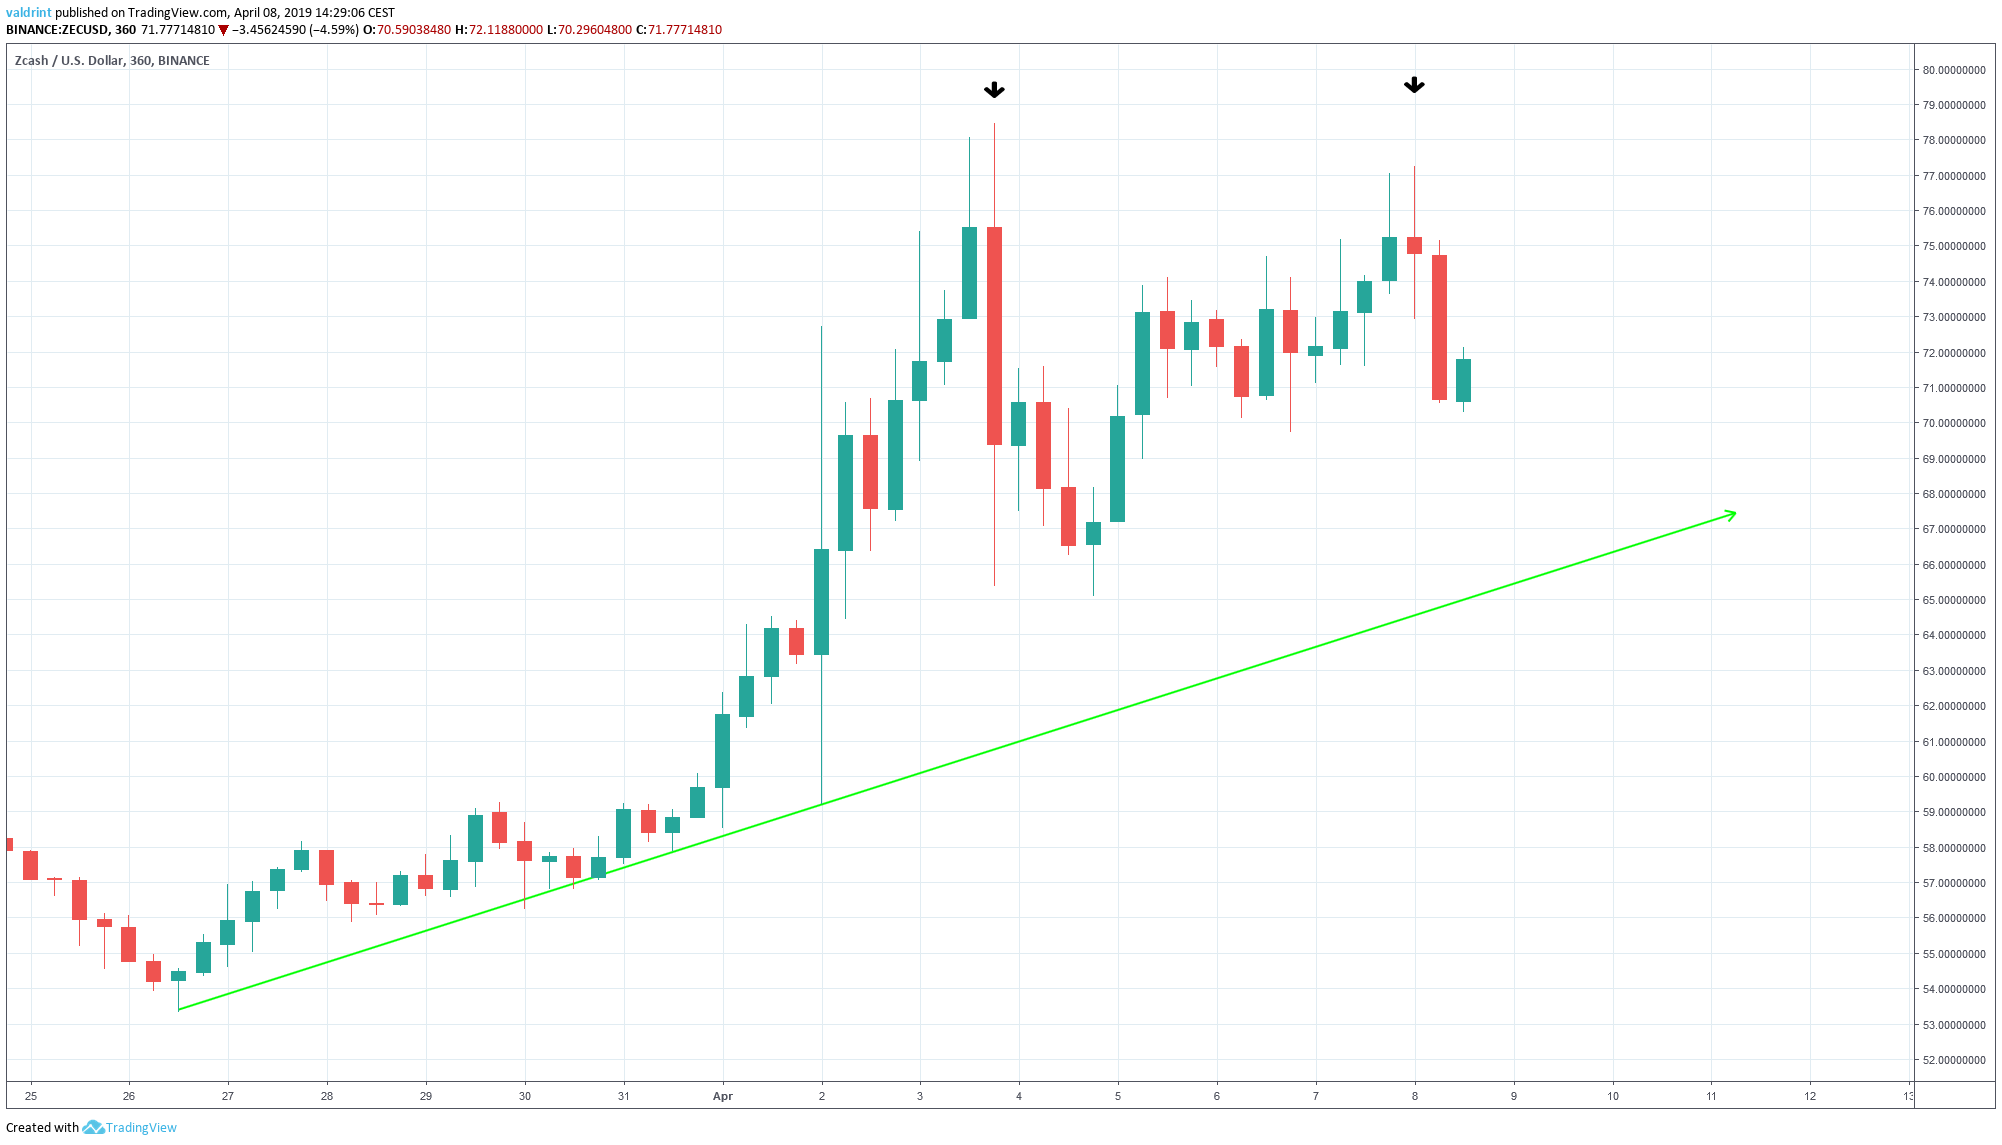
In addition, there was a moderate decline between the two highs. Thus, the price of Zcash appears to exhibit the characteristics of a double top pattern.
Because this is a bearish pattern, A drop towards the support line appears likely.
In order to assess whether price drops are indeed likely, we need to take a look at some technical indicators.
RSI Divergence
We begin by incorporating RSI into our analysis.
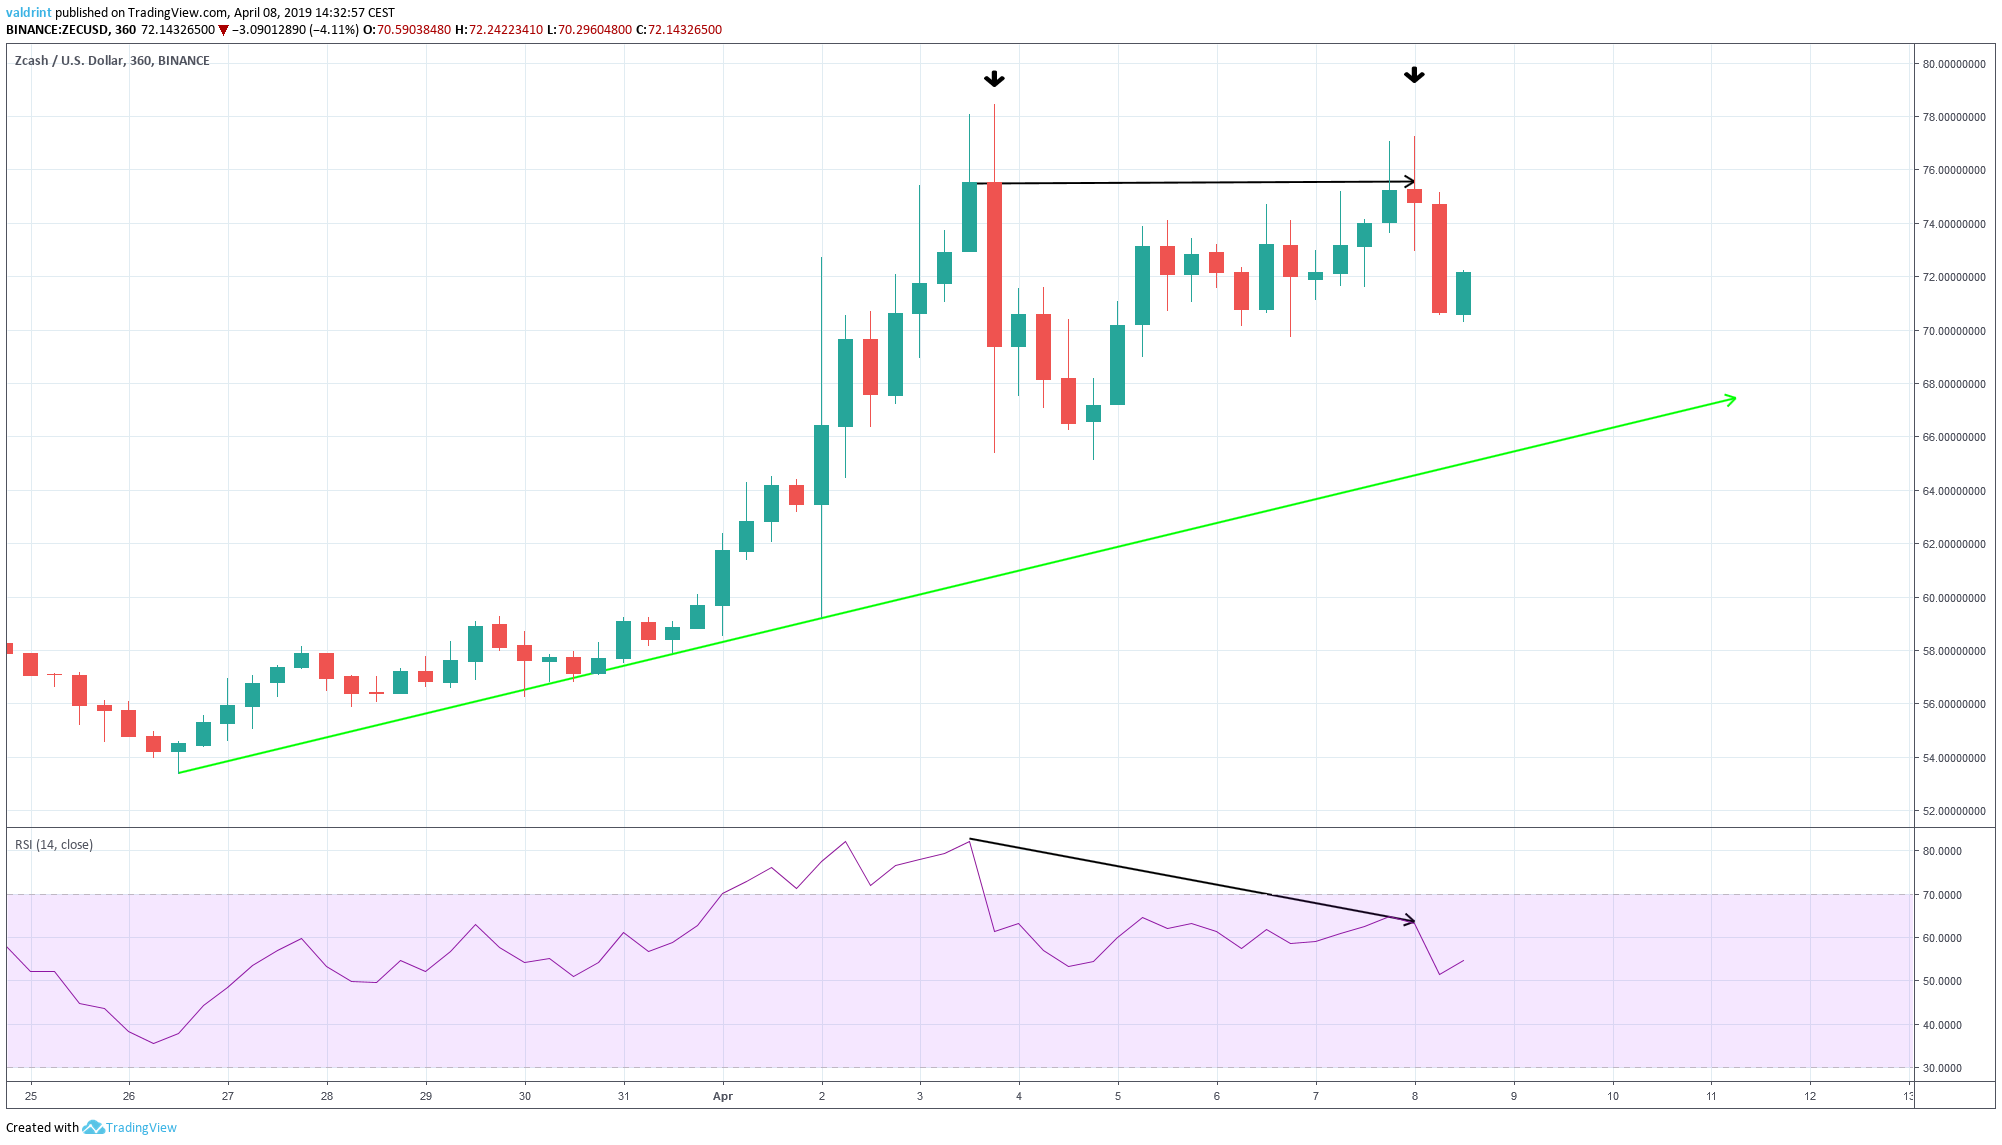
On Apr 3 the price made a high of $78.45. It reached a similar level on Apr 8.
Similarly, the RSI made its first high during the same interval. However, it has proceeded to generate lower values.
This is known as bearish divergence and often precedes price decreases.
Using this indicator combined with the double top pattern, we believe that price drops are likely in the near future.
Reversal Areas
The first resistance area is found near $77. If the price reaches this level, it could create a triple top pattern. Similar to the double top pattern, this would represent a bearish reversal. Prices would likely drop soon after reaching this level.
The closest support area is provided by the ascending support line, which is currently at $67. Afterwards, the closest support area is found near $59. Price may drop toward these areas in the near future.
Summary of Analysis
Based on this analysis, the price will likely drop towards the ascending support line. This means a likely short-term decrease in price.
Do you think the price of ZEC will drop towards the support line? Let us know in the comments below.
Disclaimer: This article is not trading advice and should not be construed as such. Always consult a trained financial professional before investing in cryptocurrencies, as the market is particularly volatile.


