
The prices of both Yearn.Finance (YFI) and DFI.Money (YFII) have been increasing since Nov 5.
While the former has already flipped an important resistance area, the latter is still struggling to break out.
YFII Trading Range
Since Oct 7, the YFII price has been trading in a range between $1,200-$2,500. On Nov 5, the price deviated below the range low (shown in the red circle) only to reclaim it shortly afterward and resume its upward movement. At the time of press, YFII is trading for $2,020 and looks to be following an ascending support line in the process.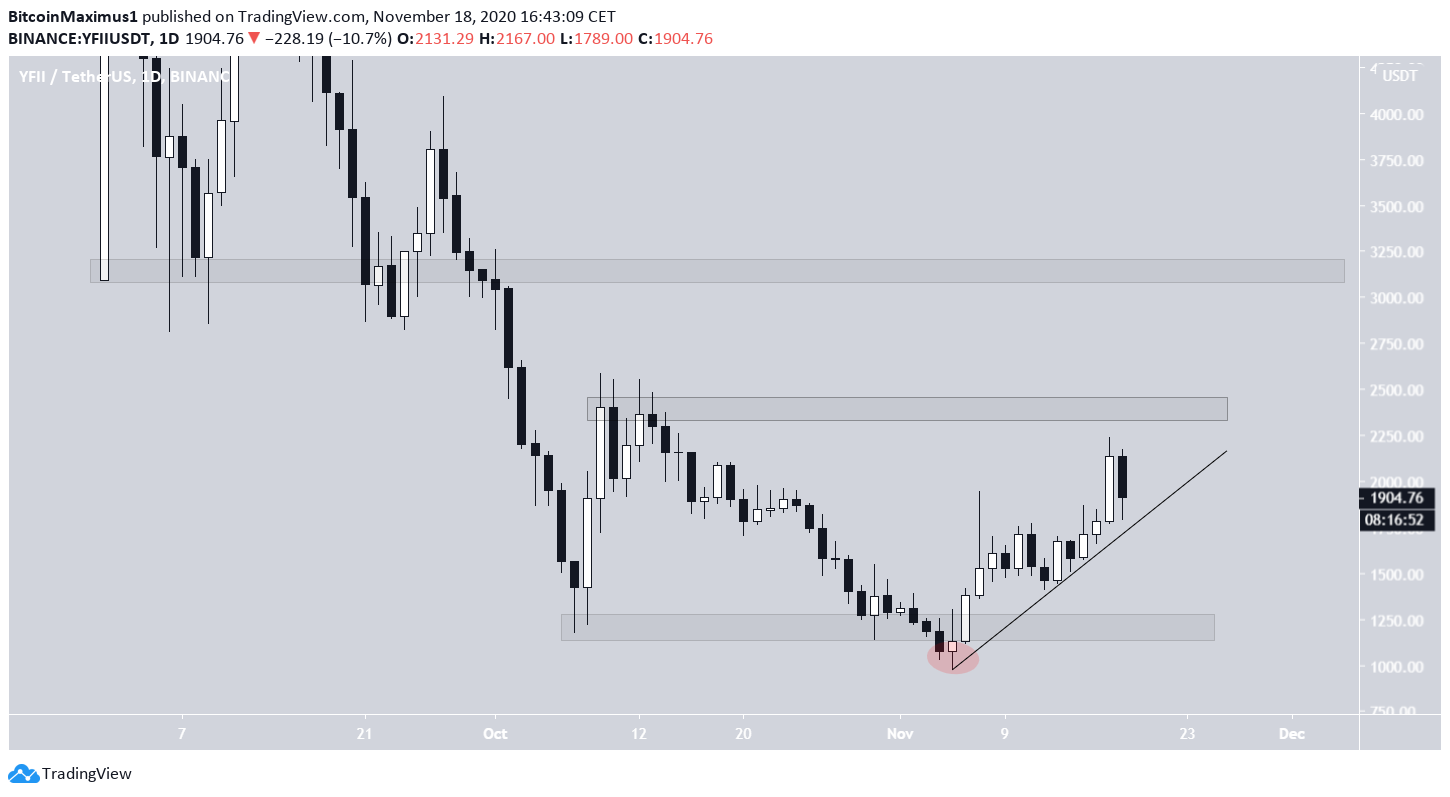
YFII Future Movement
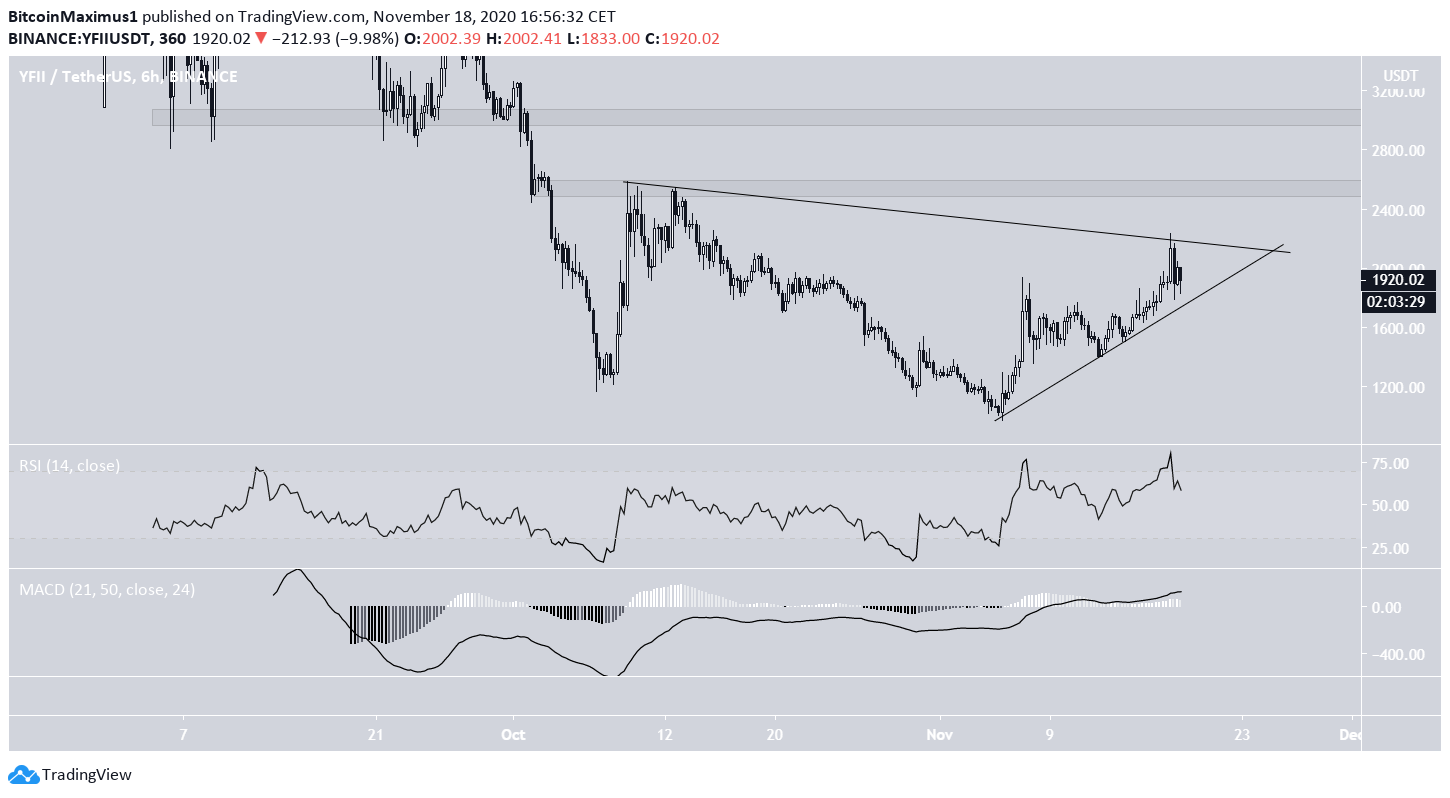
Cryptocurrency trader @CryptoTony_ outlined a YFII chart, stating that the price will likely complete one final increase towards $2,500 before eventually dropping. The proposed increase would take the price to the resistance area that we outlined in the previous section.
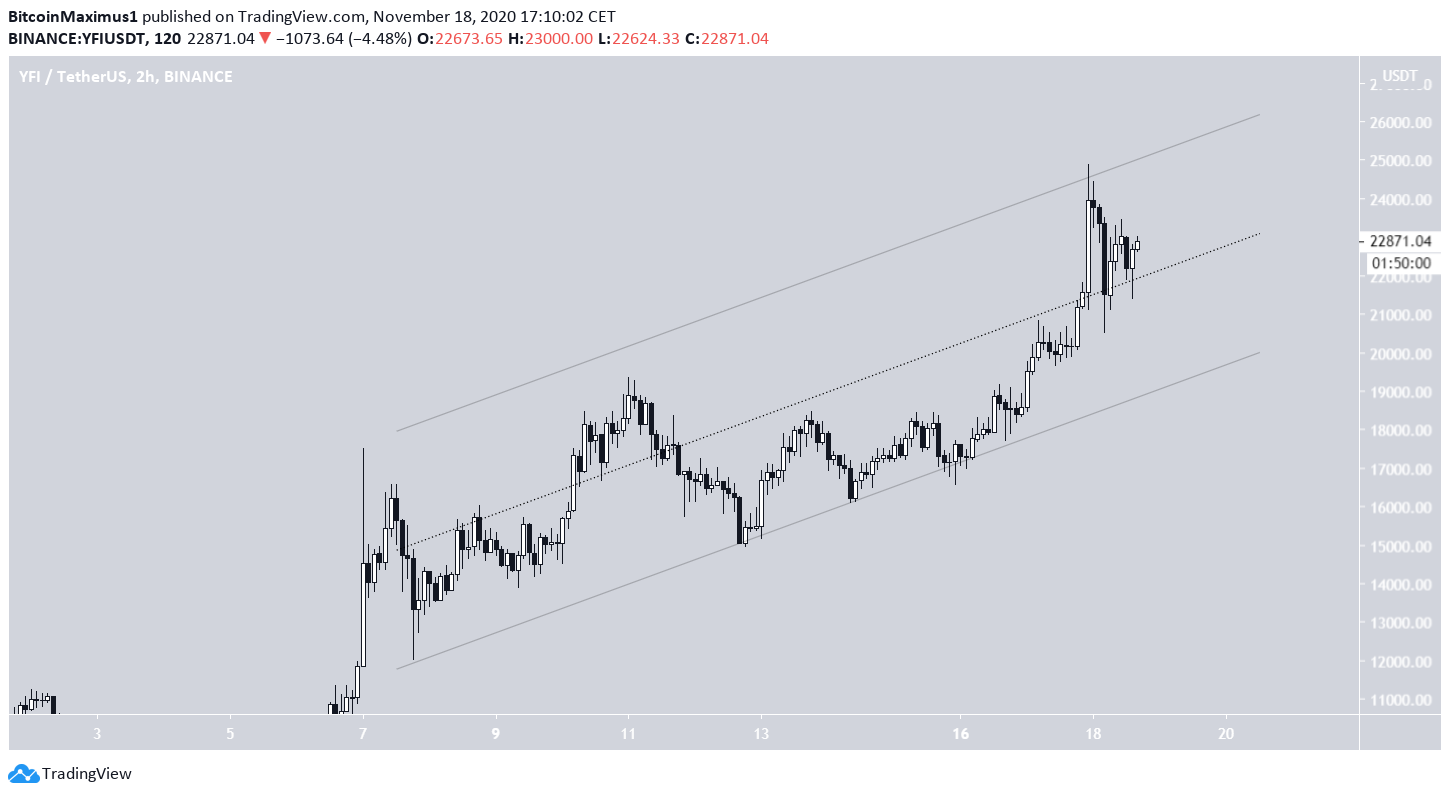
YFI Breakout
Even though both YFII and YFI have been increasing since Nov 5, the latter has already broken out above the main resistance area at $21,000 and is in the process of validating it as support. If the price continues increasing, the next resistance area would be found at $26,000. Technical indicators are bullish and support the possibility of this increase.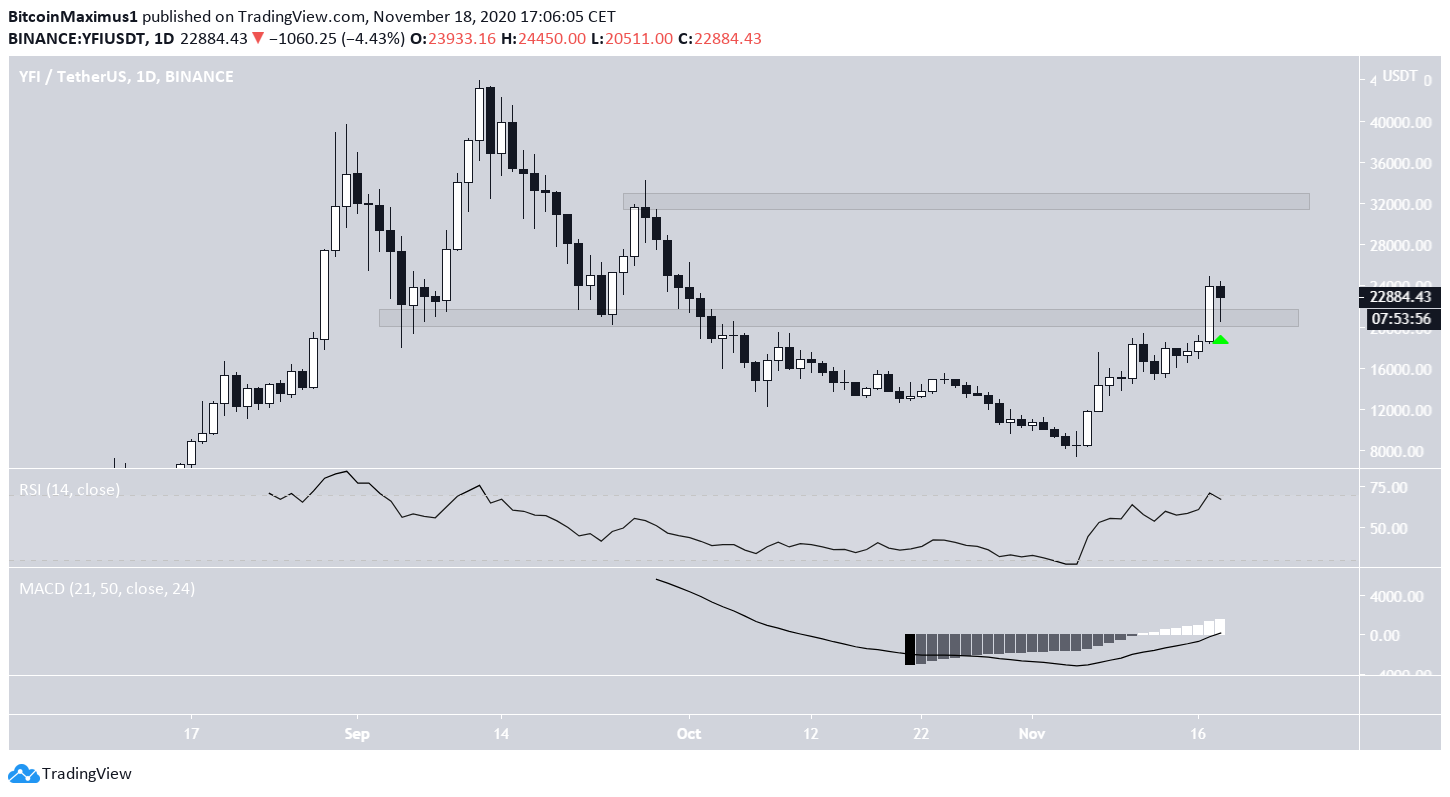
Conclusion
While the direction of the trend is not certain for either YFI or YFII, a break out/down from their current structures will likely play a big role in determining their trajectory. For BeInCrypto’s latest Bitcoin analysis, click here! Disclaimer: Cryptocurrency trading carries a high level of risk and may not be suitable for all investors. The views expressed in this article do not reflect those of BeInCryptoDisclaimer
In line with the Trust Project guidelines, this price analysis article is for informational purposes only and should not be considered financial or investment advice. BeInCrypto is committed to accurate, unbiased reporting, but market conditions are subject to change without notice. Always conduct your own research and consult with a professional before making any financial decisions. Please note that our Terms and Conditions, Privacy Policy, and Disclaimers have been updated.

Valdrin Tahiri
Valdrin discovered cryptocurrencies while he was getting his MSc in Financial Markets from the Barcelona School of Economics. Shortly after graduating, he began writing for several different cryptocurrency related websites as a freelancer before eventually taking on the role of BeInCrypto's Senior Analyst.
(I do not have a discord and will not contact you first there. Beware of scammers)
READ FULL BIO
Sponsored
Sponsored