


The Bitcoin (BTC) price reached a high of $18,476 on Nov 18 before dropping significantly. While it is not yet certain if BTC has reached a top, a short-term retracement towards support levels is expected.
On Nov 17, Bitcoin (BTC) was subject to a massive increase, reaching a close of $17,680.
The price continued its ascent the next day but dropped sharply once it reached a high of $18,476. However, BTC has already regained the majority of the losses from the drop.
Bitcoin Goes Parabolic
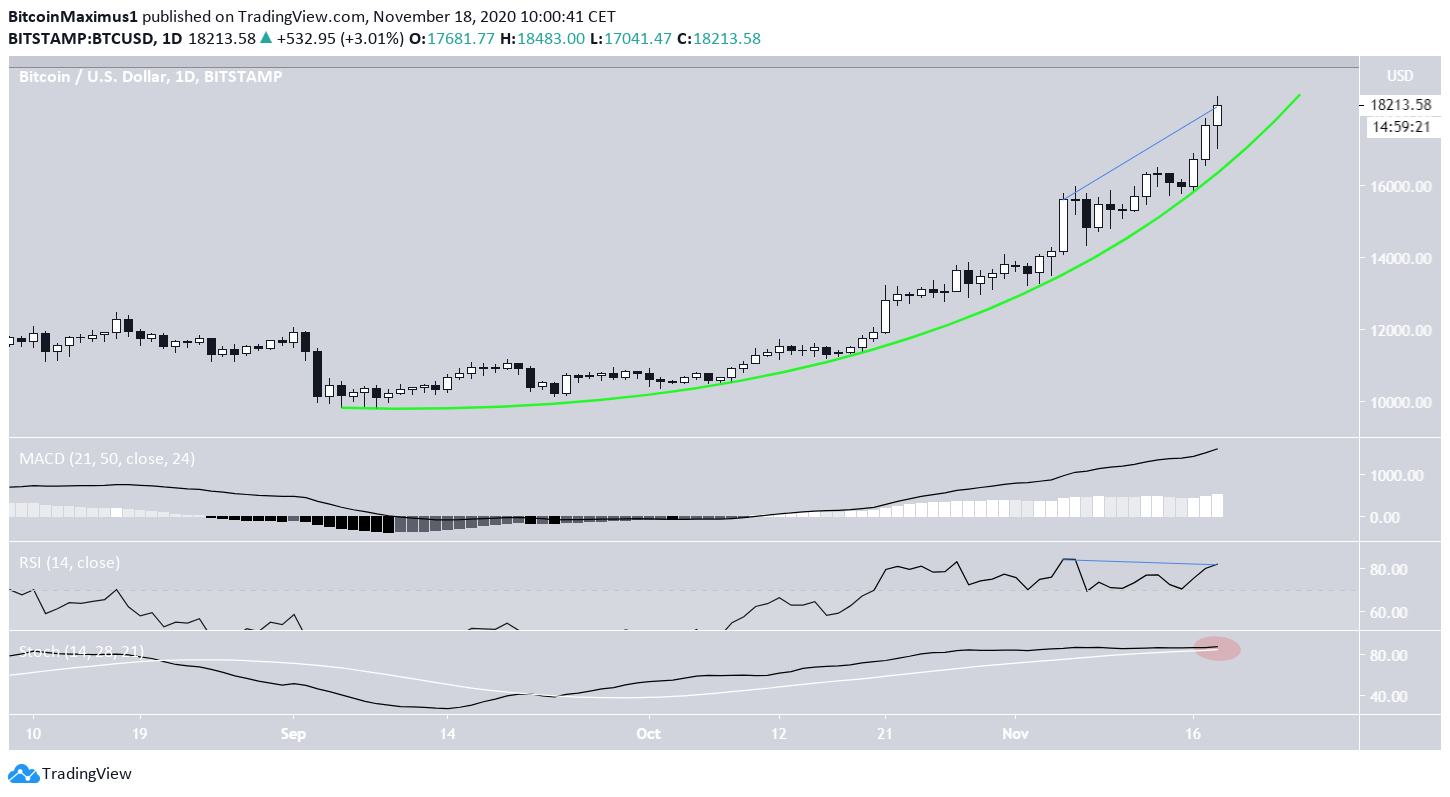
Bitcoin is following a parabolic ascending support line which has not been broken yet.
While the RSI has generated bearish divergence, the MACD has reversed and is increasing. The Stochastic oscillator has not yet made a bearish cross.
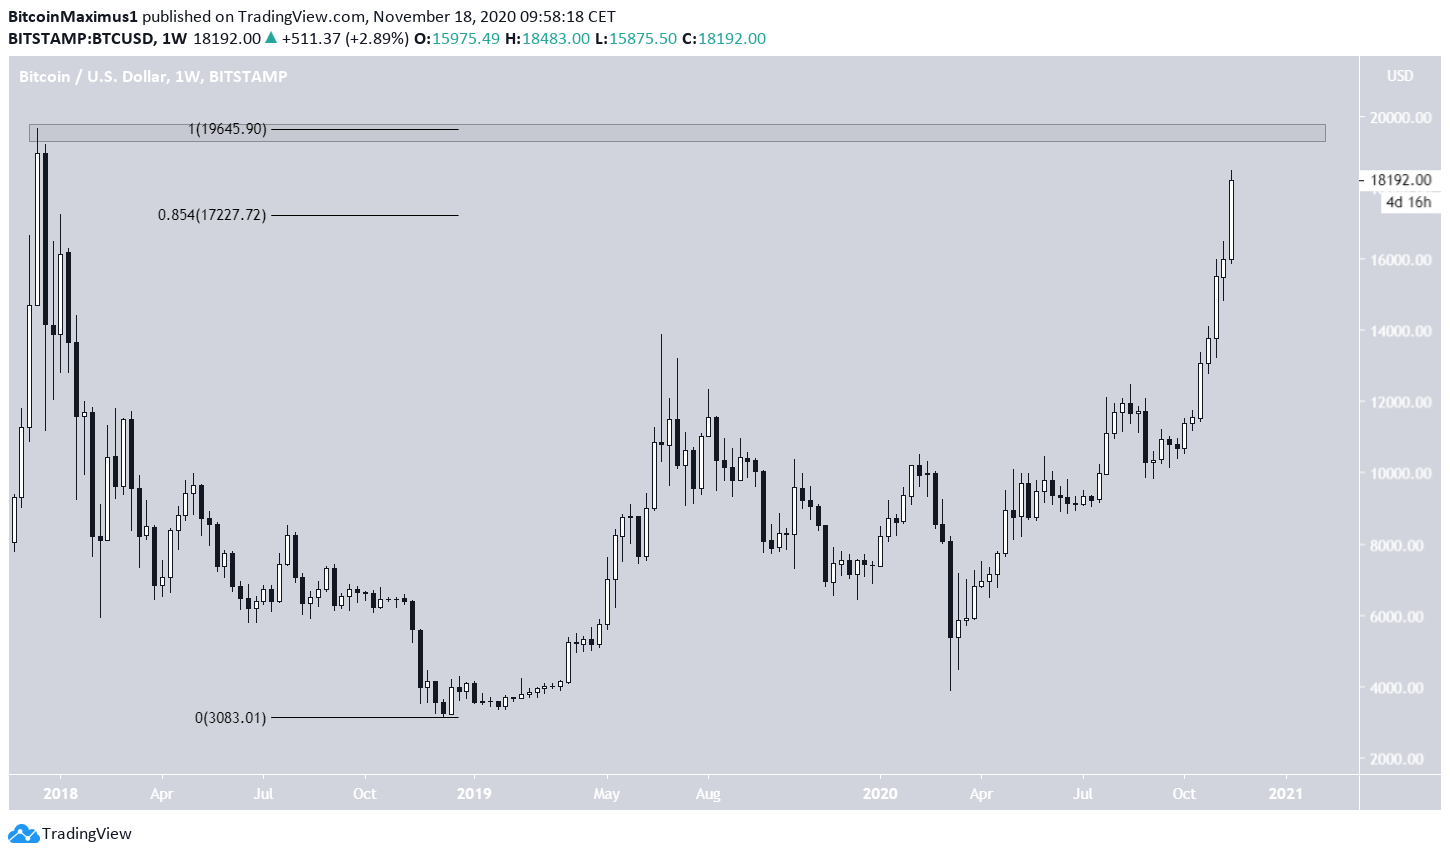
The weekly time-frame shows that BTC has definitively moved above the 0.854 Fib retracement level of the previous decrease.
The next significant resistance area is found from the 2017 all-time high near $19,645.
Sharp Rejection
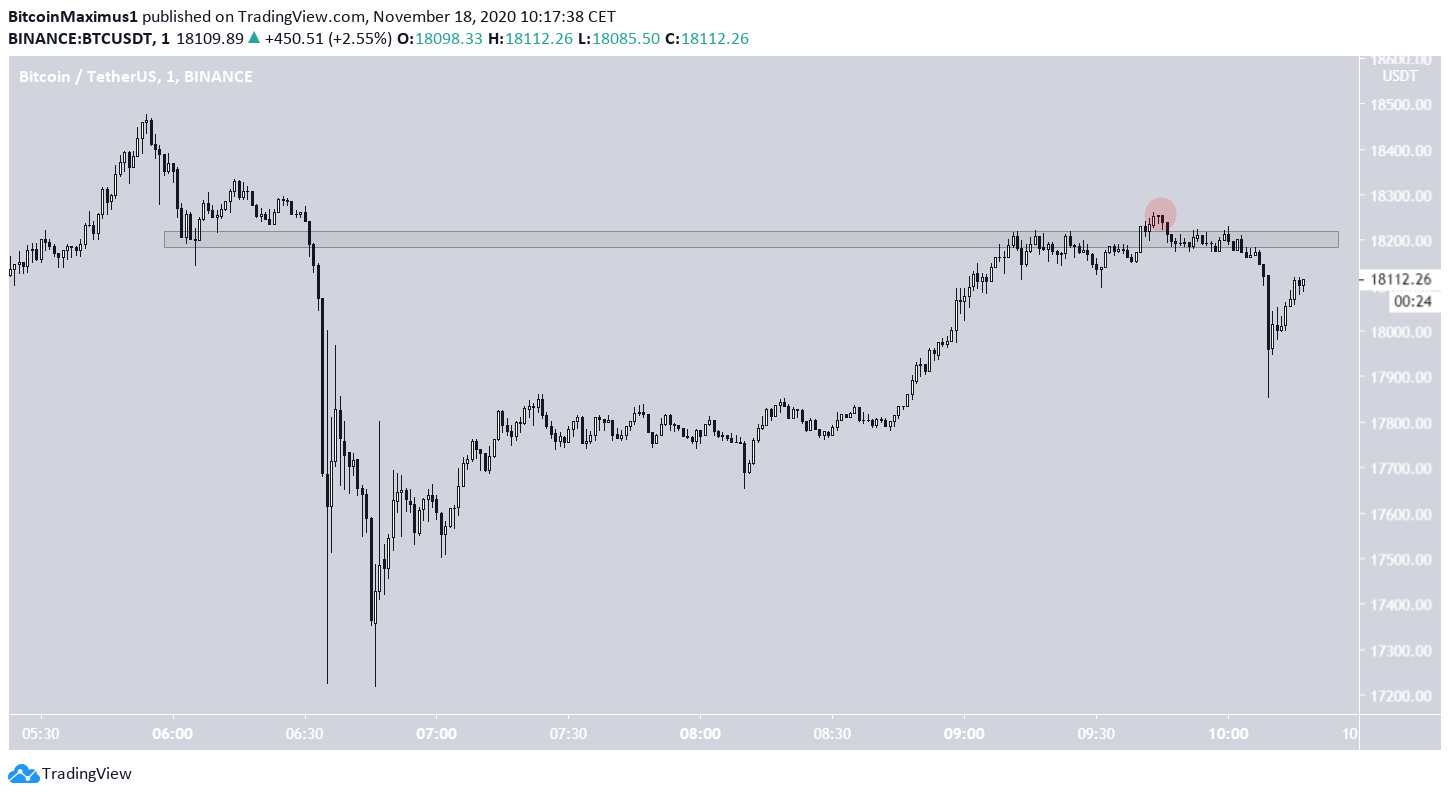
The hourly chart shows a massive bearish engulfing candlestick after the price reached a high of $18,476. While BTC reached a low of $17,214 in the same hour, a decrease of more than 6%, the lower prices were bought up quickly and BTC was back to trading near $18,100 at the time of press.
The hourly MACD is decreasing and the hourly RSI has generated bearish divergence, falling from the overbought region.

The minute chart provides a more bearish outlook. After the massive drop, the price returned to the $18,250 area, which previously had acted as support but has now turned to resistance. While BTC initially deviated above this level, it proceeded to fall back below it and dropped sharply afterward.
Unless BTC can reclaim this level, the short-term trend is considered bearish.
Future Movement
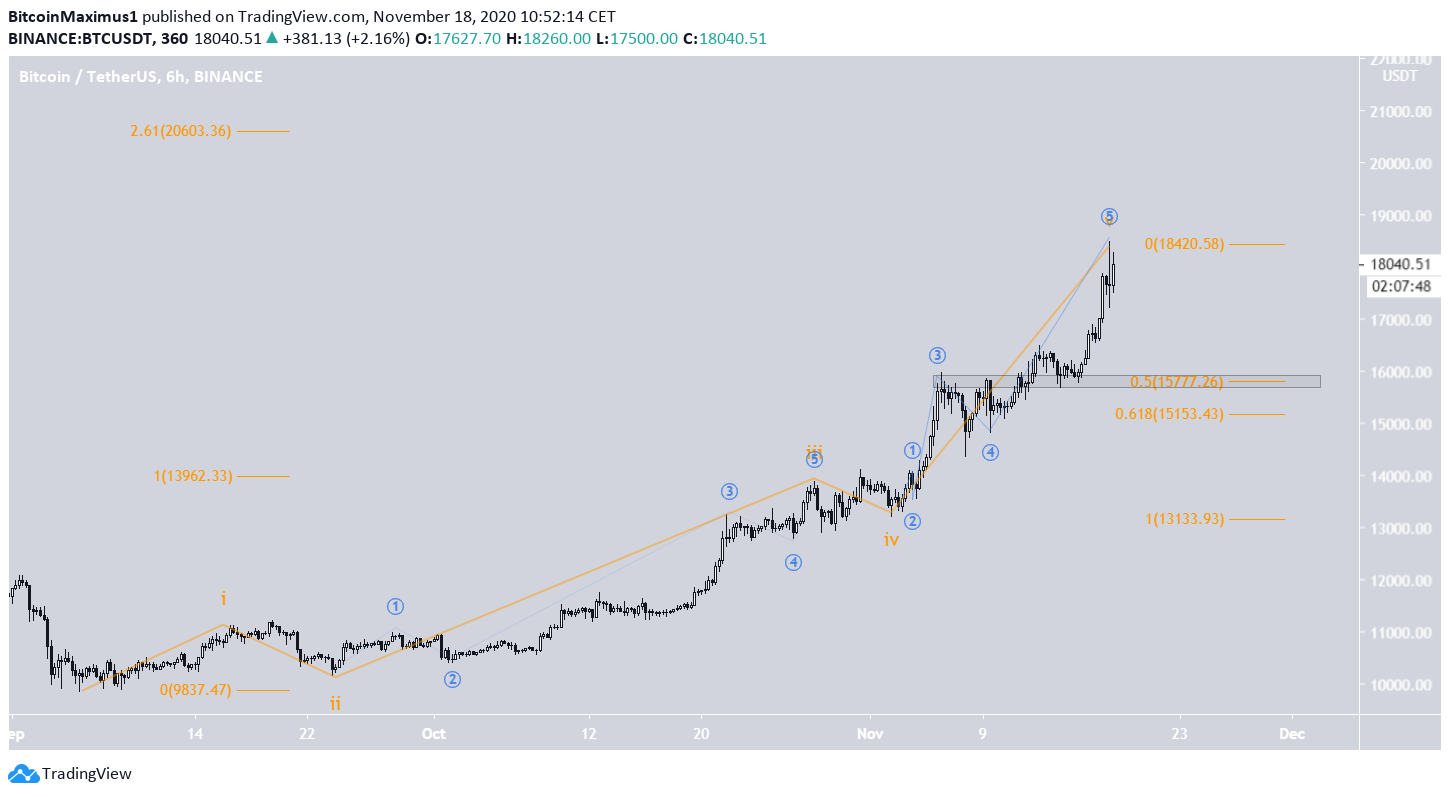
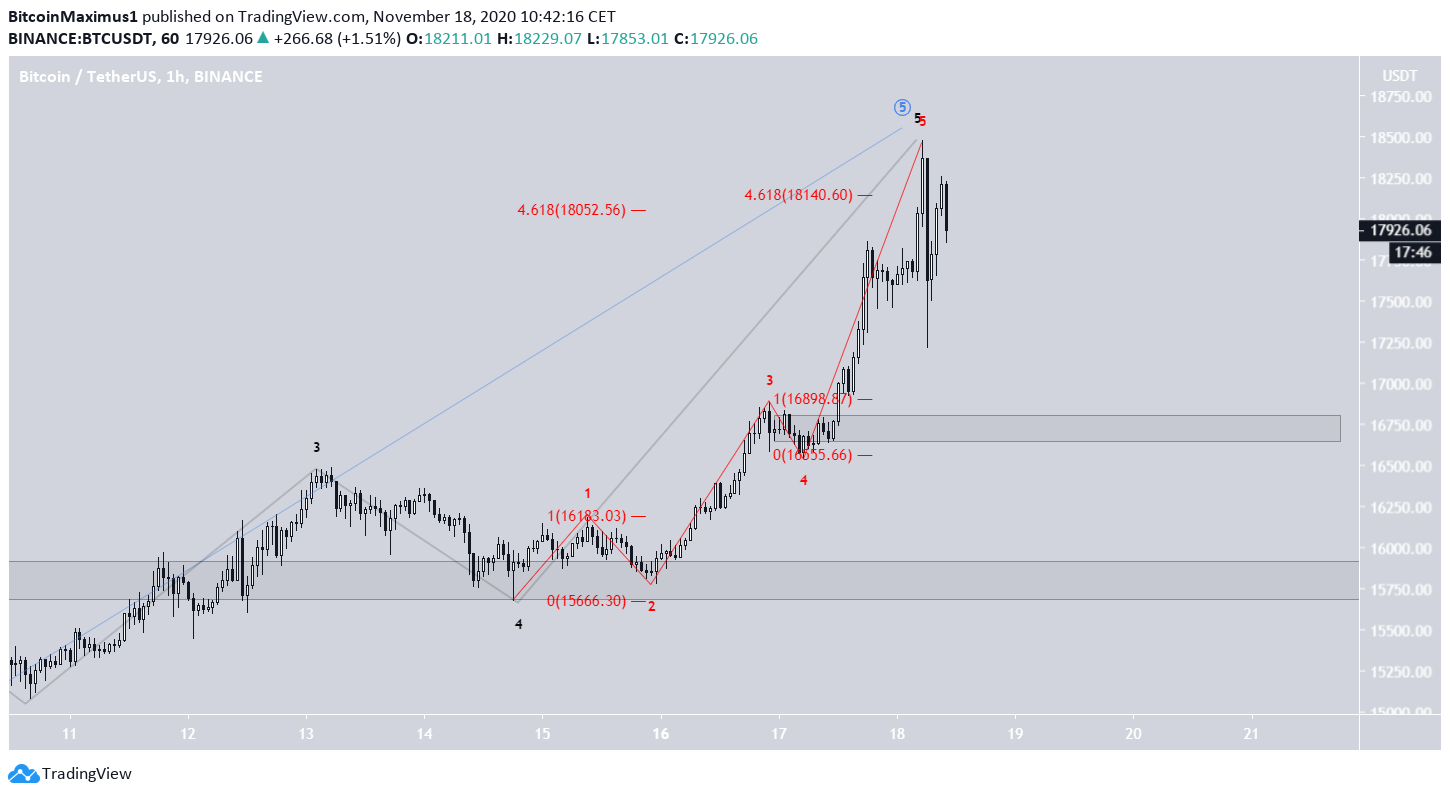
The short-term wave count for BTC suggests that the price has already reached a high. We can outline five waves upward (orange) and their sub-waves (blue), to complete a long-term bullish impulse.
Despite this, the high was not reached at any significant Fib retracement level, allowing for the possibility that it will still create another high.
A zone that could act as a top is $20,054. This price is just above the all-time high and the 2.61 Fib extension of waves 1-3.
Any short-term correction that happens in the meantime could take the price as low as $15,777. This is a previous resistance area turned support and the 0.5 Fib retracement level of the most recent upward move.
The shorter-term chart, however, supports the possibility of a decrease. The high was reached at two significant Fib retracement levels, so a move back to the $16,750 region is a real possibility.
Conclusion
While it is not yet clear if BTC has reached a top, a short-term corrective movement towards the support areas at $16,750 and possibly $15,750 seems to be the most likely scenario.
An increase above $18,260 would invalidate this synopsis.
For BeInCrypto’s previous Bitcoin analysis, click here!
Disclaimer: Cryptocurrency trading carries a high level of risk and may not be suitable for all investors. The views expressed in this article do not reflect those of BeInCrypto


