


The prices of both Yearn.Finance (YFI) and DFI.Money (YFII) have been increasing since Nov 5.
While the former has already flipped an important resistance area, the latter is still struggling to break out.
YFII Trading Range
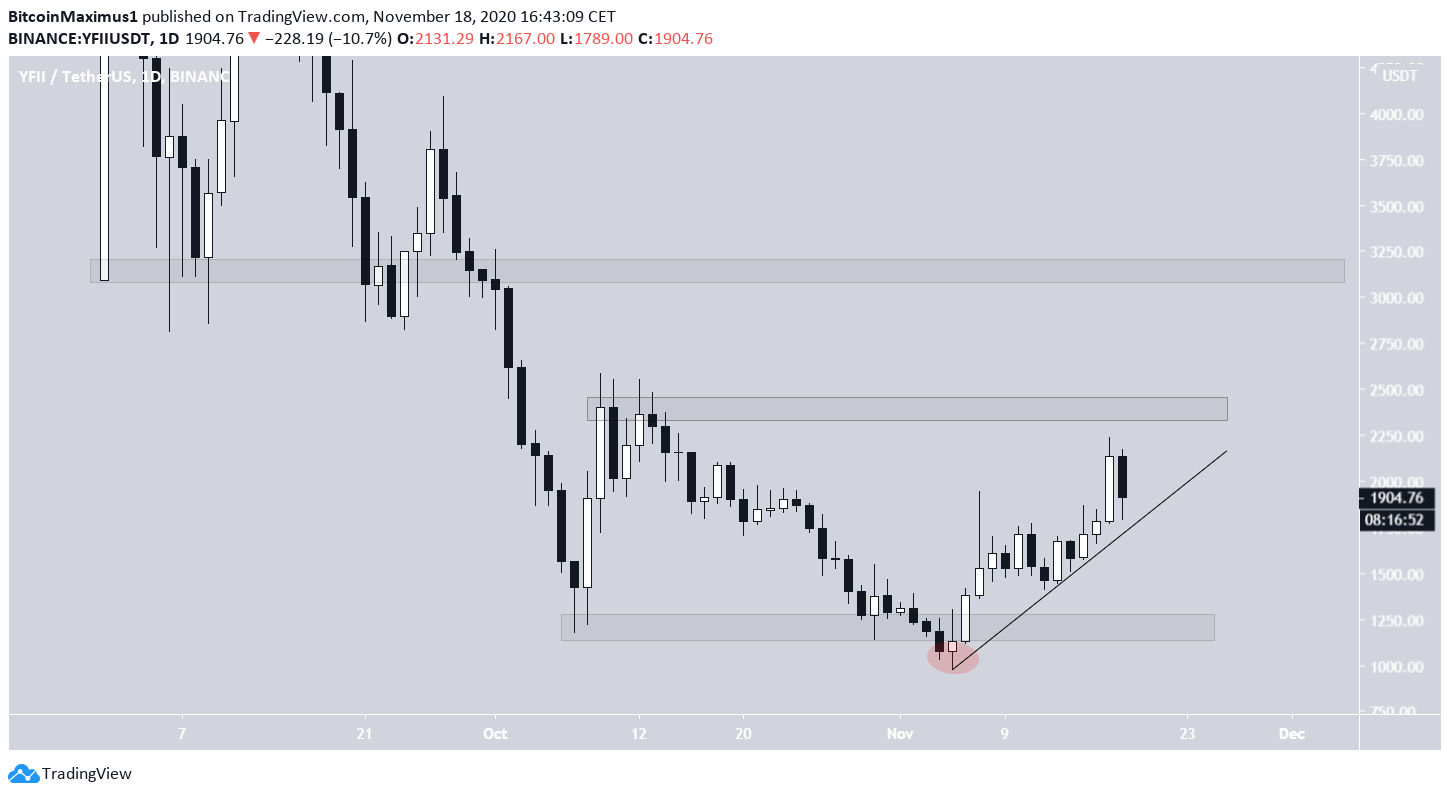
Since Oct 7, the YFII price has been trading in a range between $1,200-$2,500.
On Nov 5, the price deviated below the range low (shown in the red circle) only to reclaim it shortly afterward and resume its upward movement.
At the time of press, YFII is trading for $2,020 and looks to be following an ascending support line in the process.
YFII Future Movement
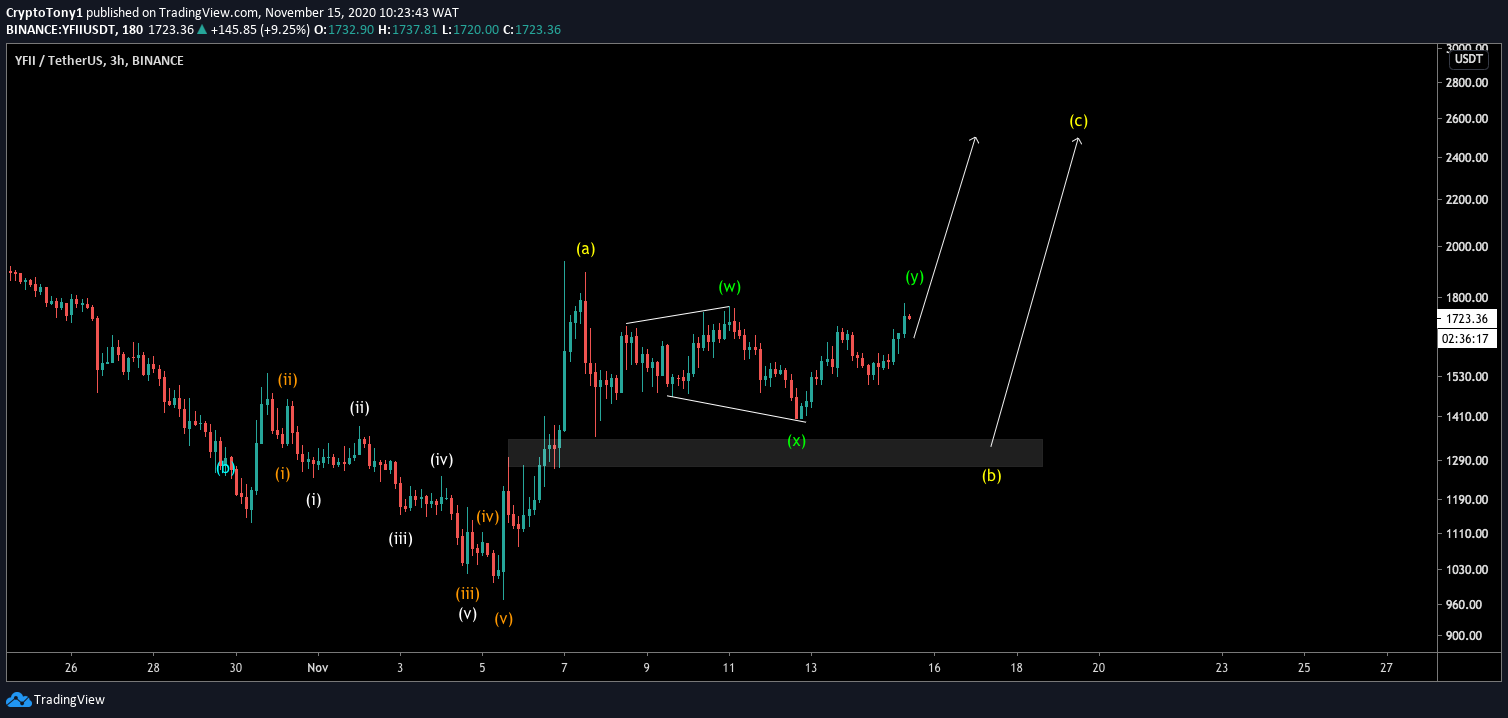
Cryptocurrency trader @CryptoTony_ outlined a YFII chart, stating that the price will likely complete one final increase towards $2,500 before eventually dropping.
The proposed increase would take the price to the resistance area that we outlined in the previous section.
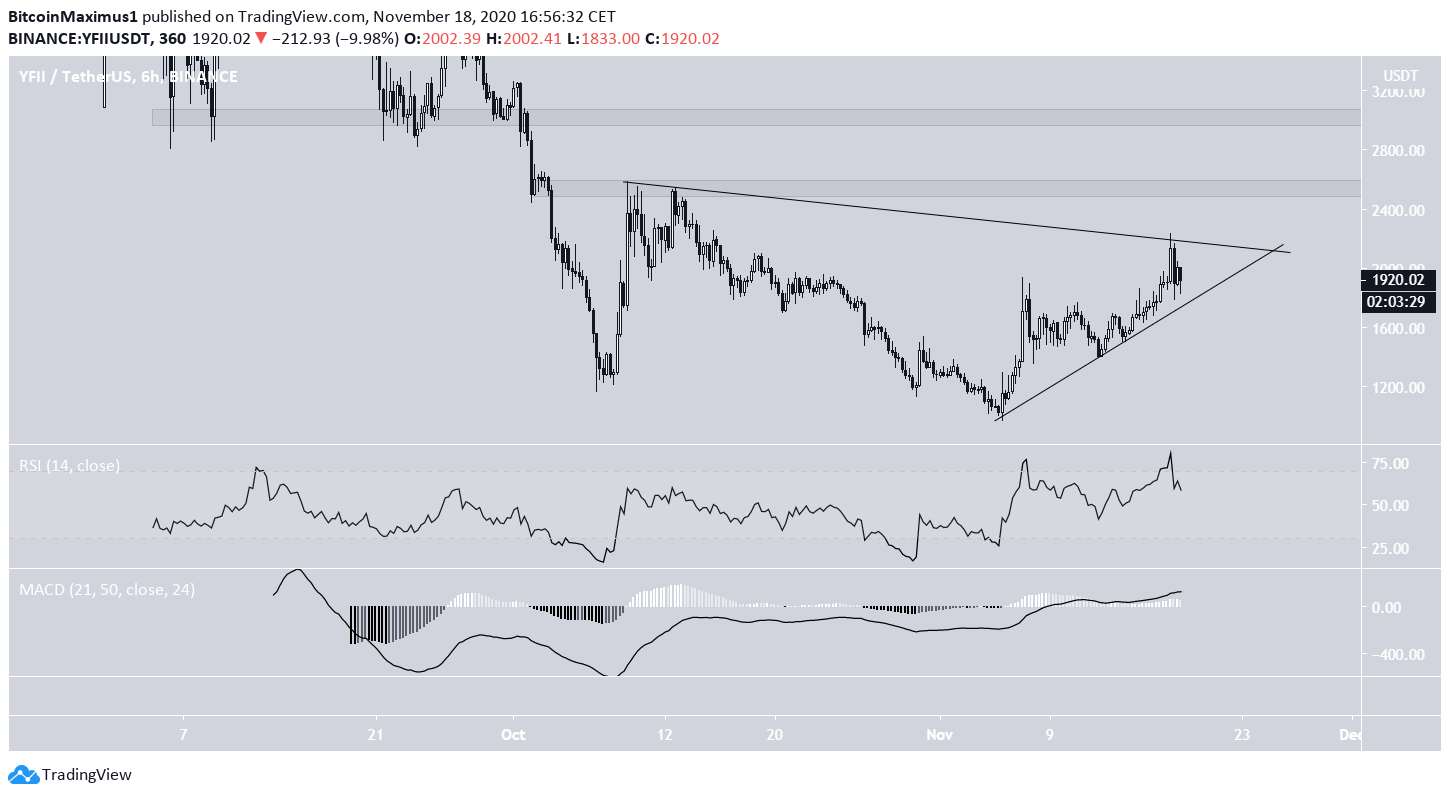
A closer look reveals that YFII may be following a descending resistance line, which creates a symmetrical triangle when combined with the aforementioned ascending support line.
Technical indicators do not yet show any weakness, indicating that the price could resume its upward movement and break out.
A breakout could take the price towards the $2,500 area and possibly the long-term resistance at $2,900.
A breakdown from the ascending support line would invalidate this possibility.
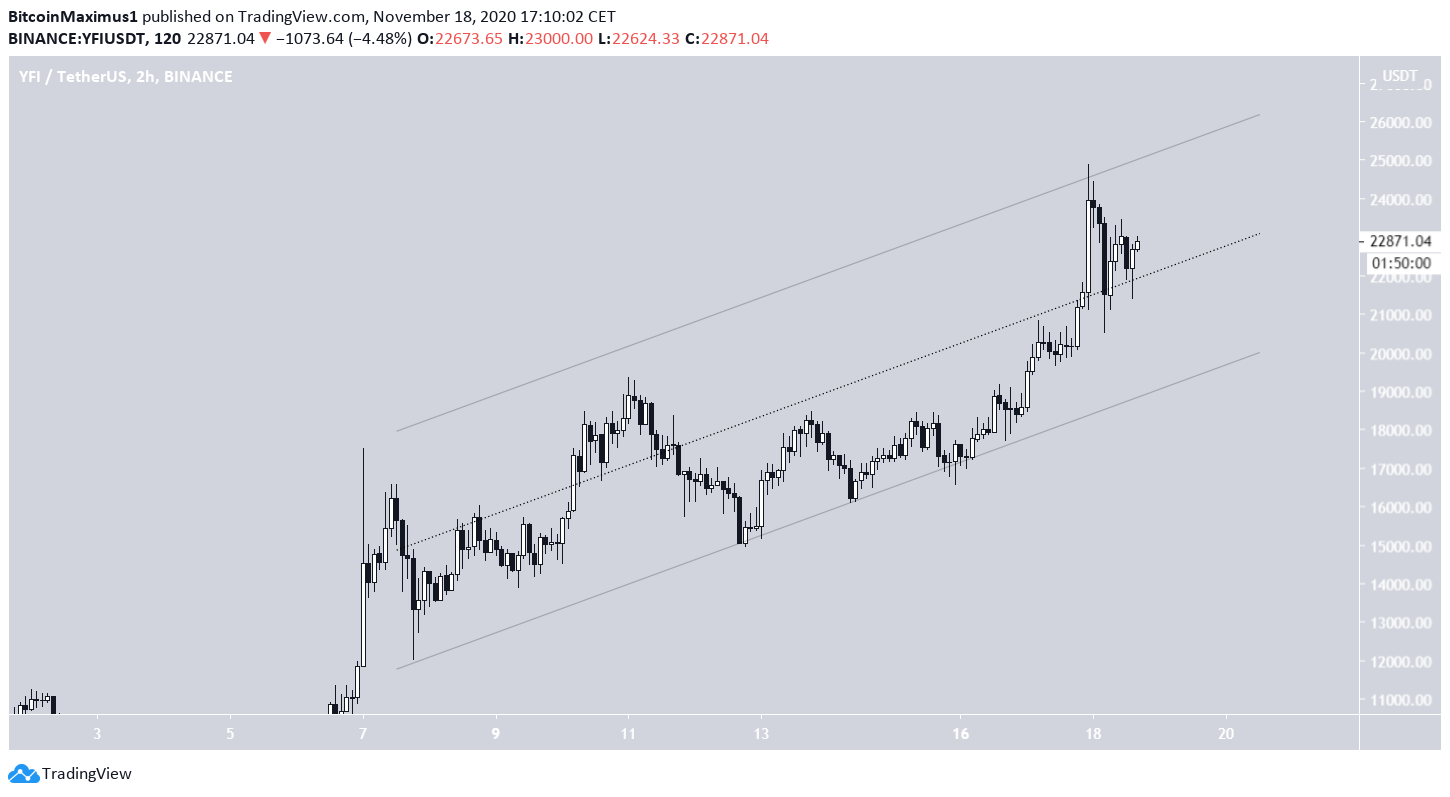
YFI Breakout
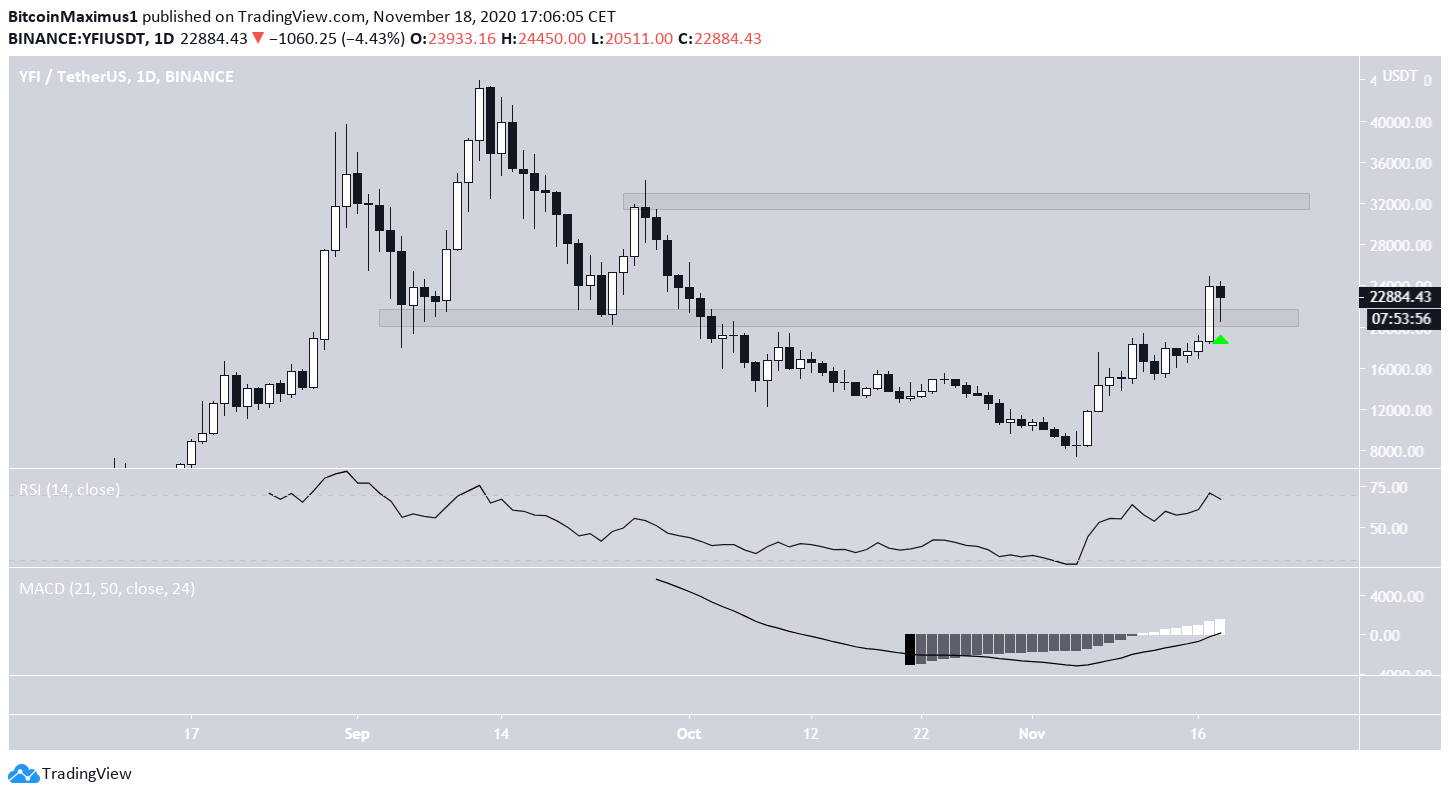
Even though both YFII and YFI have been increasing since Nov 5, the latter has already broken out above the main resistance area at $21,000 and is in the process of validating it as support.
If the price continues increasing, the next resistance area would be found at $26,000.
Technical indicators are bullish and support the possibility of this increase.
The shorter-term two-hour chart shows that the price is trading inside a parallel ascending channel. At the time of press, it was trading in the upper portion of the channel.
A breakout above the resistance line would likely take the price to $26,000, while a breakdown from the channel could mean that the rally has ended.
Conclusion
While the direction of the trend is not certain for either YFI or YFII, a break out/down from their current structures will likely play a big role in determining their trajectory.
For BeInCrypto’s latest Bitcoin analysis, click here!
Disclaimer: Cryptocurrency trading carries a high level of risk and may not be suitable for all investors. The views expressed in this article do not reflect those of BeInCrypto


