


Since June 15, the price of Verge (XVG) has witnessed a significant surge of almost 600%. This upward movement gained additional momentum on July 3, establishing a new yearly high.
Currently, the XVG price trades at a critical horizontal resistance level that holds importance in both the short and long term. The outcome of whether XVG breaks out from this level or faces rejection will play a vital role in shaping its future trend.
Verge Closes Consecutive Bullish Weeks
The weekly analysis of XVG’s technical indicators suggests a positive outlook for several reasons.
In early June, the XVG price appeared to break below the $0.0018 support level, which had been in place since May 2017. This breakdown was initially seen as a bearish signal that could trigger a significant price decline.
However, it turned out that the breakout was not genuine. The XVG price quickly reversed its direction (green circle) and formed a series of bullish weekly candlesticks. The candlesticks have been especially bullish for the last two weeks, causing a roughly 600% increase.
In early July, the XVG price broke out from a descending resistance line that had been in place for 784 days. This breakout, combined with a deviation from the previous pattern and a subsequent reclamation, confirmed the initiation of a bullish trend reversal for XVG.
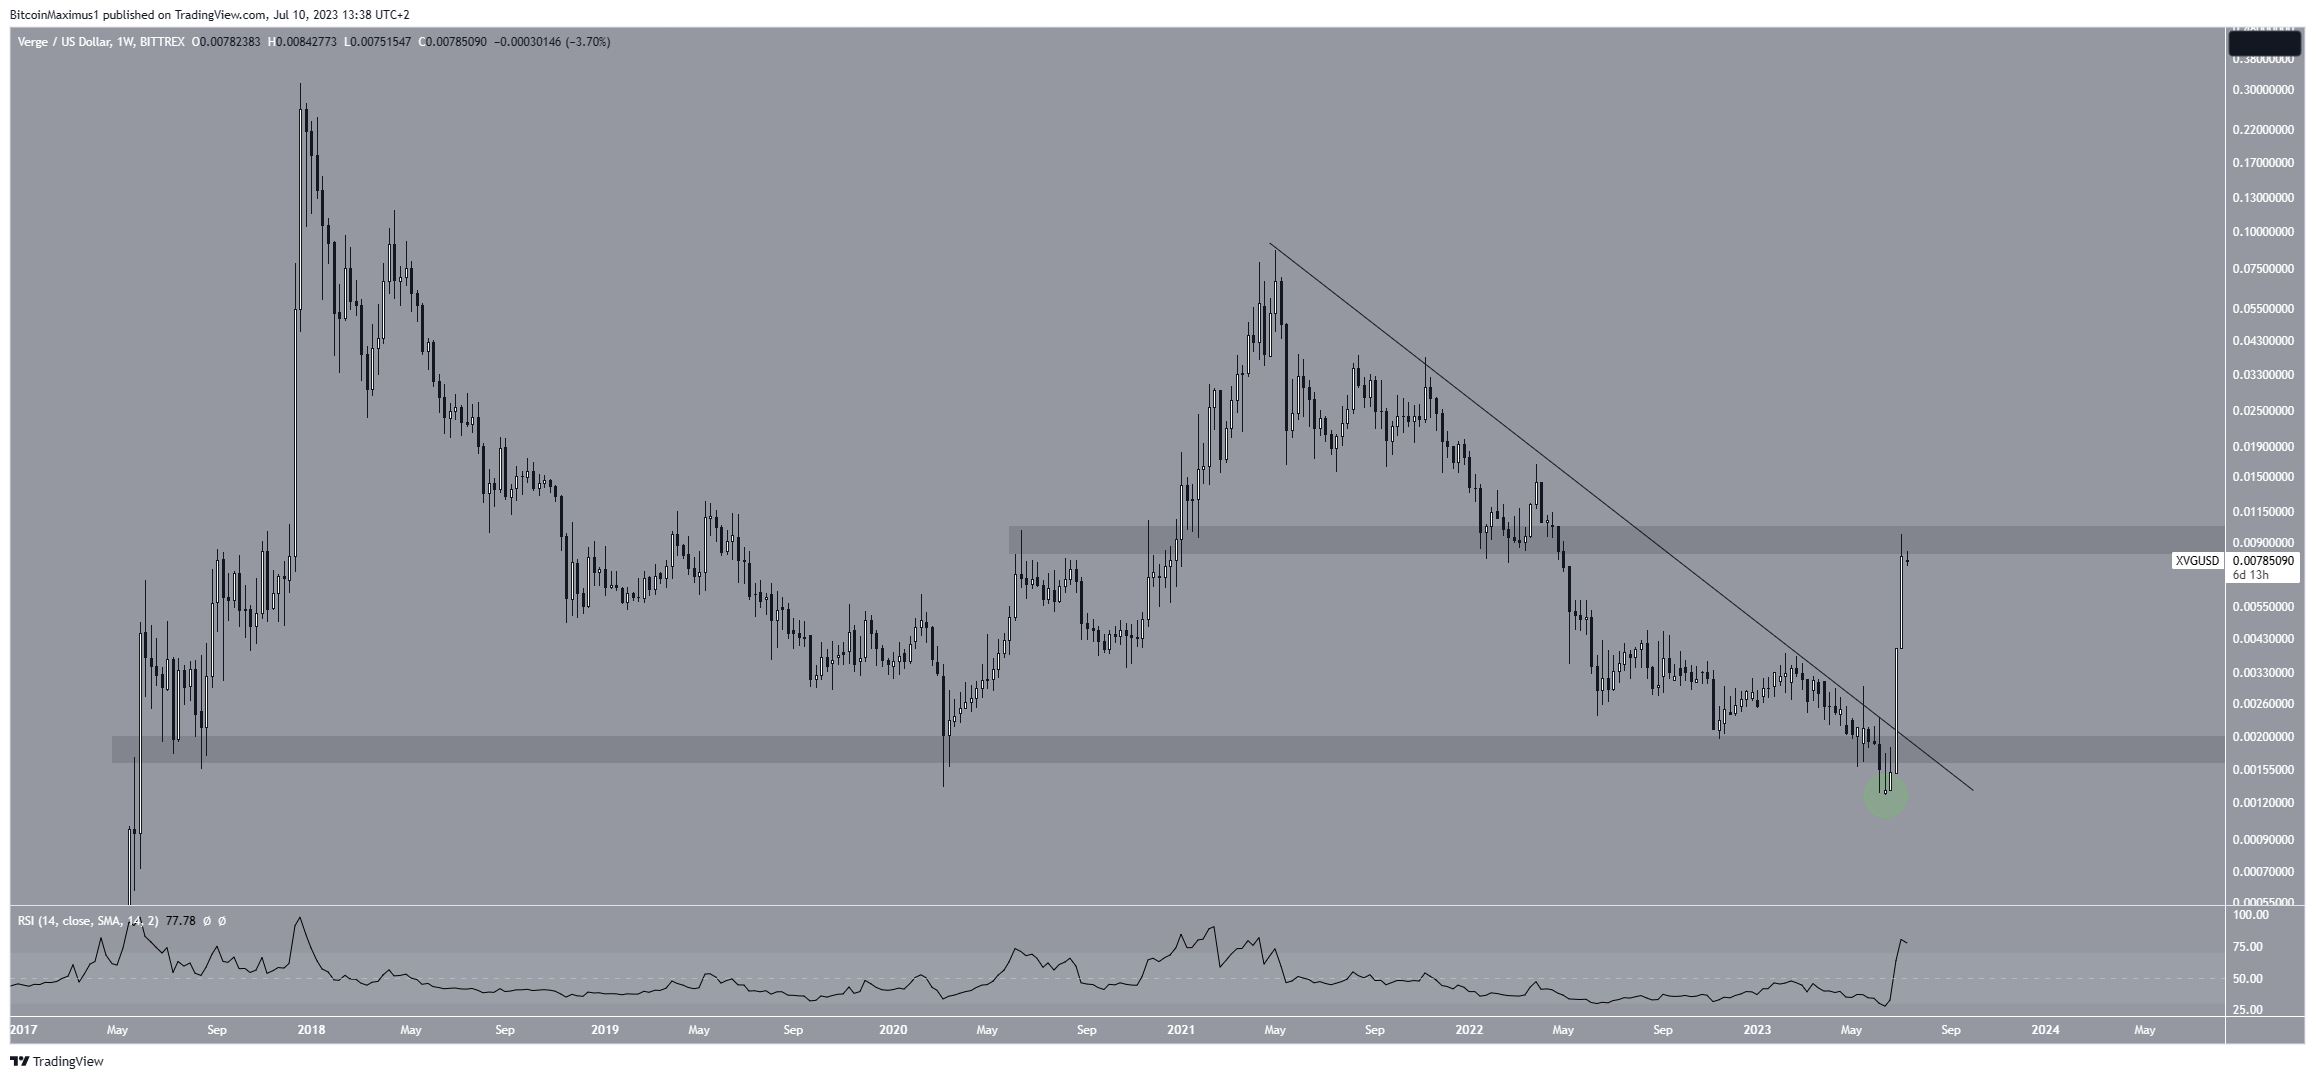
Additionally, the weekly Relative Strength Index (RSI) supports the ongoing upward movement. The RSI is a tool used by traders to assess whether a market is overbought or oversold. It is then used to determine whether to buy or sell an asset.
When the RSI reading is above 50 and trending upward, it suggests that the bulls maintain an advantage. On the other hand, readings below 50 indicate the opposite. Currently, the RSI for XVG is above 50 and shows an upward trend. This indicates a bullish market sentiment and signals a continuation of the price increase.
XVg Price Prediction: Will 600% Price Increase be Sustainable
A closer look at the daily timeframe shows that the XVG price has experienced a remarkable surge of nearly 600% since hitting its lowest point of the year on June 16. It outperformed the entire cryptocurrency market during this period, with a notable acceleration on July 2&3.
Currently, the XVG price is trading around the $0.0090 resistance level, which holds significance both in the short and long term. A breakout above this resistance could potentially lead to a tenfold increase, reaching approximately $0.0900.
However, it’s important to note that during its initial breakout attempts, the Verge price faced rejection, resulting in several long upper wicks (red icons). If this rejection persists at the $0.0046 level, XVG could decline toward the 0.618 Fibonacci retracement support level.
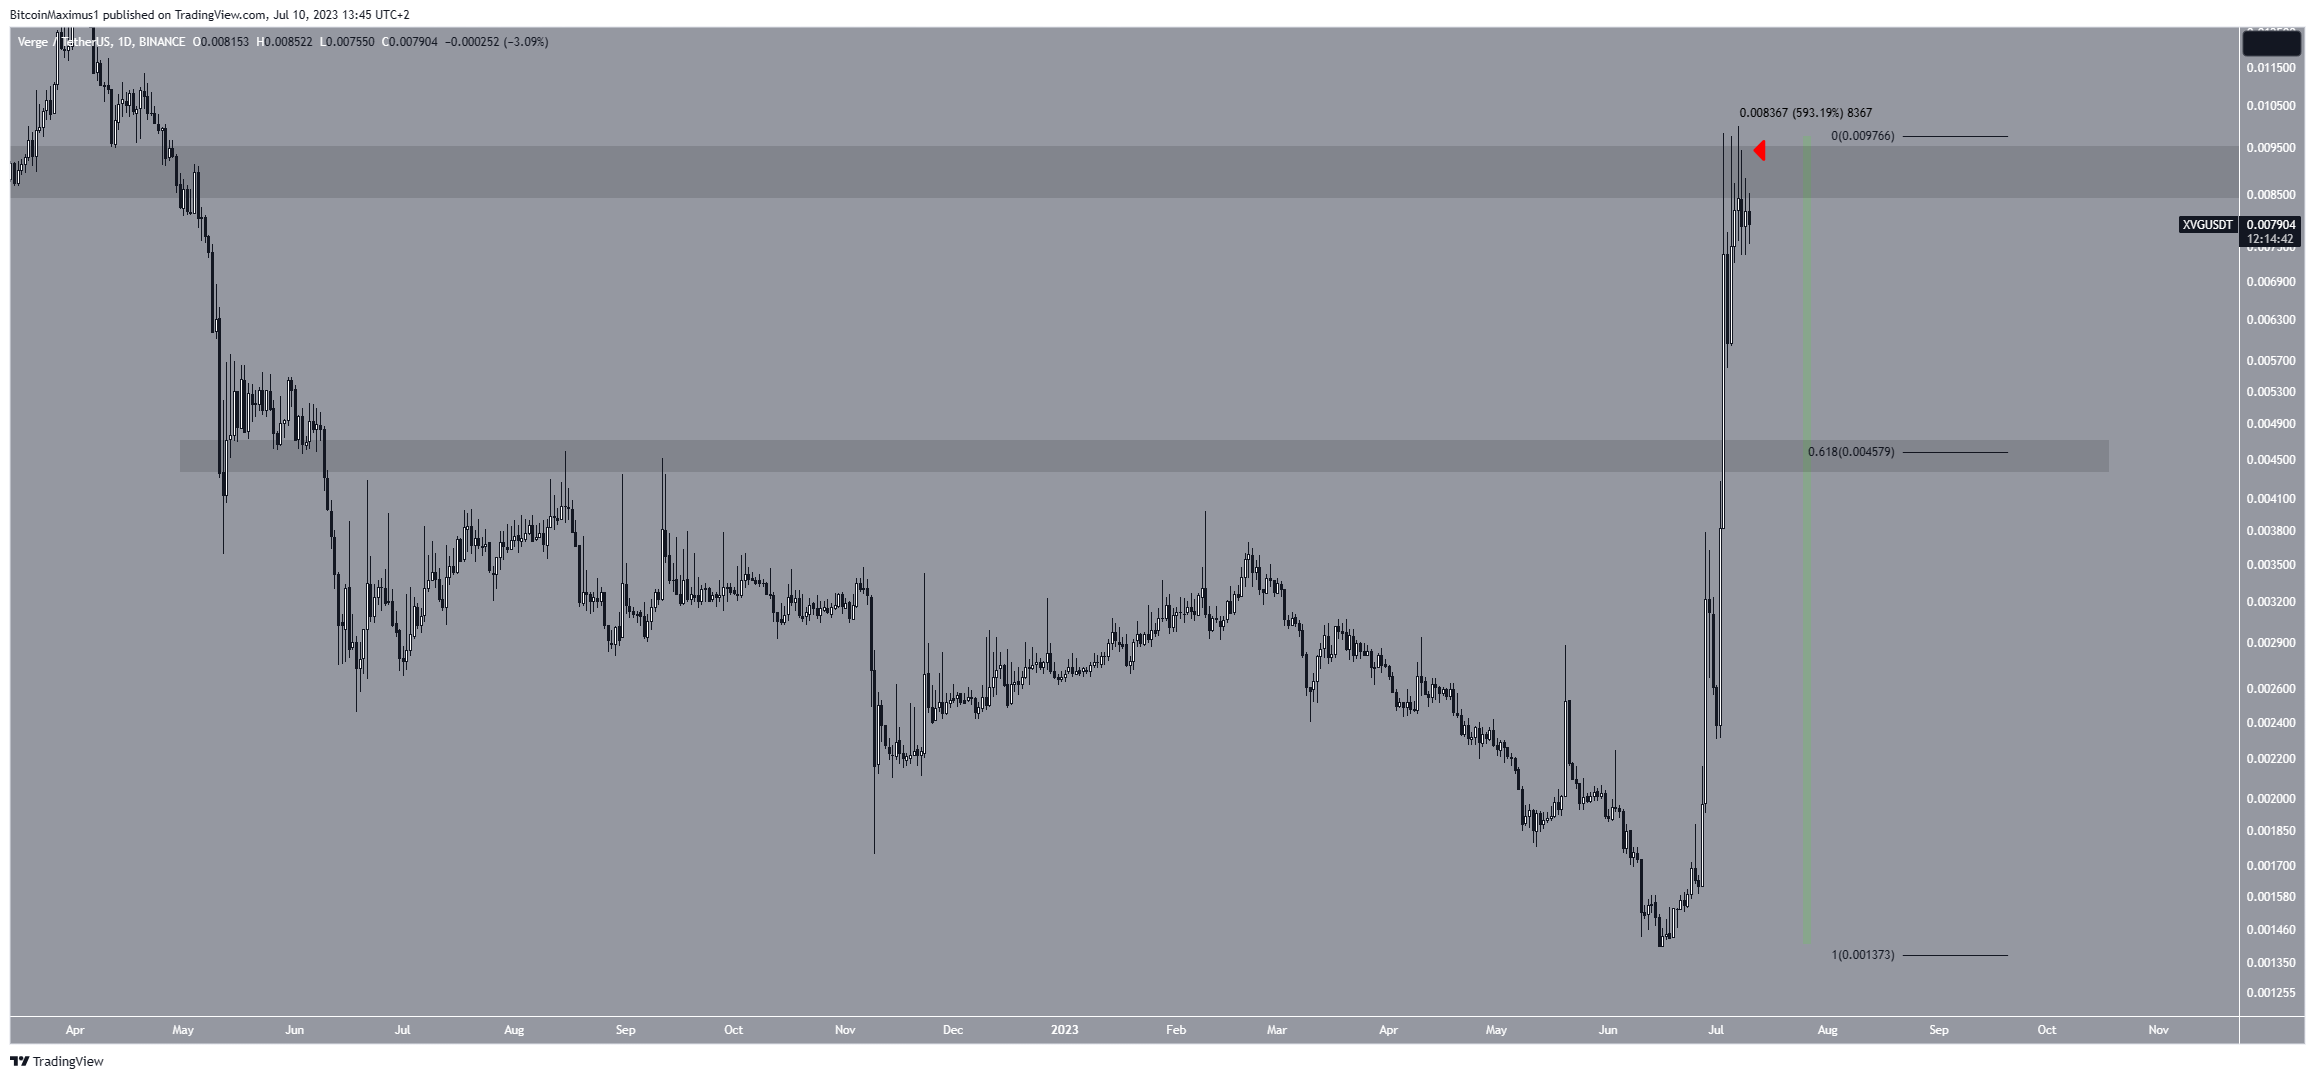
In conclusion, the future trend of XVG is still undetermined. It hinges on whether the price successfully breaks out above the $0.0090 level or faces continued rejection.
A breakout could trigger a substantial rally toward $0.0900, while a rejection may indicate a short-term retracement toward $0.0046.
For BeInCrypto’s latest crypto market analysis, click here


