
The Verge (XVG) price has been moving upwards with an accelerated pace, since the beginning of the year.
Despite a slight hiccup, XVG is expected to soon resume its upward movement towards the closest resistance area at $0.045.
Long-Term Levels
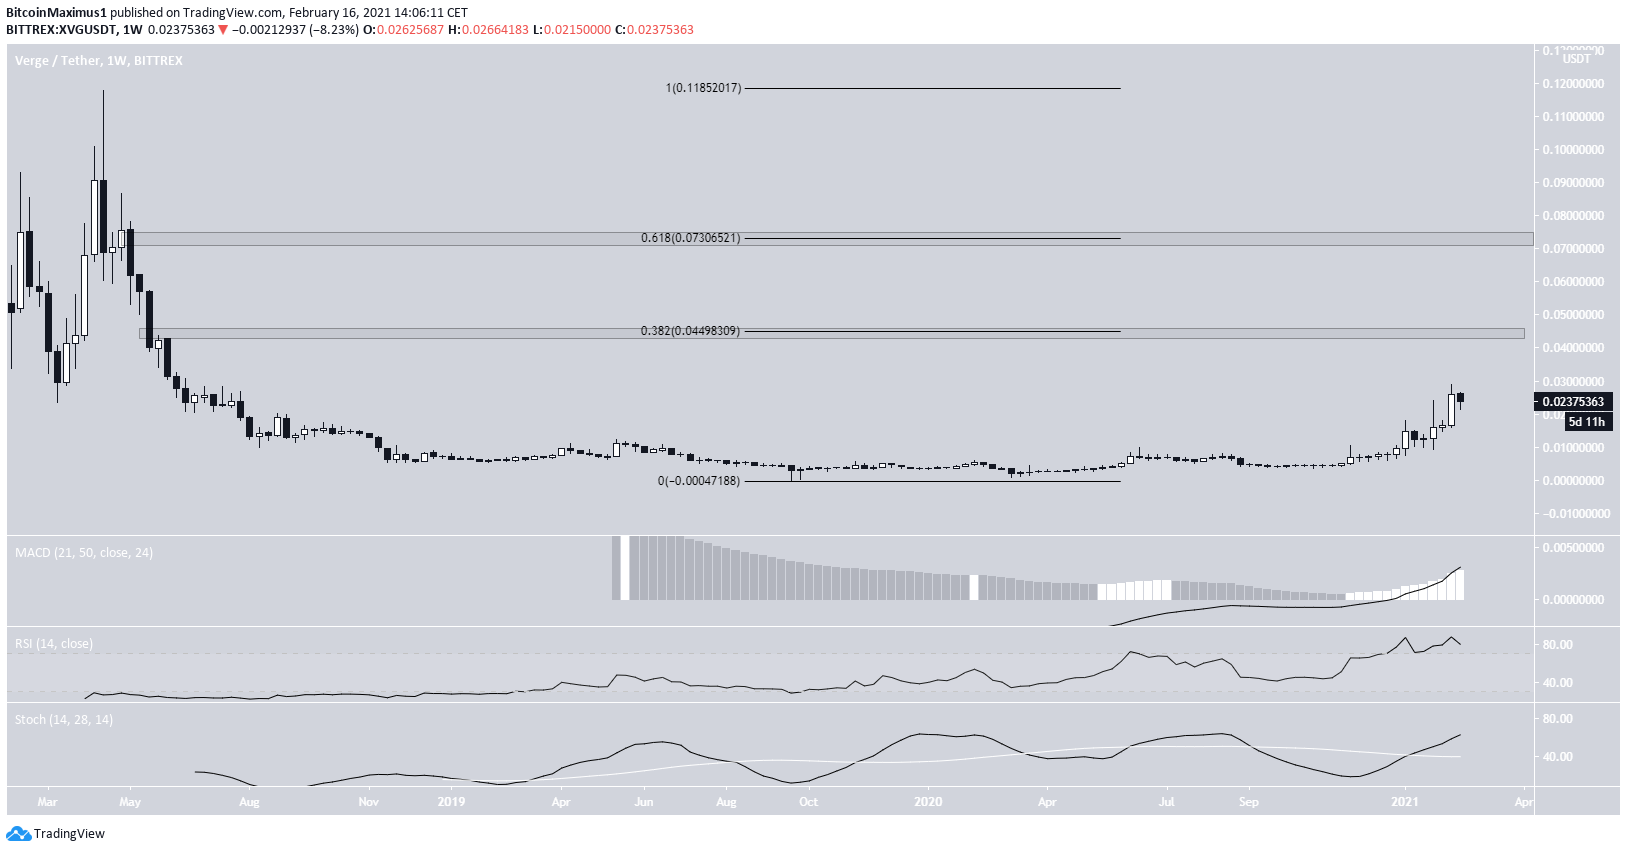
XVG increased considerably the past week, resuming the upward trend that has been in place, since the beginning of the year. XVG reached a high of $0.029 before decreasing slightly towards the current price at $0.023, as of press time.
Technical indicators are bullish, since all the three, RSI, MACD, and Stochastic Oscillator are increasing, and neither has generated bearish divergence. These readings support the continuation of the upward move.
If XVG continues increasing, the next closest resistance areas would be found at $0.045 and $0.073, respectively, the 0.382 & 0.618 Fib retracement levels when measuring the downward movement from the all-time high price of $0.118.
Current Movement of XVG
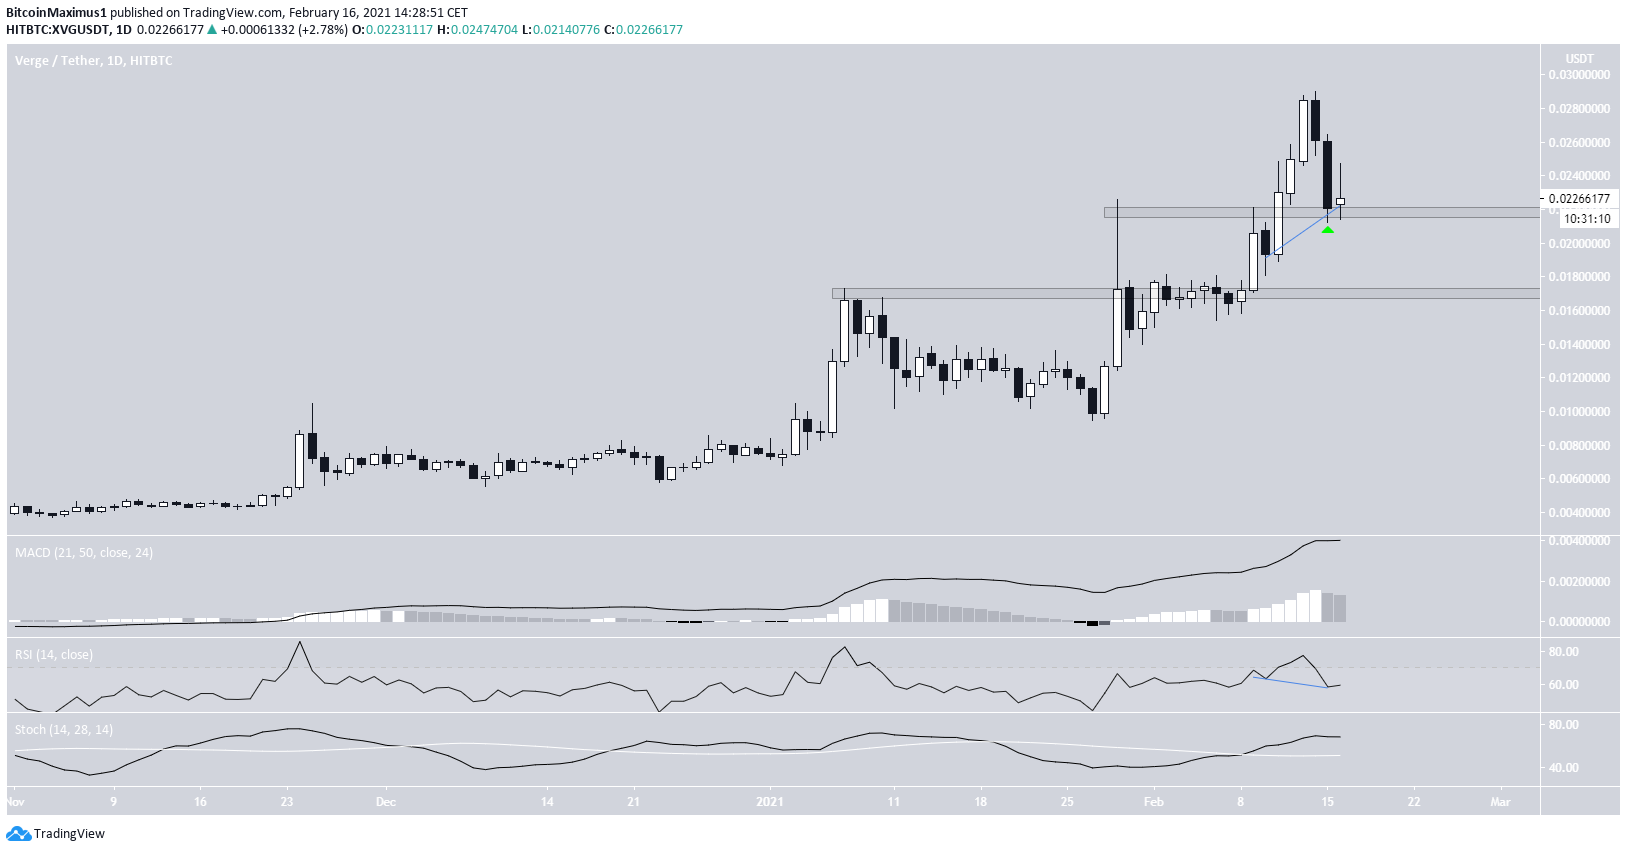
The daily chart provides two support areas, found at $0.021 and $0.017, respectively. XVG is currently trading just above the former, having purportedly validated it as support.
While the short-term movement is nearly parabolic, XVG could bounce at one of these levels and create some sort of a bullish structure.
Both the MACD & Stochastic Oscillator are increasing, and there is hidden bullish divergence present in the RSI, a sign that XVG is likely to continue higher.
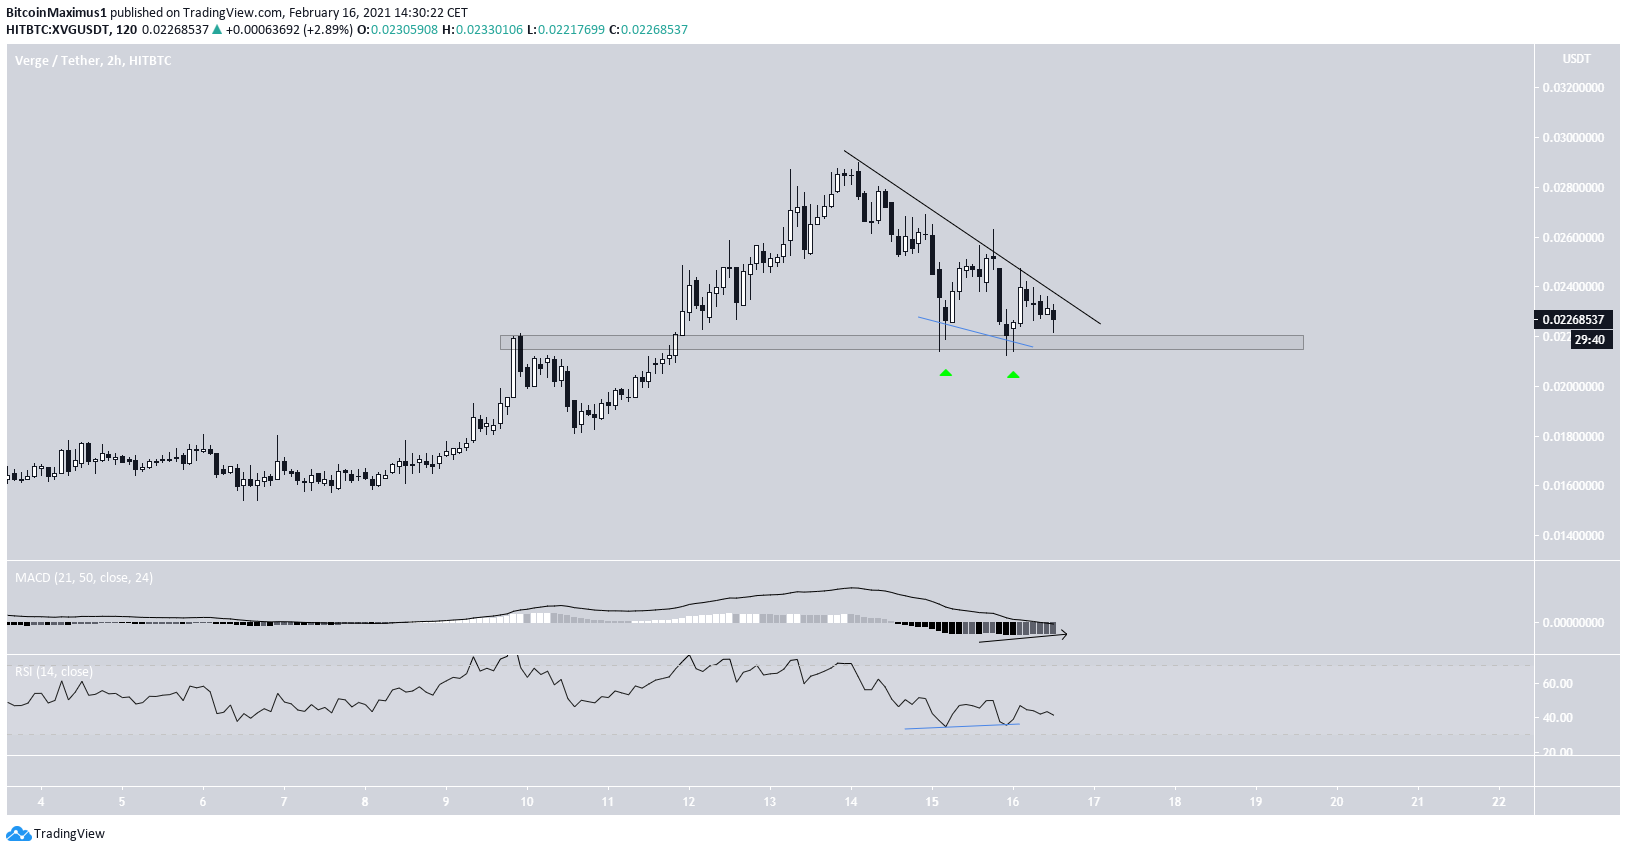
The shorter-term two-hour chart supports this possibility, since it shows two bounces at the minor $0.021 support area, which have also been combined with bullish divergence in the RSI.
Once XVG breaks out from the current short-term descending resistance line, the rate of increase would be expected to accelerate.
XVG/BTC
Cryptocurrency trader @DonWojak outlined a XVG/BTC chart, stating that due to a potential breakout from a very long-term descending resistance line, he is expecting the pair to move upwards.
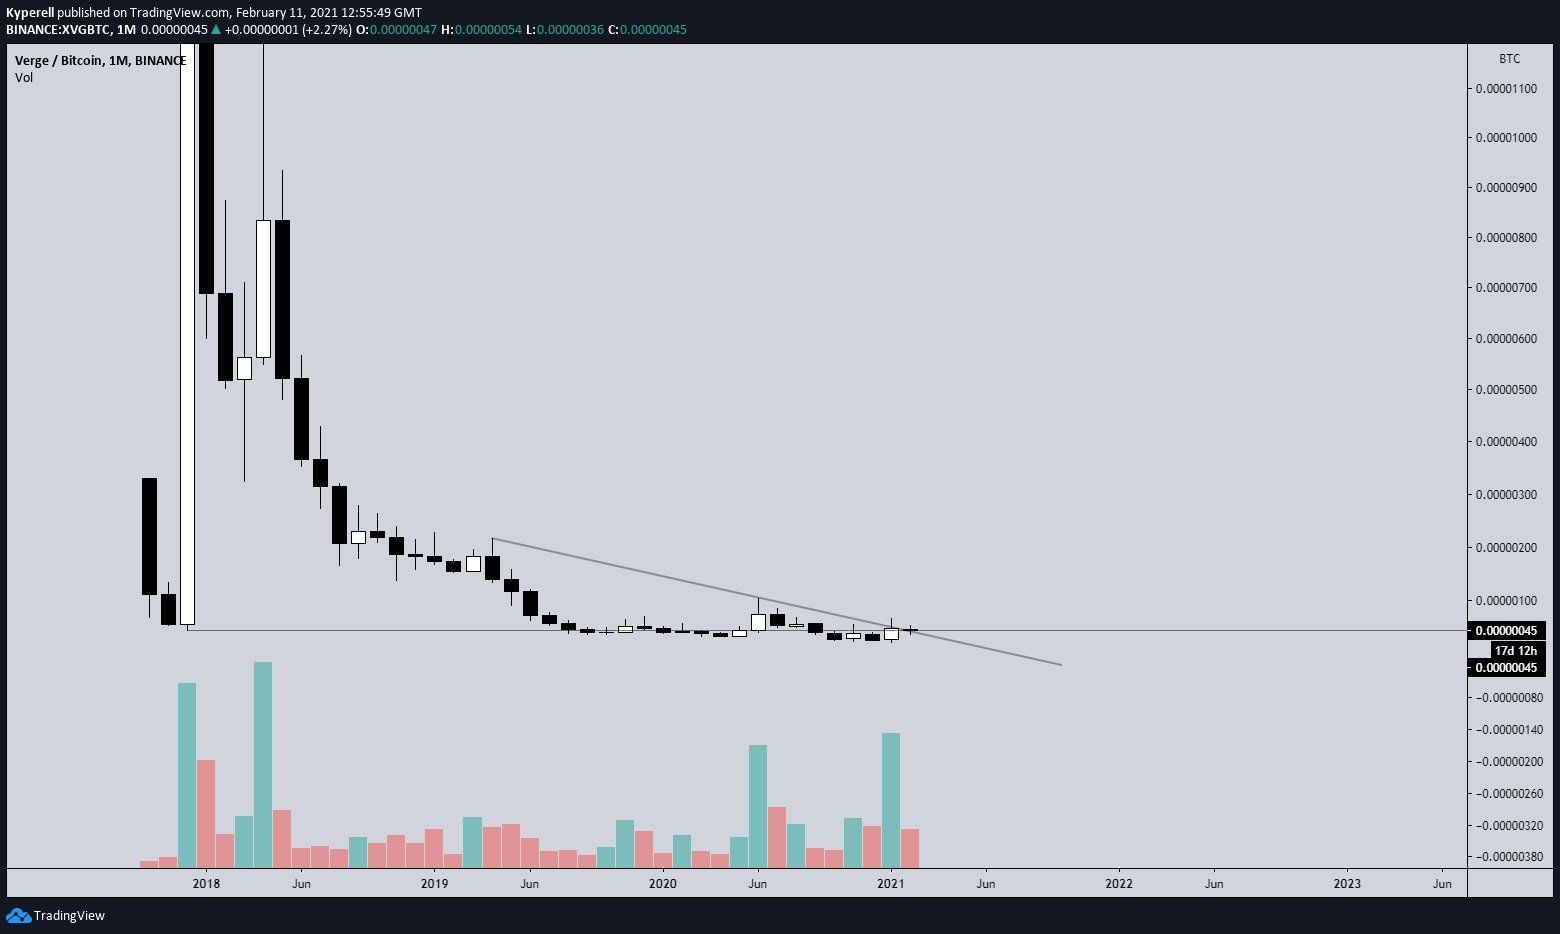
Since the tweet, XVG has moved above this resistance line, potentially validating it as support (green arrow).
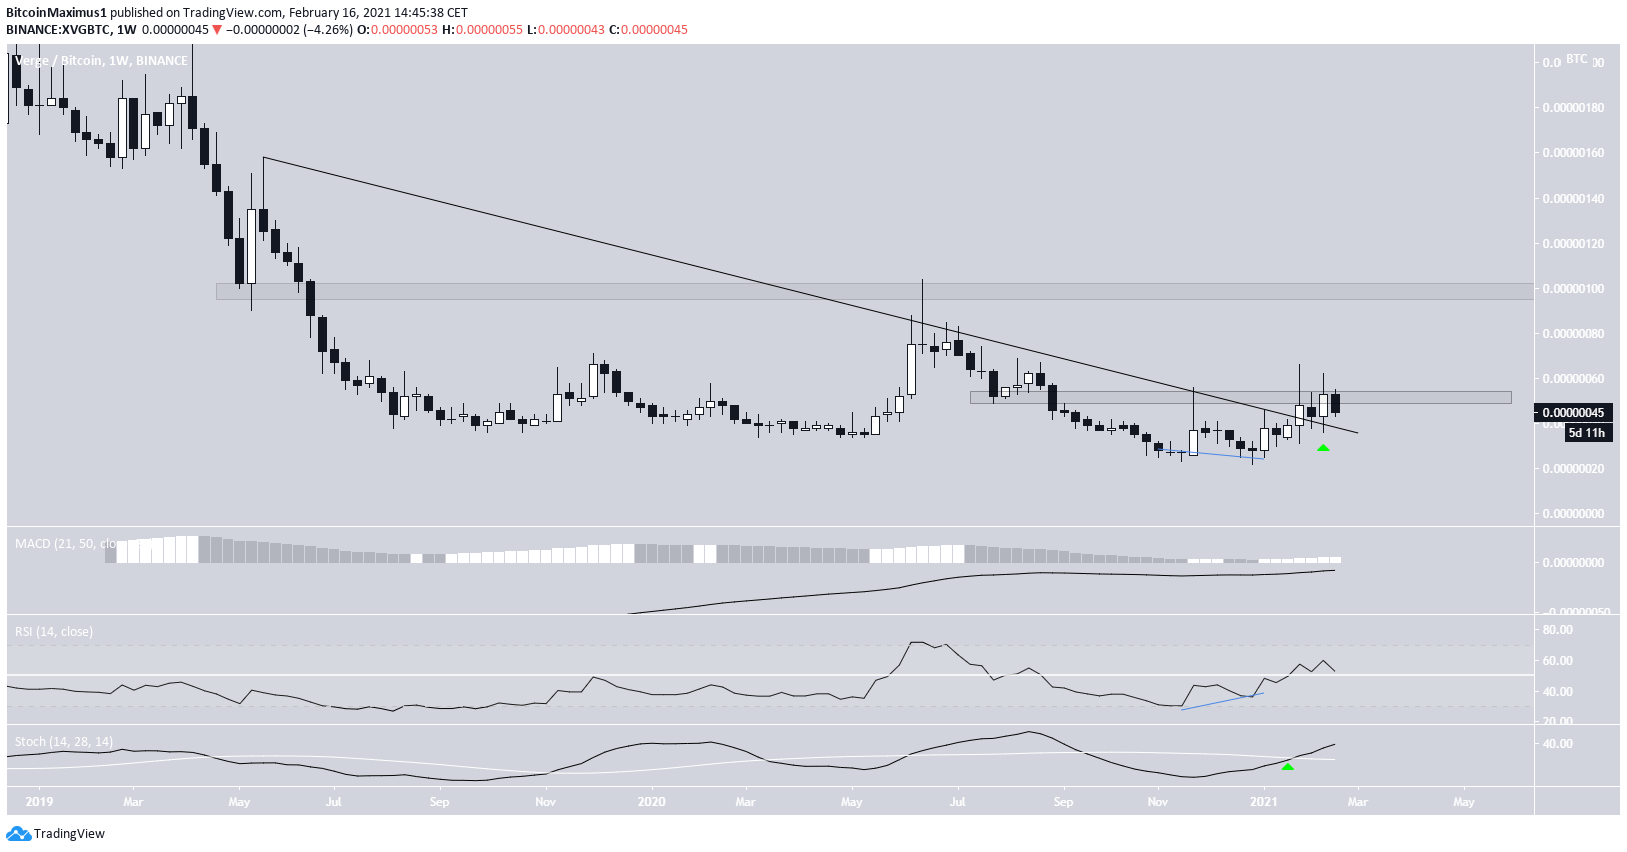
However, it has yet to move above the minor 51 satoshi resistance area, and has been struggling to do so, since September 2020.
However, the breakout from the descending resistance line was preceded by significant bullish divergence in the RSI, which has now moved above 50.
Furthermore, the Stochastic Oscillator has made a bullish cross and the MACD has nearly crossed into positive territory, both signs of an upward trend.
Therefore, XVG/BTC is expected to break out above the 51 satoshi resistance area and move towards 100 satoshis.
Conclusion
To conclude, XVG/USD is expected to find support at one of the two minor support areas and resume its upward movement afterwards.
The pronounced bullish divergence in XVG/BTC combined with the breakout from the current descending resistance line indicate that an upward movement towards 100 satoshis is expected.
For BeInCrypto’s latest Bitcoin (BTC) analysis, click here
Trusted
Disclaimer
In line with the Trust Project guidelines, this price analysis article is for informational purposes only and should not be considered financial or investment advice. BeInCrypto is committed to accurate, unbiased reporting, but market conditions are subject to change without notice. Always conduct your own research and consult with a professional before making any financial decisions. Please note that our Terms and Conditions, Privacy Policy, and Disclaimers have been updated.
