


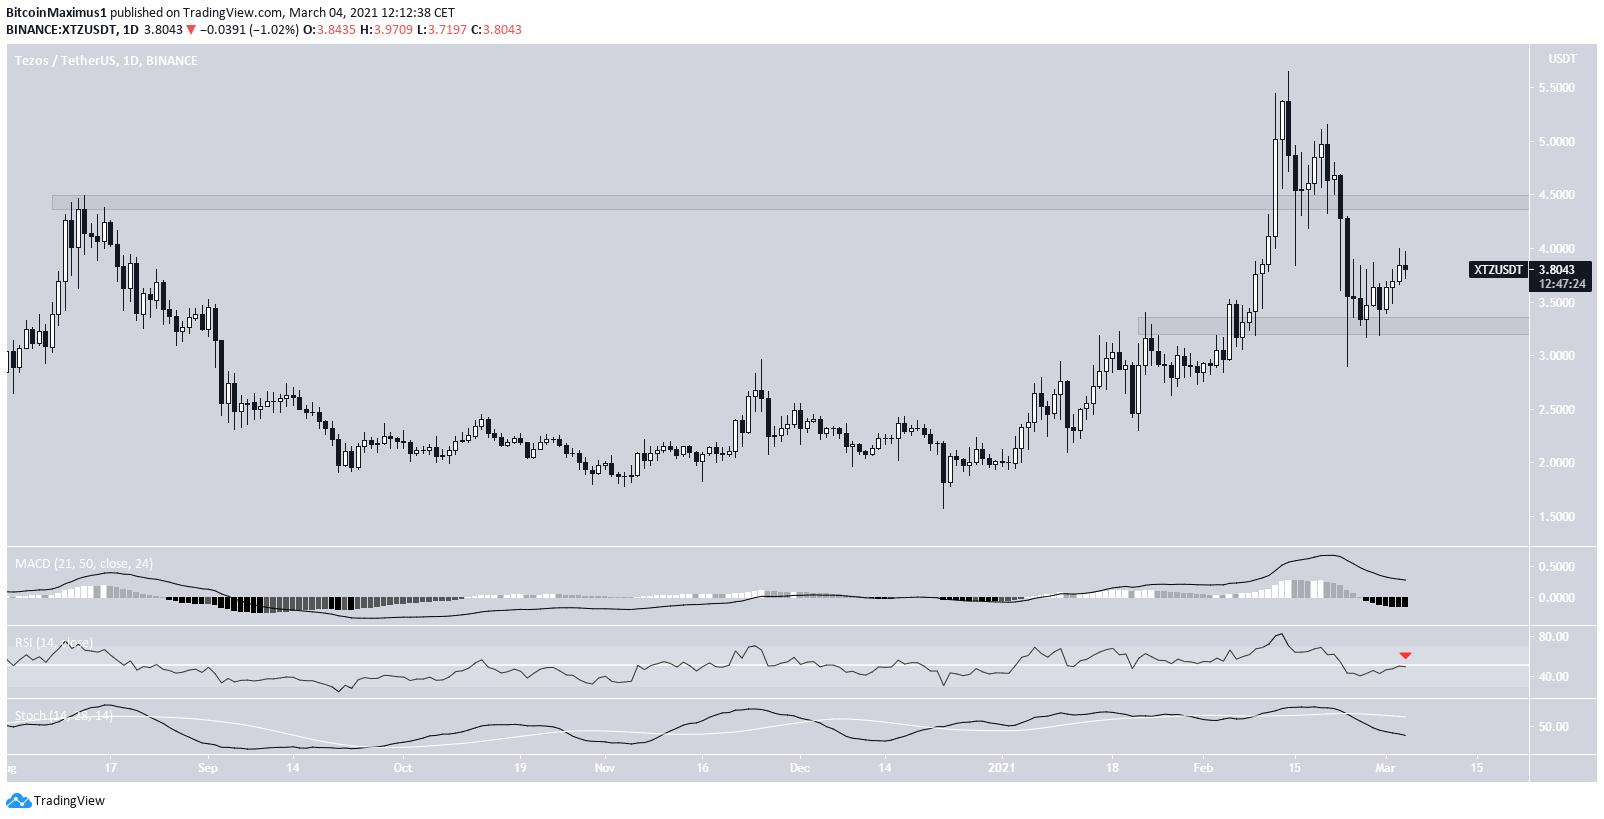
The Tezos (XTZ) price has bounced above a support area at $3.30 but is still trading in a range.
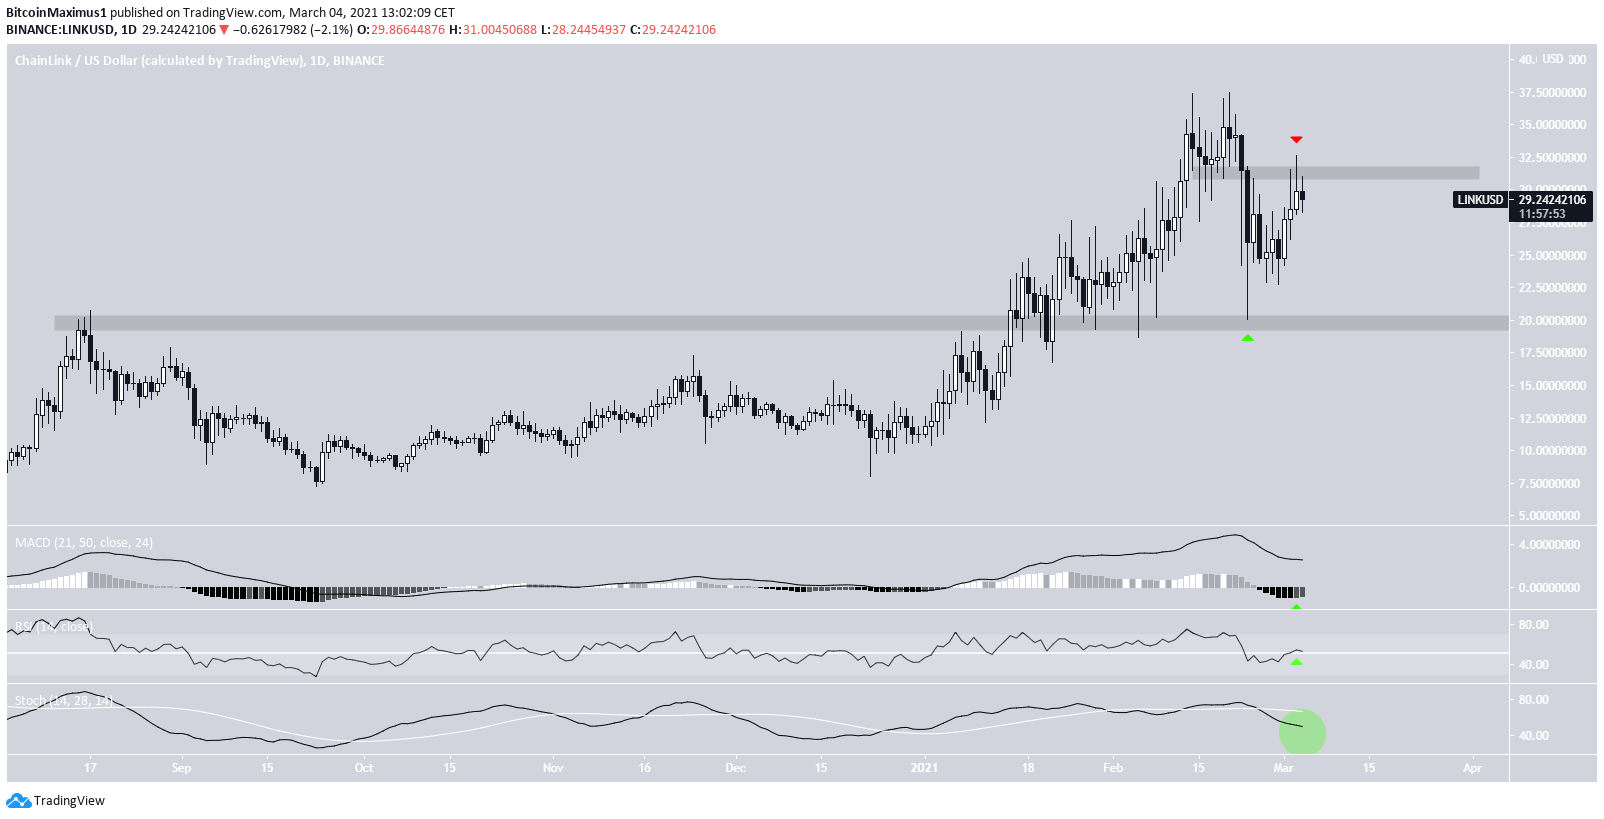
Similarly, Chainlink (LINK) has been trading in a range between $20 – $31.50 since bouncing at the support area on Feb. 23
On the other hand, a technical analysis of Dock (DOCK) shows a bounce at the previous all-time high resistance are and suggests that the price will move higher as a result.
Tezos (XTZ)
XTZ has been decreasing since reaching an all-time high price of $5.64 on Feb. 14. The decrease took it to a low of $2.90 on Feb. 23.
However, XTZ bounced almost immediately afterwards, and has validated the $3.30 as as support.
However, technical indicators are still neutral/bearish, failing to confirm that the bounce will continue.
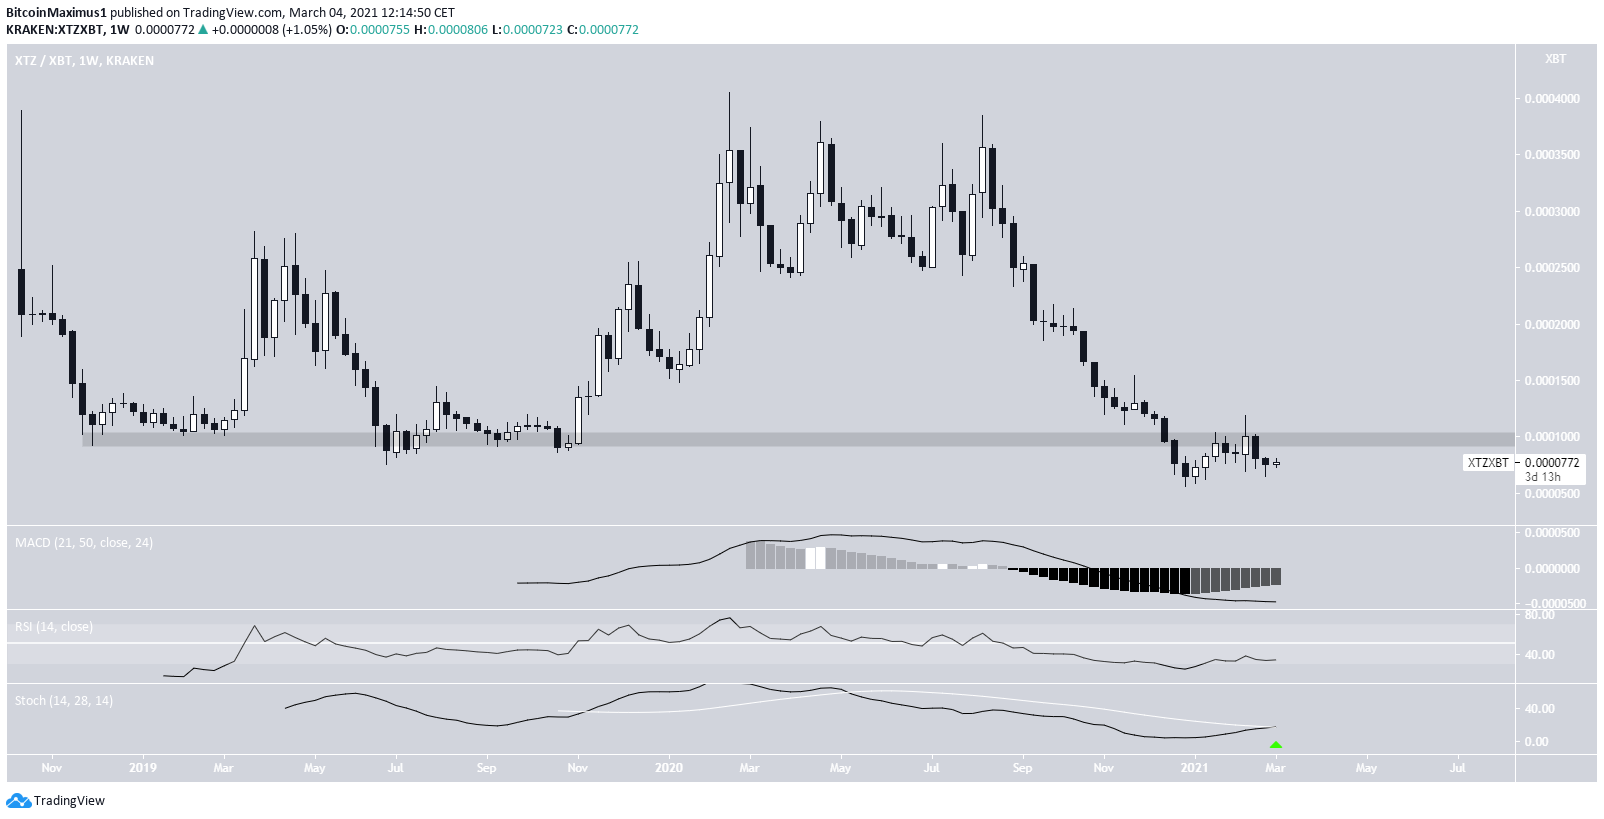
Similarly, the XTZ/BTC chart provides mixed signs.
On one hand, XTZ has been increasing since reaching an all-time low price of 563 satoshis on Dec. 25, 2020. Furthermore, the Stochastic oscillator has made a bullish cross and the MACD is increasing.
However, XTZ has yet to reclaim the 1000 satoshi area, which is the previous breakdown level.
Until it does, we cannot consider the trend bullish.
Highlights
- XTZ/USD is trading between support and resistance at $3.30 and $4.45, respectively
- XTZ/BTC is trading below the 1000 satoshi resistance area.
Chainlink (LINK)
LINK has been moving downwards since reaching a high of $37.38 on Feb. 14.
The ensuing drop took like to the previous all-time high resistance of $20. Afterwards, LINK initiated a strong bounce, leaving a long lower wick in its wake.
Technical indicators are gradually turning bullish, as evidenced by the MACD reversal and the RSI cross above 50.
However, LINK has yet to reclaim the $31.50 resistance area. If it were to do that, alongside a bullish cross in the Stochastic oscillator, it would confirm that the trend is bullish.
In that case, we would expect LINK to reach a new all-time high price.
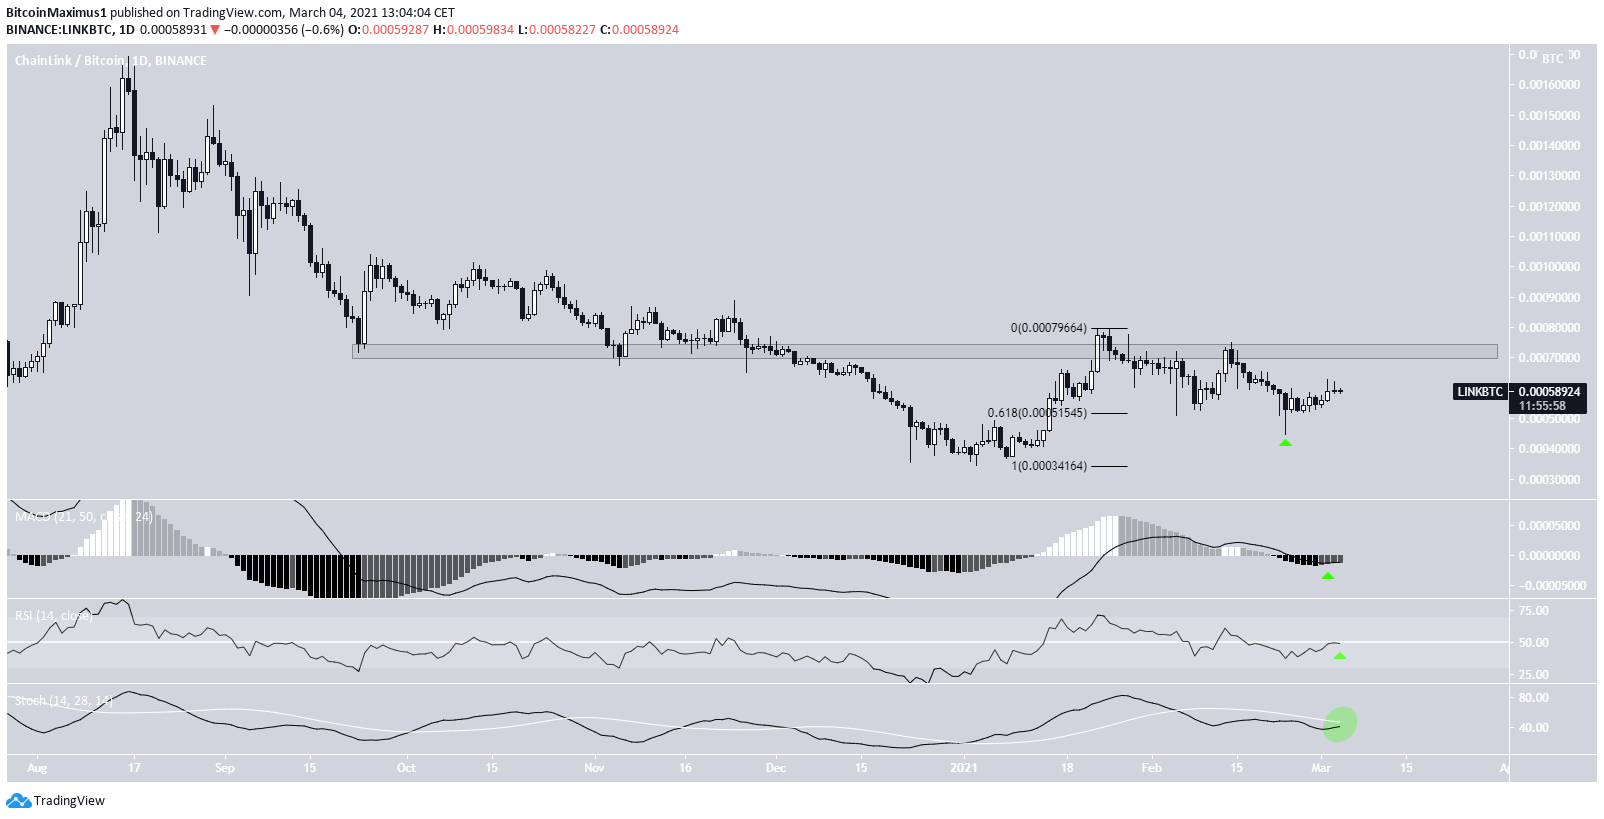
The LINK/BTC chart shows a strong bounce at the 0.618 Fib retracement level. Similar to the USD counterpart, this left a long lower wick in place.
While technical indicators are gradually turning bullish, a reclaim of the 73,000 satoshi resistance area is required in order for the bullish trend to be confirmed.
Highlights
- LINK/USD is trading in a range between $20 & $31.50.
- LINK/BTC is trading below the 73,000 satoshi resistance area.
Dock (DOCK)
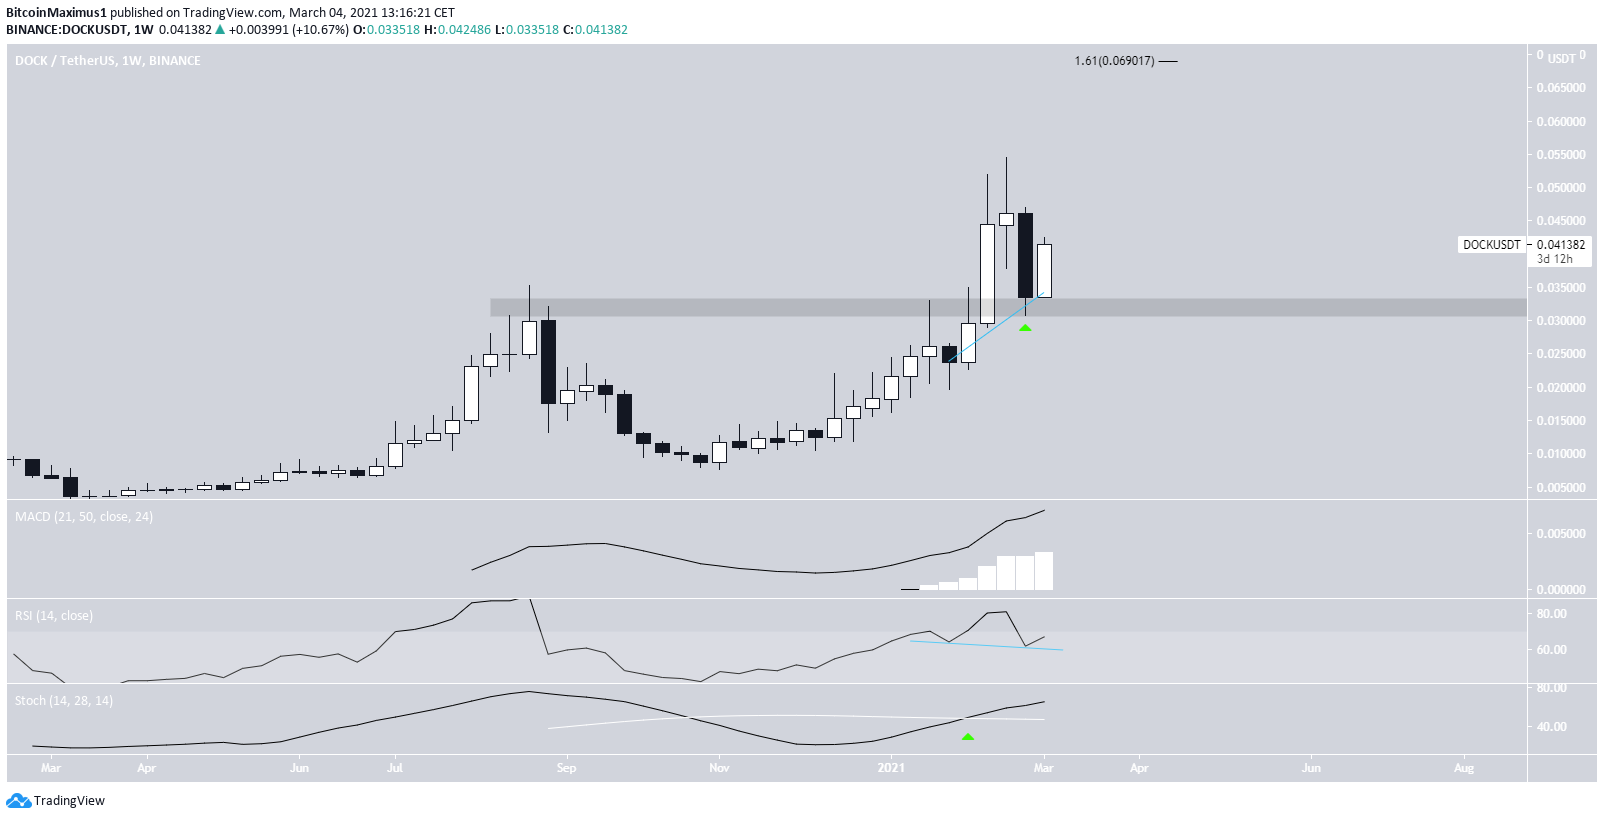
DOCK has been decreasing since reaching an all-time high price of $0.054 on Feb. 16. Since then, it has dropped to a low of $0.03 and bounced.
Technical indicators are bullish, thus supporting the continuation of the upward movement.
The Stochastic oscillator has made a bullish cross and the MACD is increasing. Furthermore, the RSI has generated hidden bullish divergence.
If DOCK continues the bounce, the next closest resistance area would be found at $0.069.
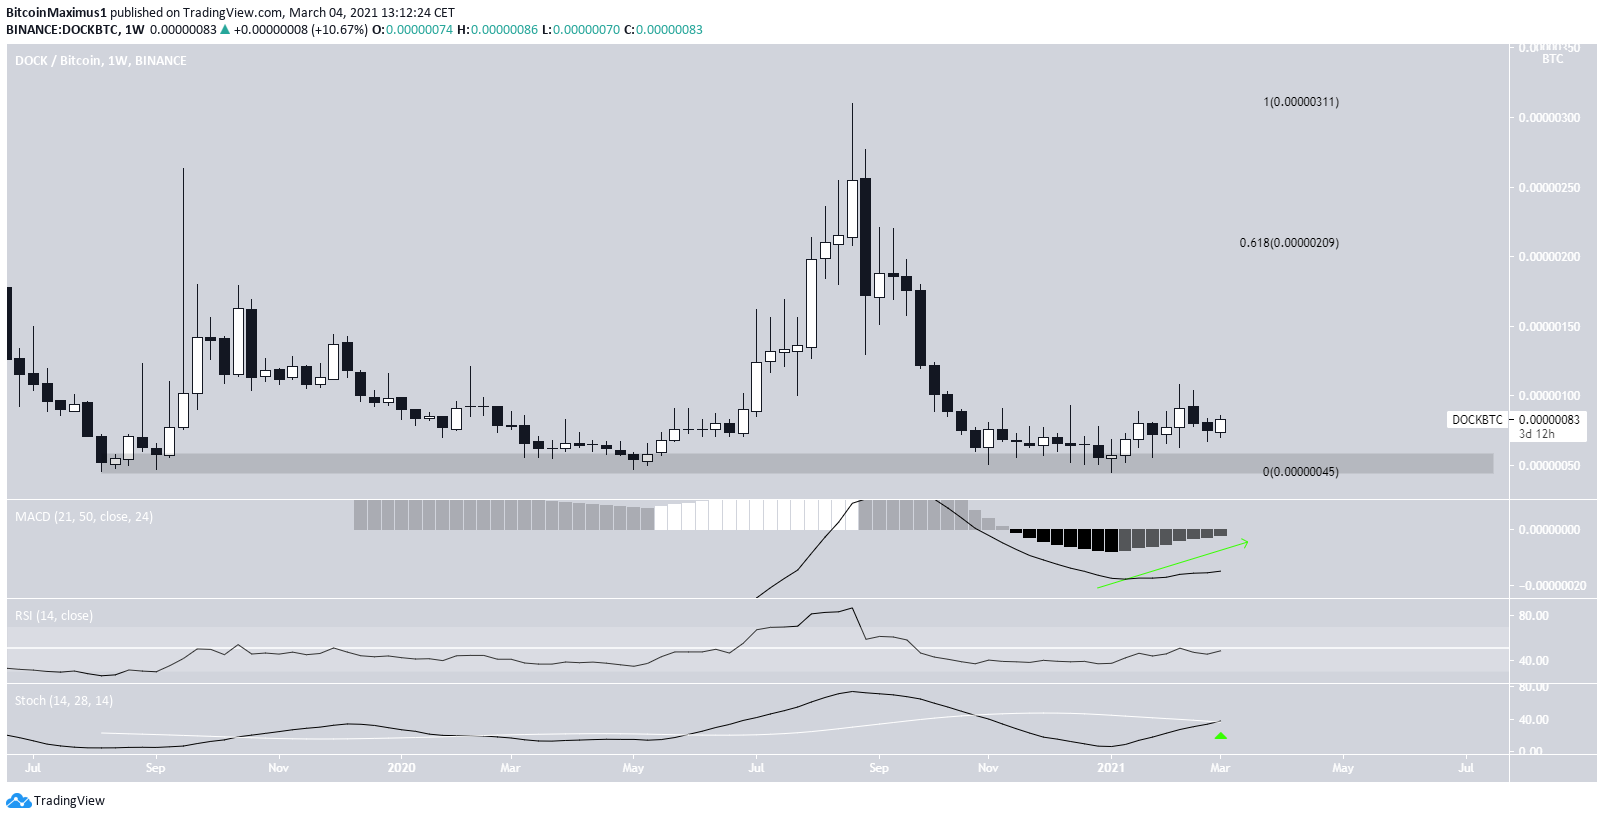
The weekly chart for DOCK/BTC shows a bounce at the 50 satoshi support area.
The MACD is increasing and the Stochastic oscillator has made a bullish cross, suggesting that DOCK is likely to move upwards.
Therefore, DOCK/BTC is expected to resume its bounce towards the 210 satoshi resistance area.
Highlights
- DOCK/USD has bounced at the $0.032 support area.
- DOCK/BTC has bounced at the 50 satoshi support area.
For BeInCrypto’s latest Bitcoin (BTC) analysis, click here.


