See More

Will Surprise Gains Push XRP Above $0.35/€0.3? (XRP/USD & XRP/EUR Price Prediction for 04/19/19)

3 mins
Updated by Alexander Fred
Join our Trading Community on Telegram
At BeInCrypto, we publish regular price analyses and predictions for XRP. In our Apr 17 analysis of XRP/USD, we predicted that XRP—still known widely as Ripple— would experience slight decreases. Our prediction was invalidated the next day when the price broke out from the pattern we defined. In this analysis, we take a look at Ripple’s price in both euros and dollars to predict possible price fluctuations in XRP/USD($) and XRP/EUR(€).
On Apr 3, 2019, XRP reached a high close to $0.386 and €0.338. A rapid drop ensued, and the price reached lows close to $0.313 and €0.278 on Apr 15.

XRP Market Outlook
XRP/USD and XRP/EUR Prices: Apr 2 – Apr 19
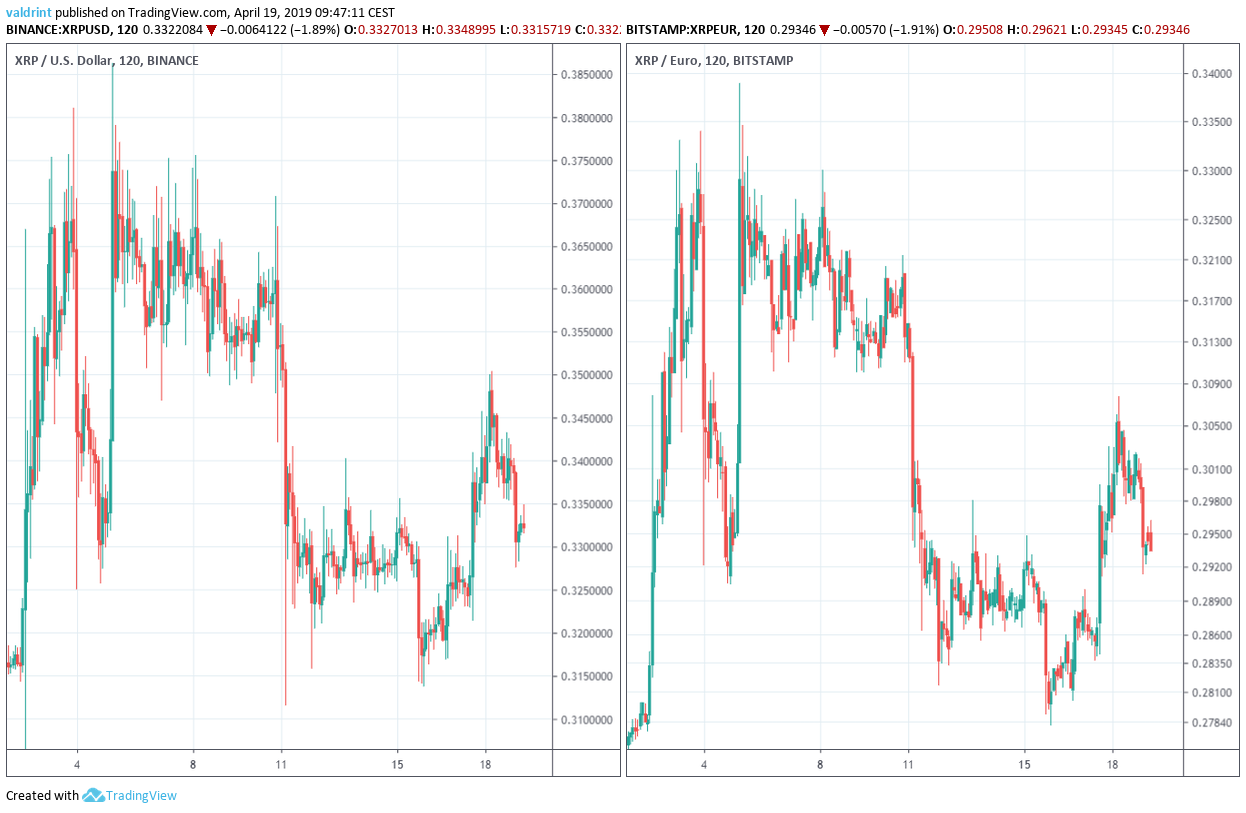
At the time of writing, the price is trading slightly above $0.33 and €0.295. Will the price of XRP continue to increase or is a drop in store? Let’s find out:

XRP (XRP): Highlights and Trends For April 19, 2019

  • The price of XRP has been on a downtrend since Apr 10.
  • It is trading inside a descending channel.
  • An evening doji star was created by the Apr 18 daily candle.
  • XRP is trending along a long-term support line.
  • There is resistance near $0.35/€0.3 and support near $0.30/€0.265.

Descending Channel

The price of XRP/USD on Binance is analyzed at two-hour intervals from Apr 4 to Apr 19 to help determine current trading patterns. We do not include euros in this section because only one trading pair is needed to generate the current trading pattern. Both XRP/USD and XRP/EUR are discussed in the final two sections.
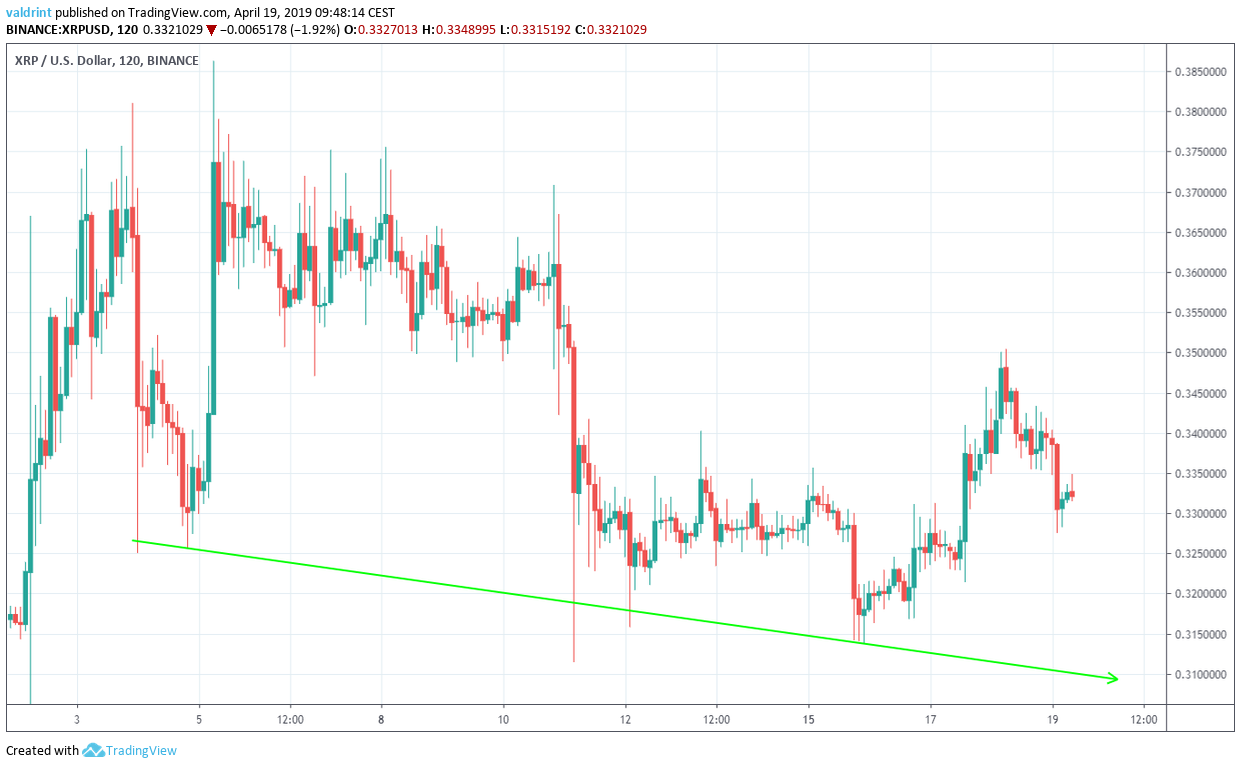
On Apr 4, the price reached a  low of $0.325. Several market cycles were subsequently completed. The price has created lower lows each time. Tracing these lows gives us a descending support line: XRP Descending Support 
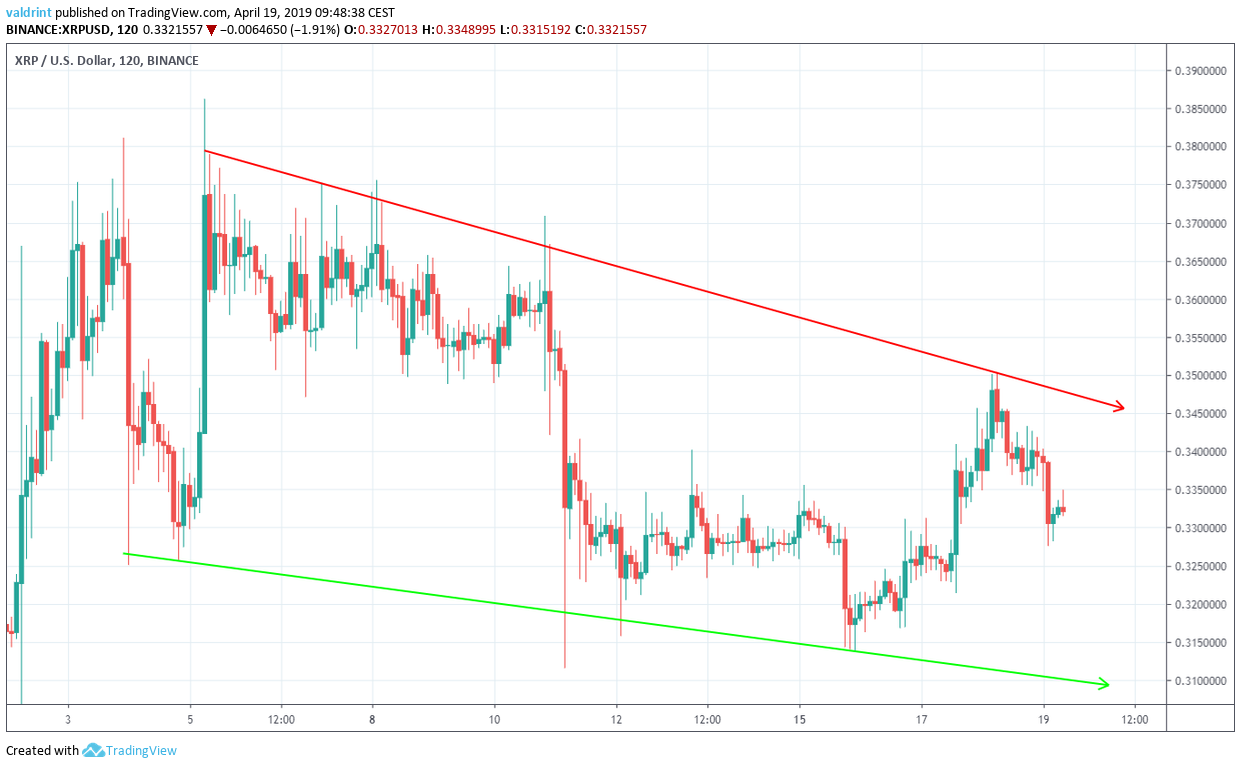
On Apr 5, the price reached a high of $0.386. At the time of writing, several lower highs had been reached. A descending resistance line is created by tracing these highs. Taken together, the resistance and support lines combine to create a descending channel: XRP Descending Channel The trading pattern alone cannot determine if a breakout will occur. To assess this possibility, we need to take a look at daily candlestick patterns.

Evening Doji Star

To better determine possible future price fluctuations, we take a look at the candlestick for Apr 3. At the close of the day, the price formed a bearish evening star.
An evening doji star is interpreted as a type of reversal candlestick pattern preceding a falling price. It is made up of three candles: a large green candlestick, a small-bodied candle with an upper wick, and a red candle. It is found in an uptrend.
The evening doji star candlestick for Apr 18 is seen in the graph below:
Candlestick XRP
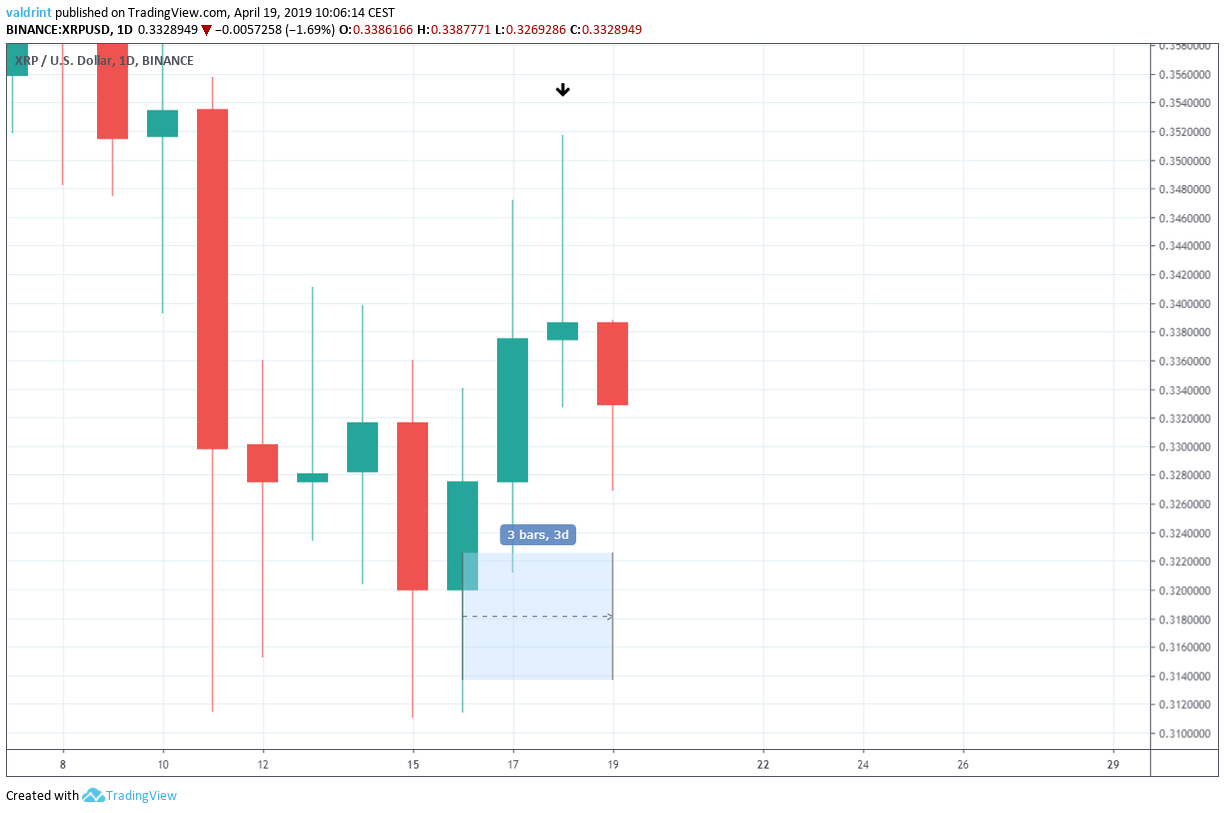
The price began an uptrend on Apr 16. Two bullish daily candles were created. The Apr 18 candle had a very long upper wick. This indicates that buyers drove prices up during the day, but they encountered selling pressure that drove prices back down. Since this is occurring in an uptrend, the selling pressure is viewed as a potential reversal sign. Based on the creation of this pattern, we believe the price will continue to decrease.

Reversal Areas

To determine the actual possible future price levels given an increase, price is analyzed on one-day intervals from December 2018 to April 2019. Resistance areas are incorporated for assistance.
Resistance and support areas are created when the price visits the same level several times. They can act as an area of reversal in case a breakdown or a breakout occurs.
One resistance area is traced below for both XRP/USD and XRP/EUR in the graphs below:
Reversal Areas
XRP/EUR Resistance Areas
Resistance Areas
XRP/USD Resistance Areas
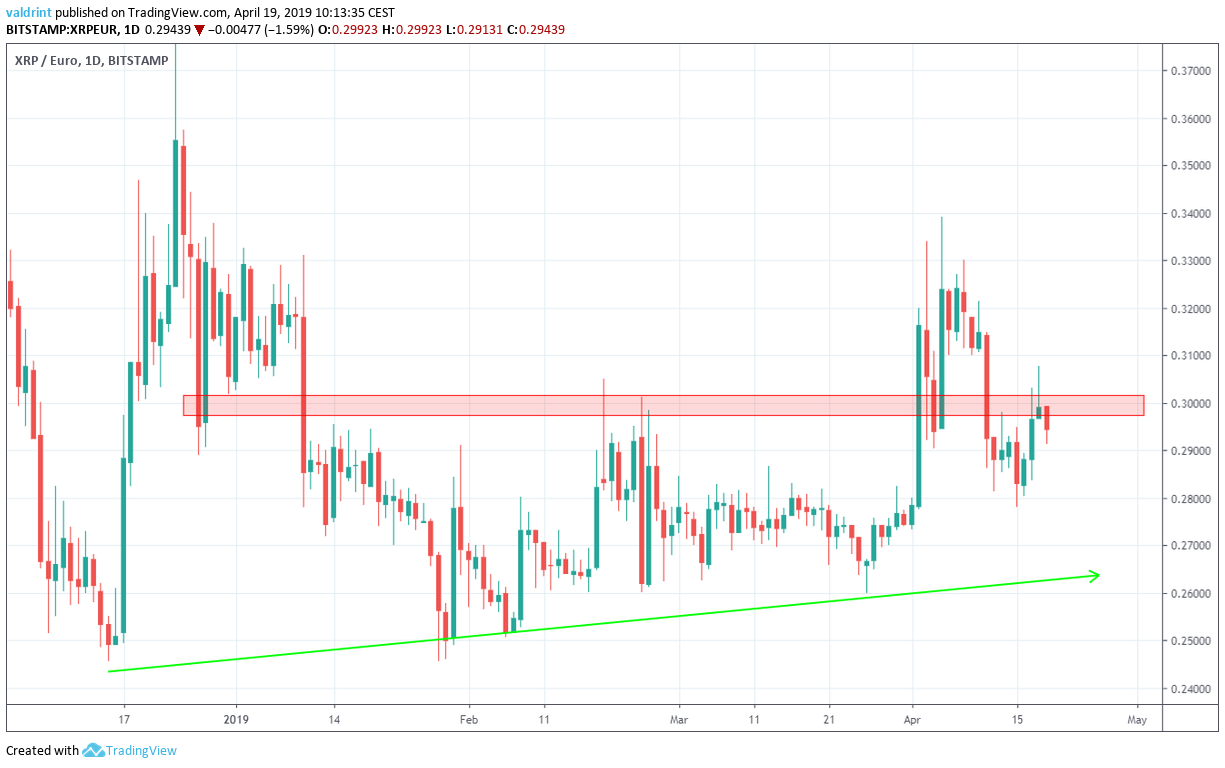
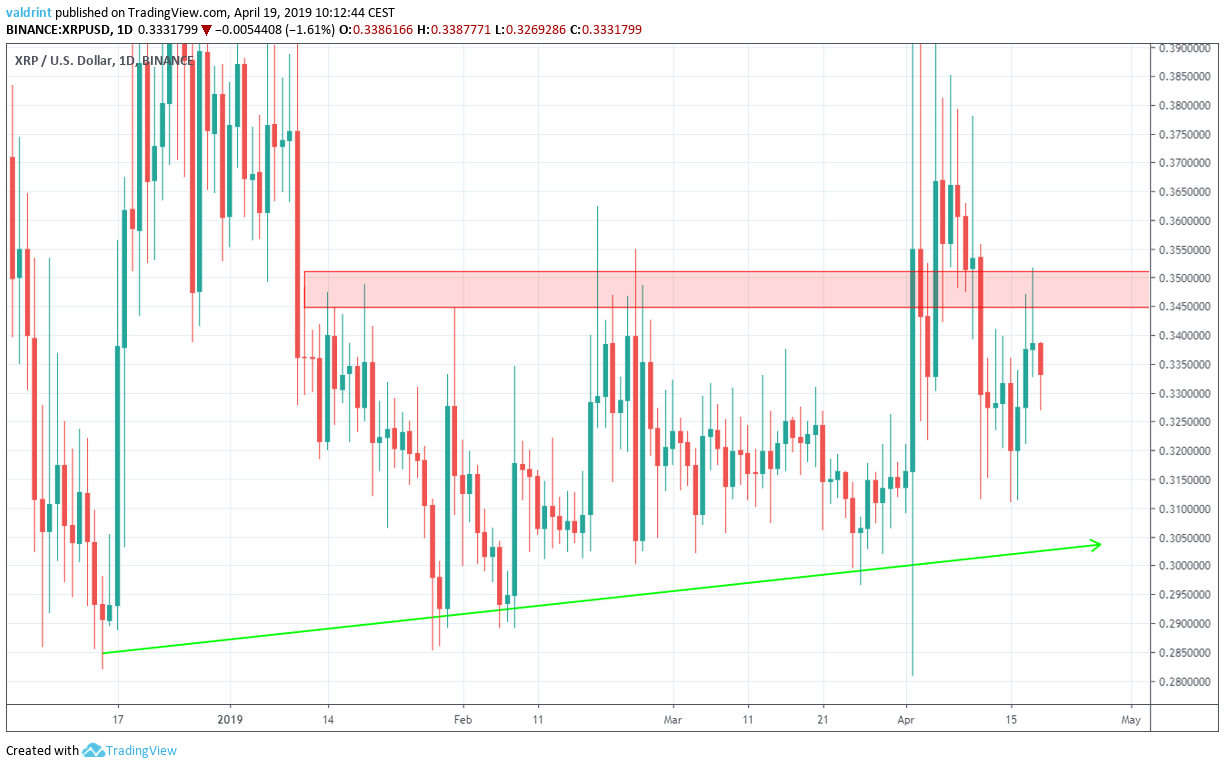
The closest resistance area is found near $0.35/€0.3. The price reached this area and was rejected. We do not believe a breakout above this area is likely. The closest support area is found near $0.3/€0.265, coinciding with the long-term support line since Dec 2018. We believe that XR will eventually reach this area.

Summary of Analysis

Based on this analysis, the price of XRP is likely to decrease at the rate predicted by the channel and eventually reach the long-term support line. For price 2019, 2020, and five-year XRP/USD price predictions click on the green button below:

Long-TErm XRP/usd Analysis

Disclaimer: This article is not trading advice and should not be construed as such. Always consult a trained financial professional before investing in cryptocurrencies, as the market is particularly volatile.

Top crypto platforms in the US | March 2024
Coinbase Coinbase Explore →
AlgosOne AlgosOne Explore →
Chain GPT Chain GPT Explore →
iTrustCapital iTrustCapital Explore →

Trusted

Disclaimer

In line with the Trust Project guidelines, this price analysis article is for informational purposes only and should not be considered financial or investment advice. BeInCrypto is committed to accurate, unbiased reporting, but market conditions are subject to change without notice. Always conduct your own research and consult with a professional before making any financial decisions. Please note that our Terms and ConditionsPrivacy Policy, and Disclaimers have been updated.

Valdrin-Tahiri.jpg
Valdrin Tahiri
Valdrin discovered cryptocurrencies while he was getting his MSc in Financial Markets from the Barcelona School of Economics. Shortly after graduating, he began writing for several different cryptocurrency related websites as a freelancer before eventually taking on the role of BeInCrypto's Senior Analyst. (I do not have a discord and will not contact you first there. Beware of scammers)
READ FULL BIO
Sponsored
Sponsored