


On Mar 26, 2019, XRP reached a high close to $0.37. A rapid drop ensued, and the price reached lows close to $0.31 on Apr 15.
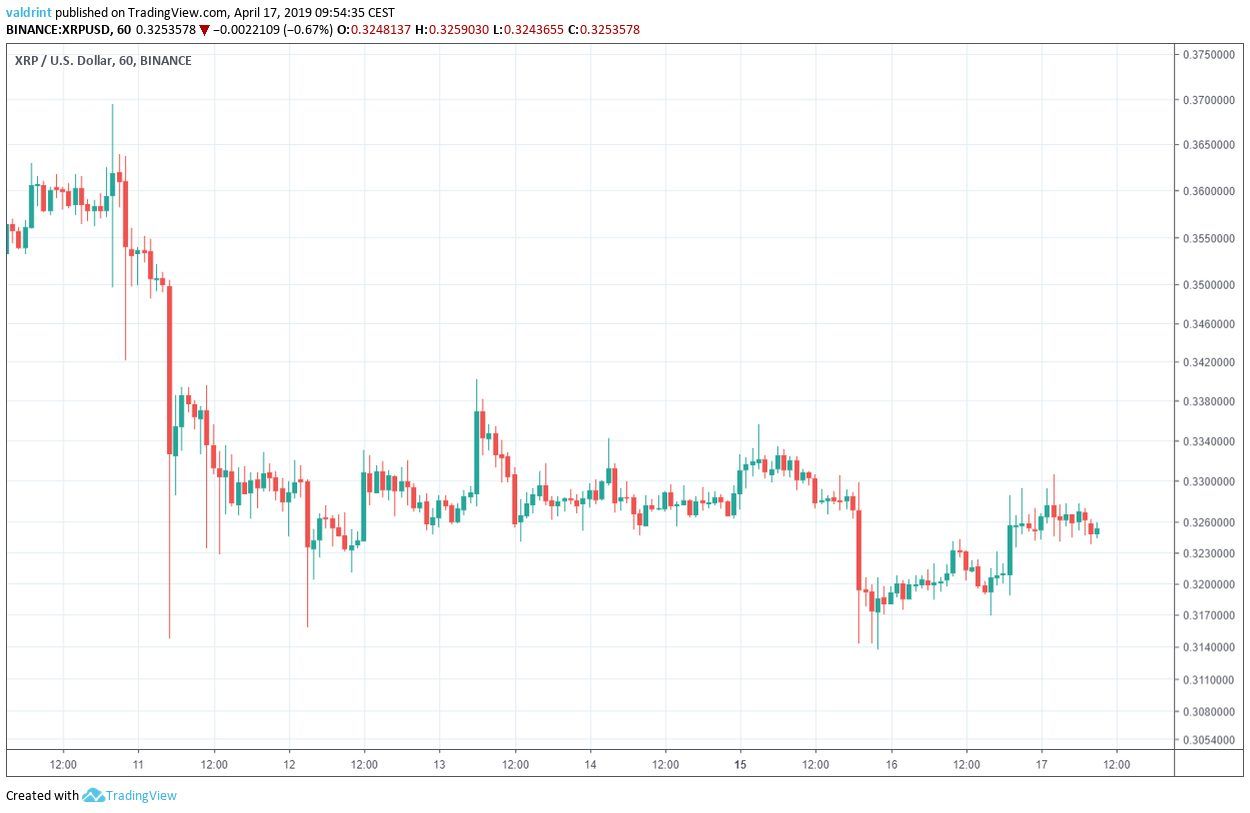
At the time of writing, the price is trading close to $0.32.
Will the price of XRP begin an upward move or continue its decrease?
Let’s find out:
XRP (XRP): Highlights and Trends For April 17, 2019
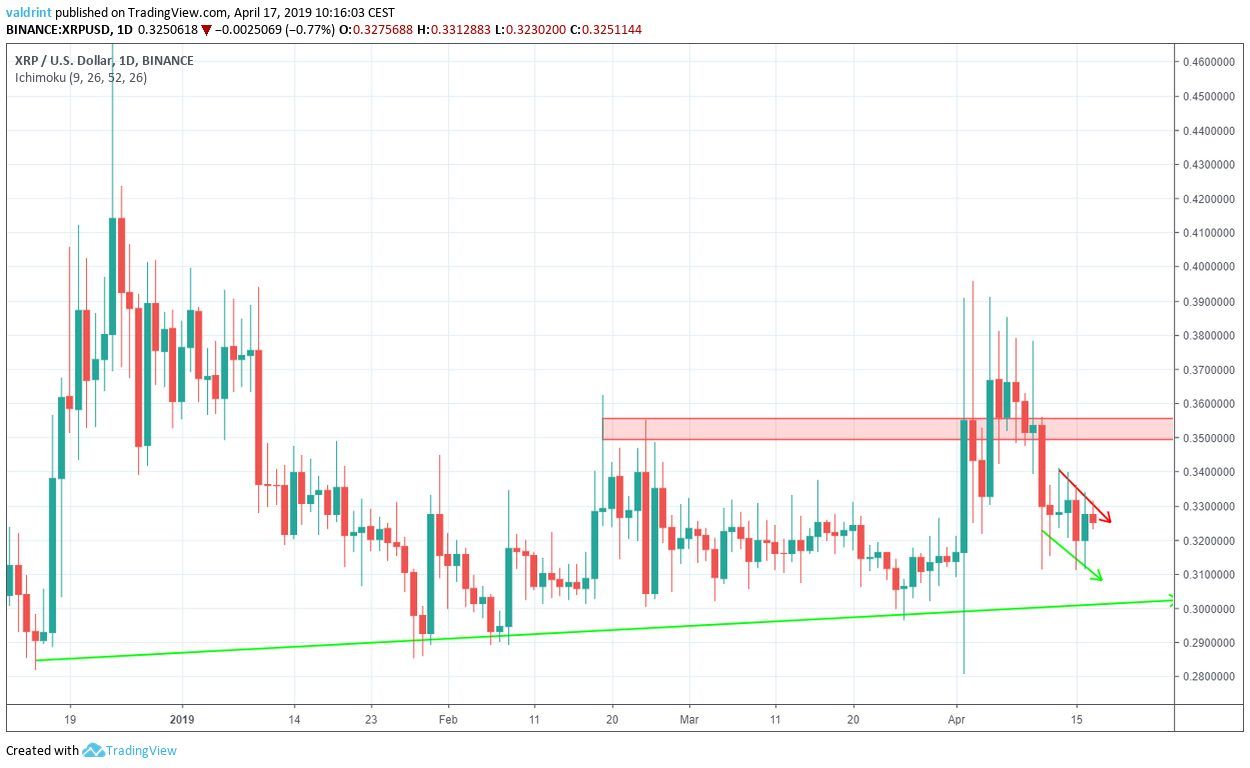
- The price of XRP/USD has been on a downtrend since Apr 10.
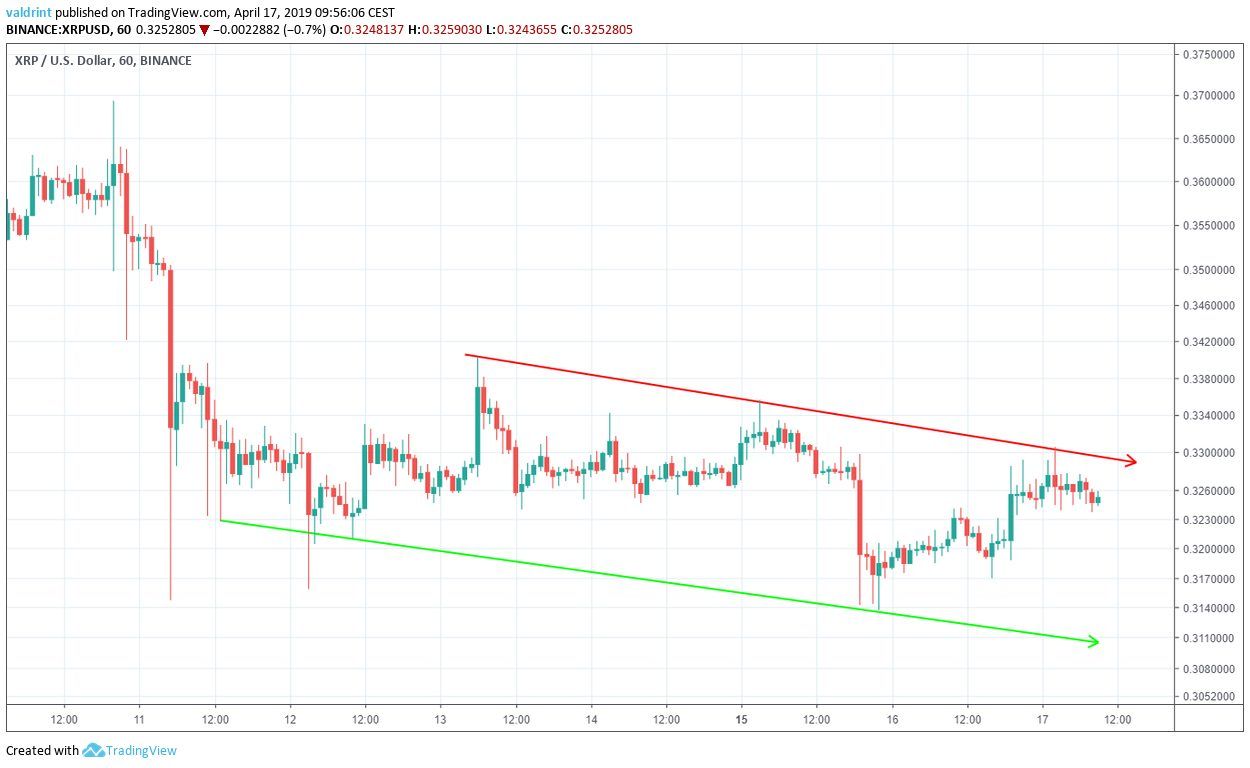
- XRP is trading inside a descending channel.
- It is trending along a long-term support line.
- Bearish divergence is developing in the RSI.
- There is resistance near $0.35 and support near $0.30.
Descending Channel
On Apr 11, the price reached an hourly low of $0.322. Several market cycles were subsequently completed. The price has created lower lows each time.
Tracing these lows gives us a descending support line:
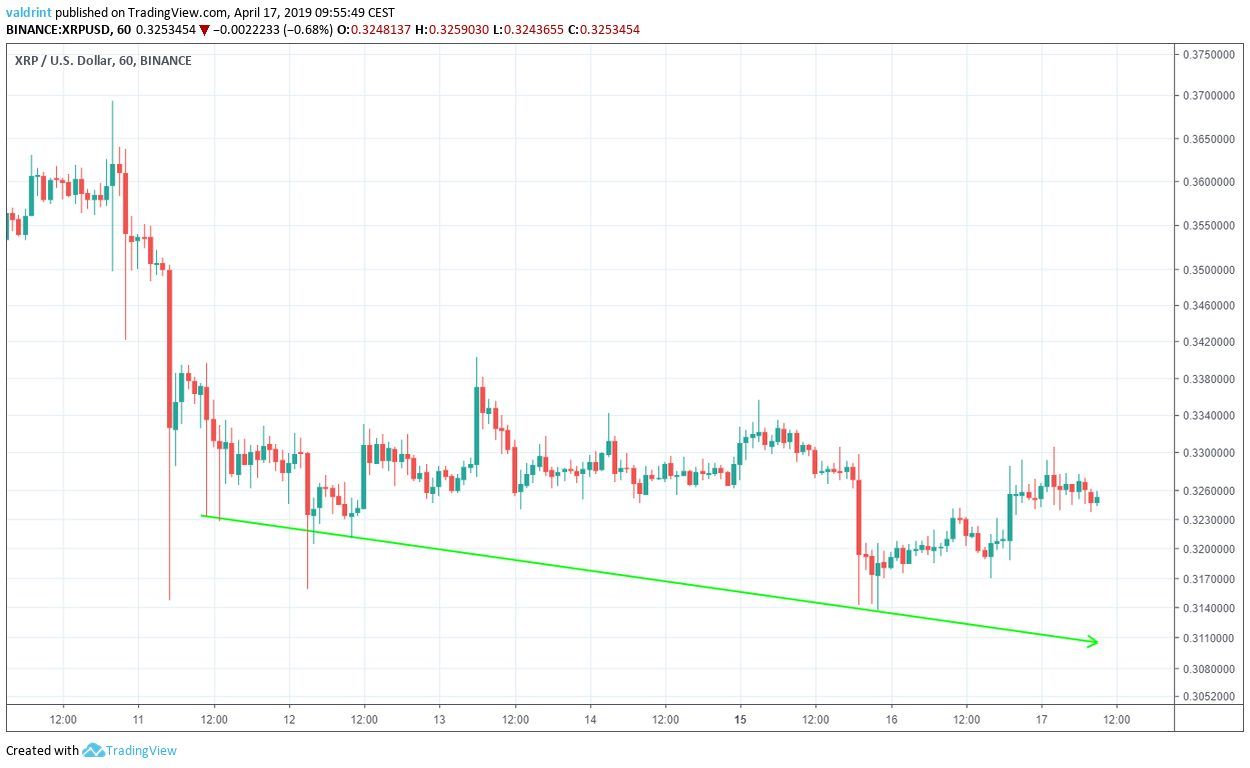
On Apr 13, the price reached a high of $0.340. At the time of writing on Apr 17, several lower highs had been reached.
A descending resistance line is created by tracing these highs. Taken together, the resistance and support lines combine to create a descending channel:
The trading pattern alone cannot determine if a breakout will occur. To assess this possibility, we need to take a look at a longer time frame and incorporate some technical indicators.
Technical Indicators
Combining RSI bullish/bearish divergence with support/resistance essentially predicts price fluctuations.
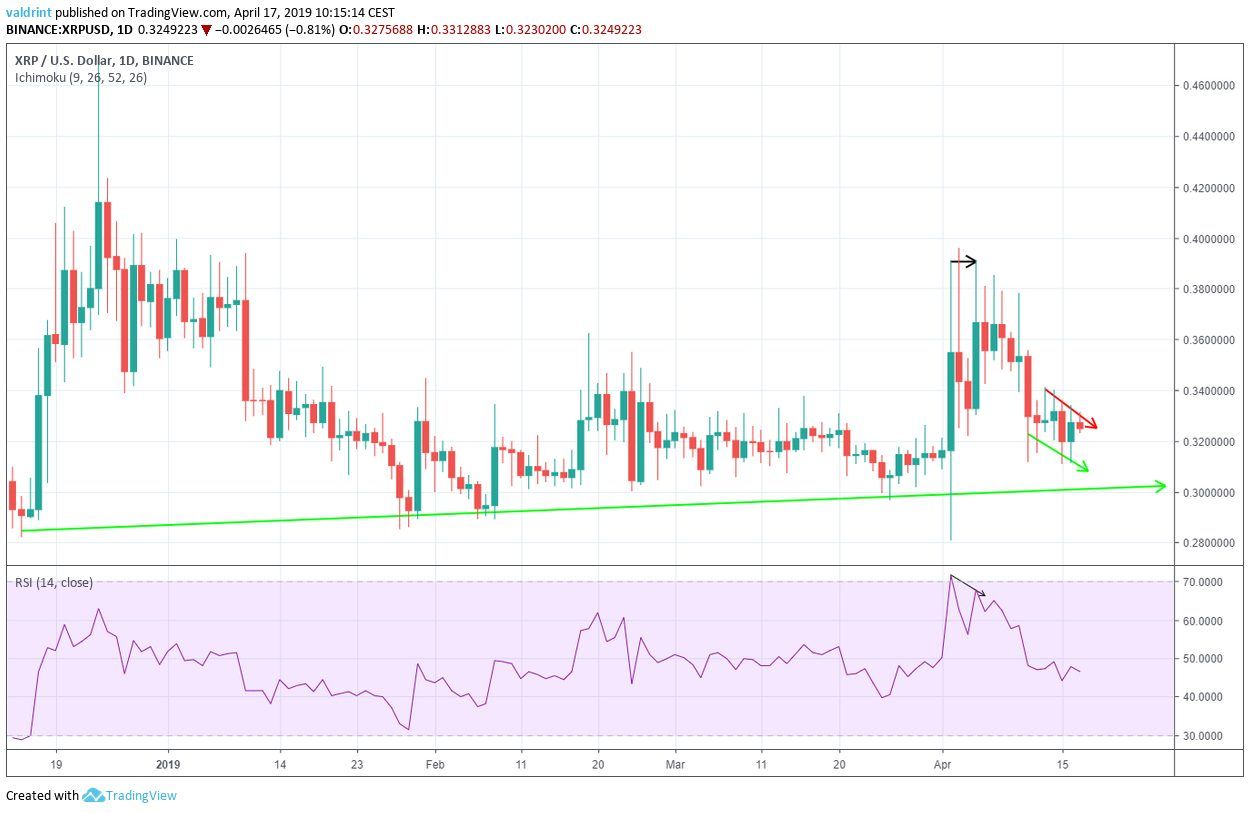
On Apr 3, the price reached a high of $0.381. It reached a similar high on Apr 5.
Similarly, the RSI made the first high on Apr 3. However, it has proceeded to generate lower values.
This is known as bearish divergence and often precedes price decreases.
We can also see that the price has been following an ascending support line since December 2018.
Using this indicator, we believe the price will keep decreasing at the rate predicted by the channel until it reaches the support line.
Reversal Areas
To determine the actual possible future price levels given an increase, we incorporate resistance and support areas into this analysis.
This resistance area is found near $0.35. We do not believe the price will reach this area in the near future.
The closest support area is found near $0.3, coinciding with the long-term support line. We believe the price will eventually reach this area.
Summary of Analysis
Based on this analysis, the price of XRP is likely to decrease at the rate predicted by the channel and eventually reach the long-term support line.
For price 2019, 2020, and five-year XRP/USD price predictions click on the green button below:
Disclaimer: This article is not trading advice and should not be construed as such. Always consult a trained financial professional before investing in cryptocurrencies, as the market is particularly volatile.


