
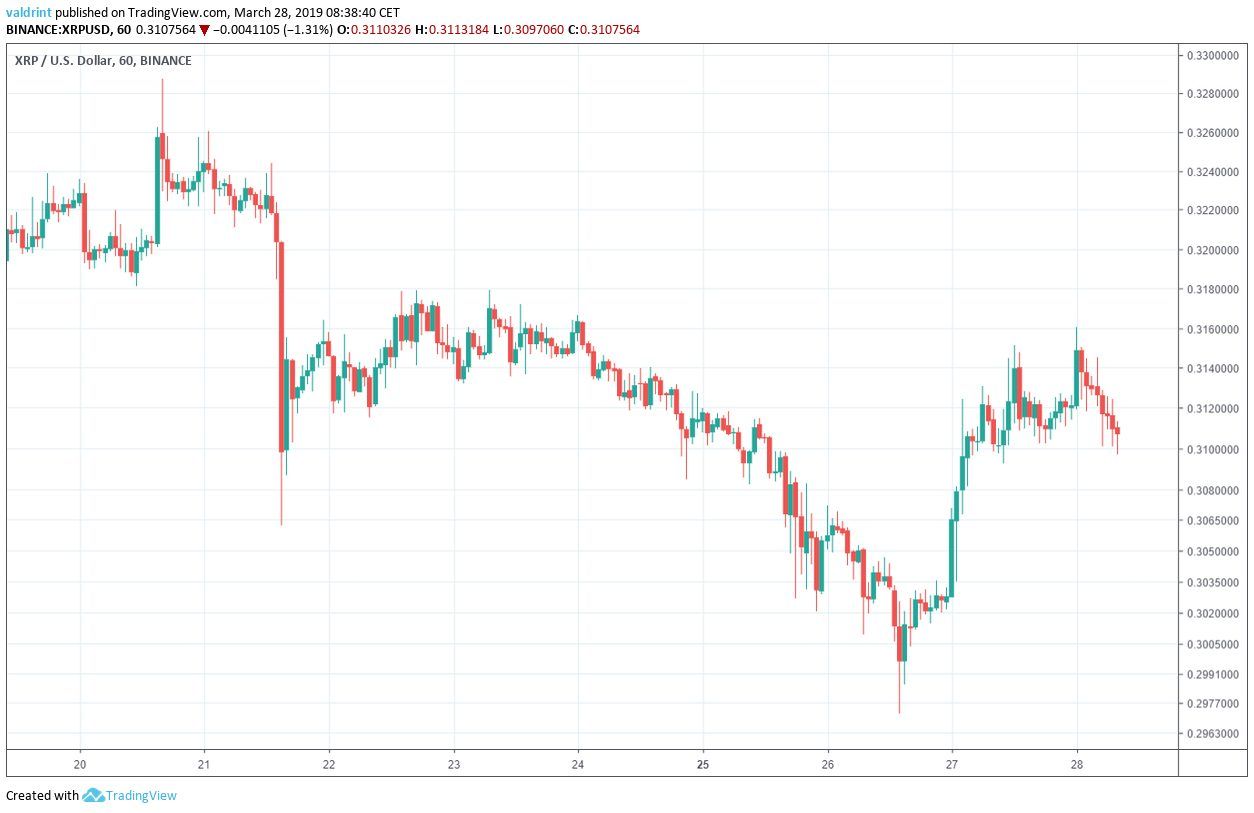
On March 20, 2019, the price of XRP (XRP) reached a high of $0.328 before a rapid drop brought prices below $0.306.
After a gradual uptrend, prices again dropped. A low of $0.297 was reached on Mar 26.
XRP has been on an uptrend since. It reached a high of $0.316 on Mar 28.
Will prices continue going up or will they plummet below $0.30 again?
Based on today’s analysis, we predict that XRP has made a short-term top. Price decreases may be forthcoming. These may be significant and rapid if XRP is not able to return to the channel defined below.
XRP (XRP): Trends and Highlights for March 28, 2019
- The price of XRP has been on a downtrend since Mar 20.
- It recently broke down from an ascending channel.
- There is bearish divergence developing in the RSI and the MACD.
- There are resistance areas near $0.325 and $0.316.
- There is support near $0.308 and $0.30.
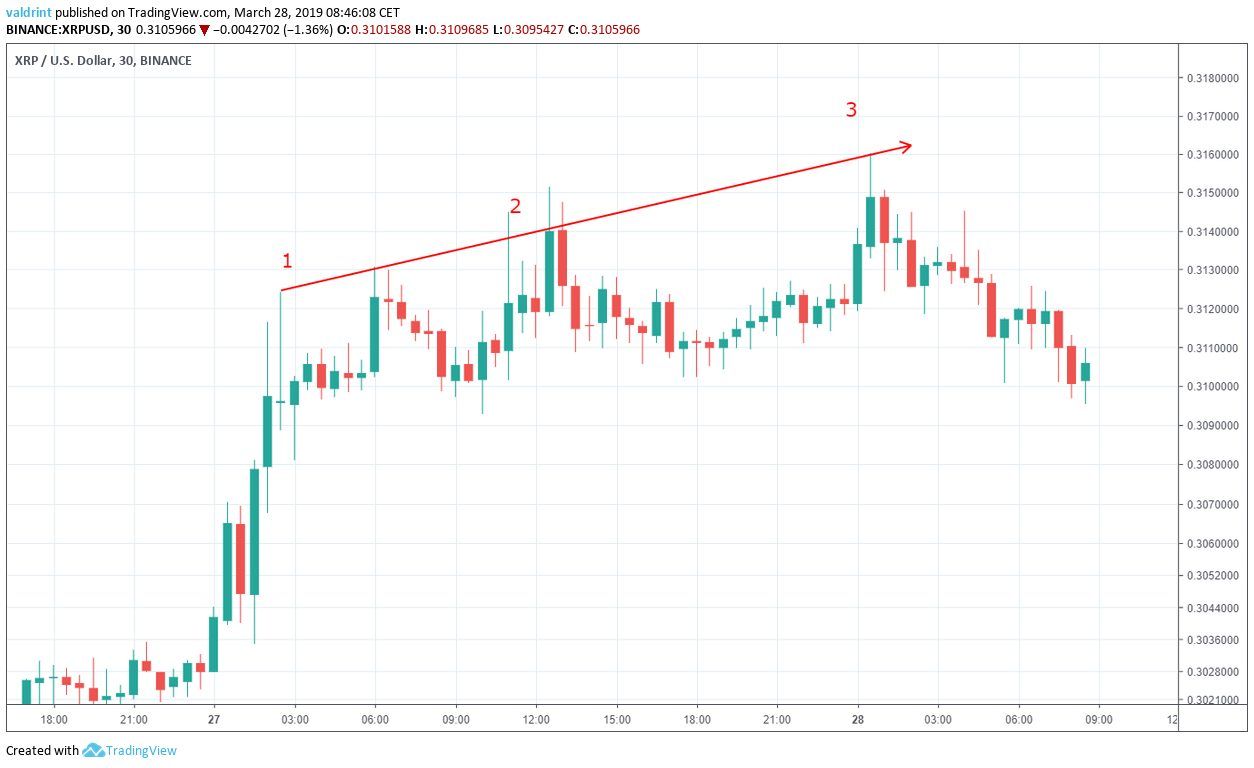
Ascending Channel
The price of XRP on Binance is analyzed at thirty-minute intervals from Mar 27 to Mar 28.
The price reached a high of $0.312 on Mar 27. A gradual uptrend followed, with each high being higher than the previous one.
Tracing these highs gives us an ascending resistance line:
XRP reached a low of $0.308 on Mar 27. A gradual uptrend ensued. Each low was higher than the previous one.
Tracing these lows gives us an ascending support line.
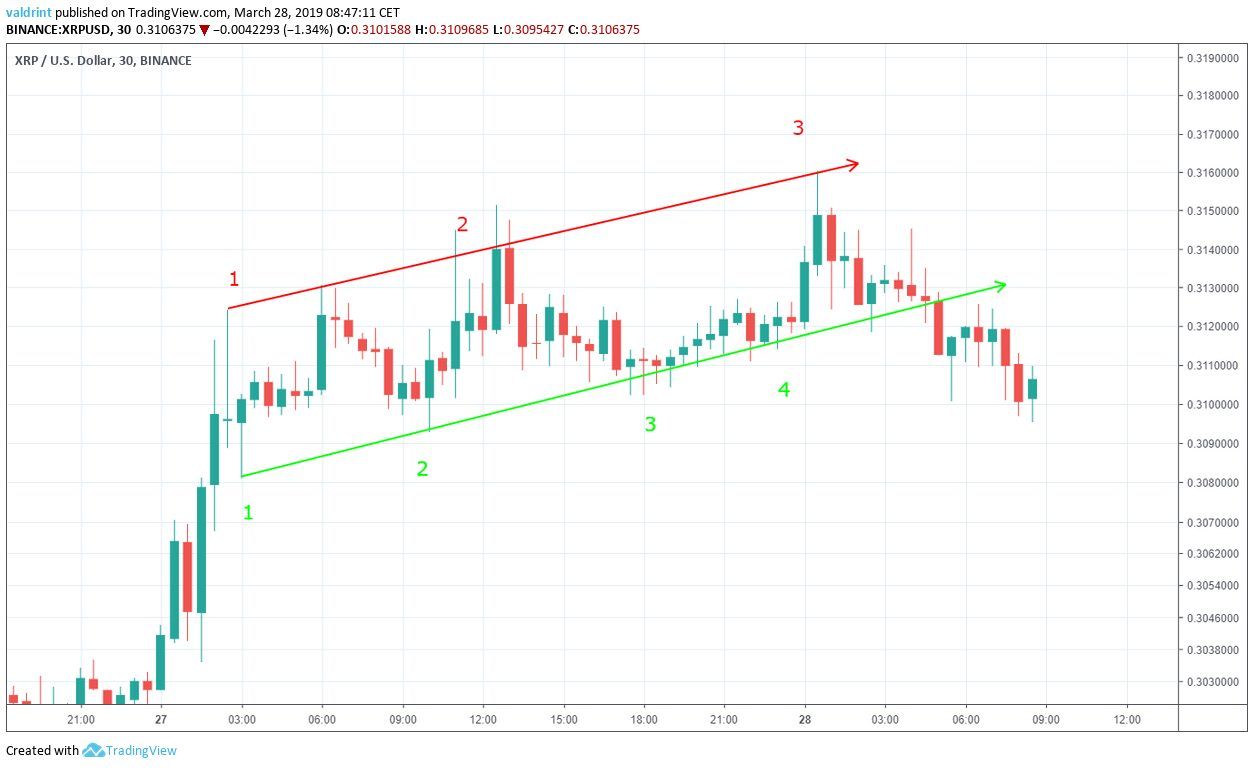
The resistance and support lines combine to create an ascending channel. Prices increases and decreases are both likely within the confines of the channel. Because the channel is upward facing, long-term price gains were expected.
However, the breakdown below the support suggests that new patterns may be emerging. It is possible the uptrend is reversing. In such a case, XRP might be expected to suffer from price losses in the near future.
Future Movement
To better asses future price trends, the price of XRP on Binance is analyzed at one-hour intervals from Mar 21 to Mar 28 alongside technical indicators.
Combining RSI and MACD bullish/bearish divergence with support/resistance essentially predicts price fluctuations.
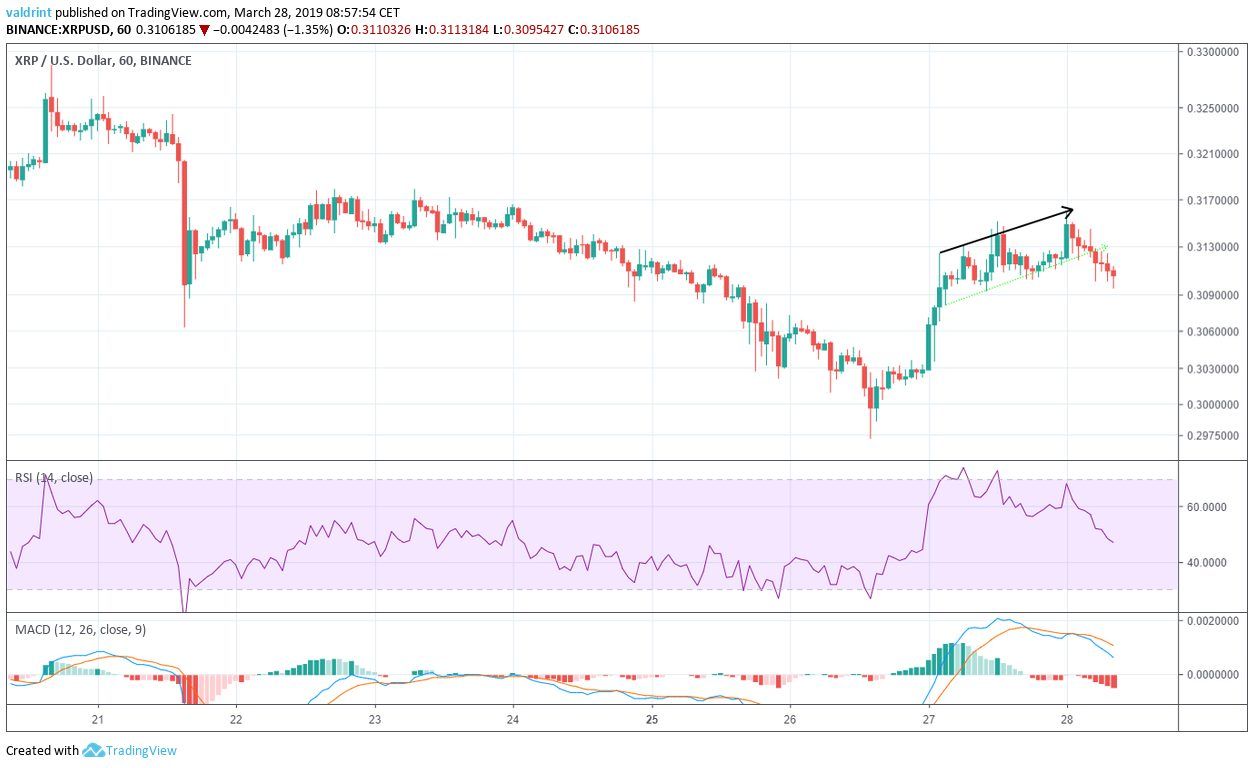
On Mar 27, the price reached a high of $0.312. On Mar 28, it made a higher high of $0.316.
Similarly, the RSI and the MACD made the first high on Mar 27. However, they have proceeded to generate lower values since.
This is known as bearish divergence and often precedes price decreases. In the case of XRP, it preceded the breakdown from the channel.
The use of these indicators along with the breakdown from the channel suggests that XRP is about to suffer continued price losses.
Resistance and Support
Resistance and support lines are created when the price revisits the same level several times. They help to determine possible future price values given increases, decreases, breakouts, and breakdowns.
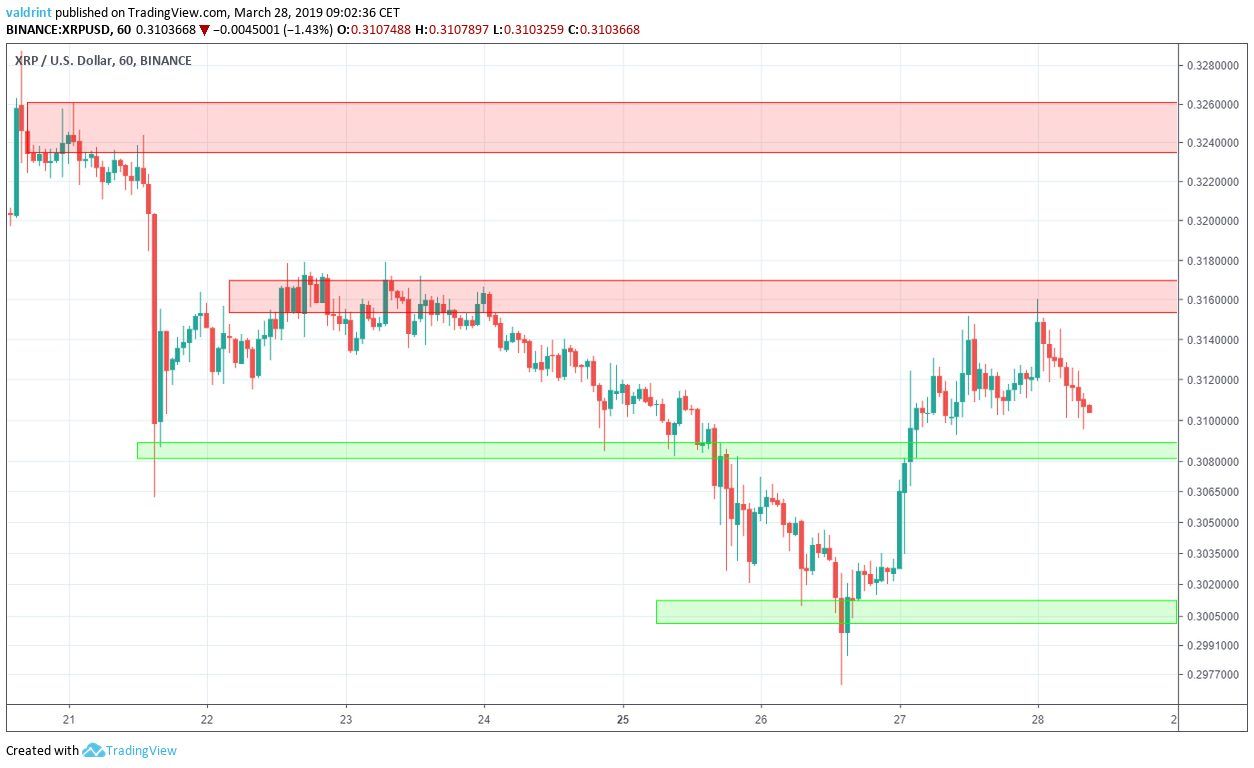
There are two visible resistance areas, near $0.325 and $0.317. In case the price continues to increase, XRP may reach these areas. According to our analysis, this is unlikely.
The closest support areas are found near $0.309 and $0.30. If our analysis proves to be correct, the price will reach at least one of these areas.
Summary of Analysis
Based on this analysis, the price of XRP is likely to drop to the minor support area near $0.308. It may return to the support and continue trading there.
Do you think the price of XRP has made a short-term top? Let us know in the comments below.
Disclaimer: This article is not trading advice and should not be construed as such. Always consult a trained financial professional before investing in cryptocurrencies, as the market is particularly volatile.
