


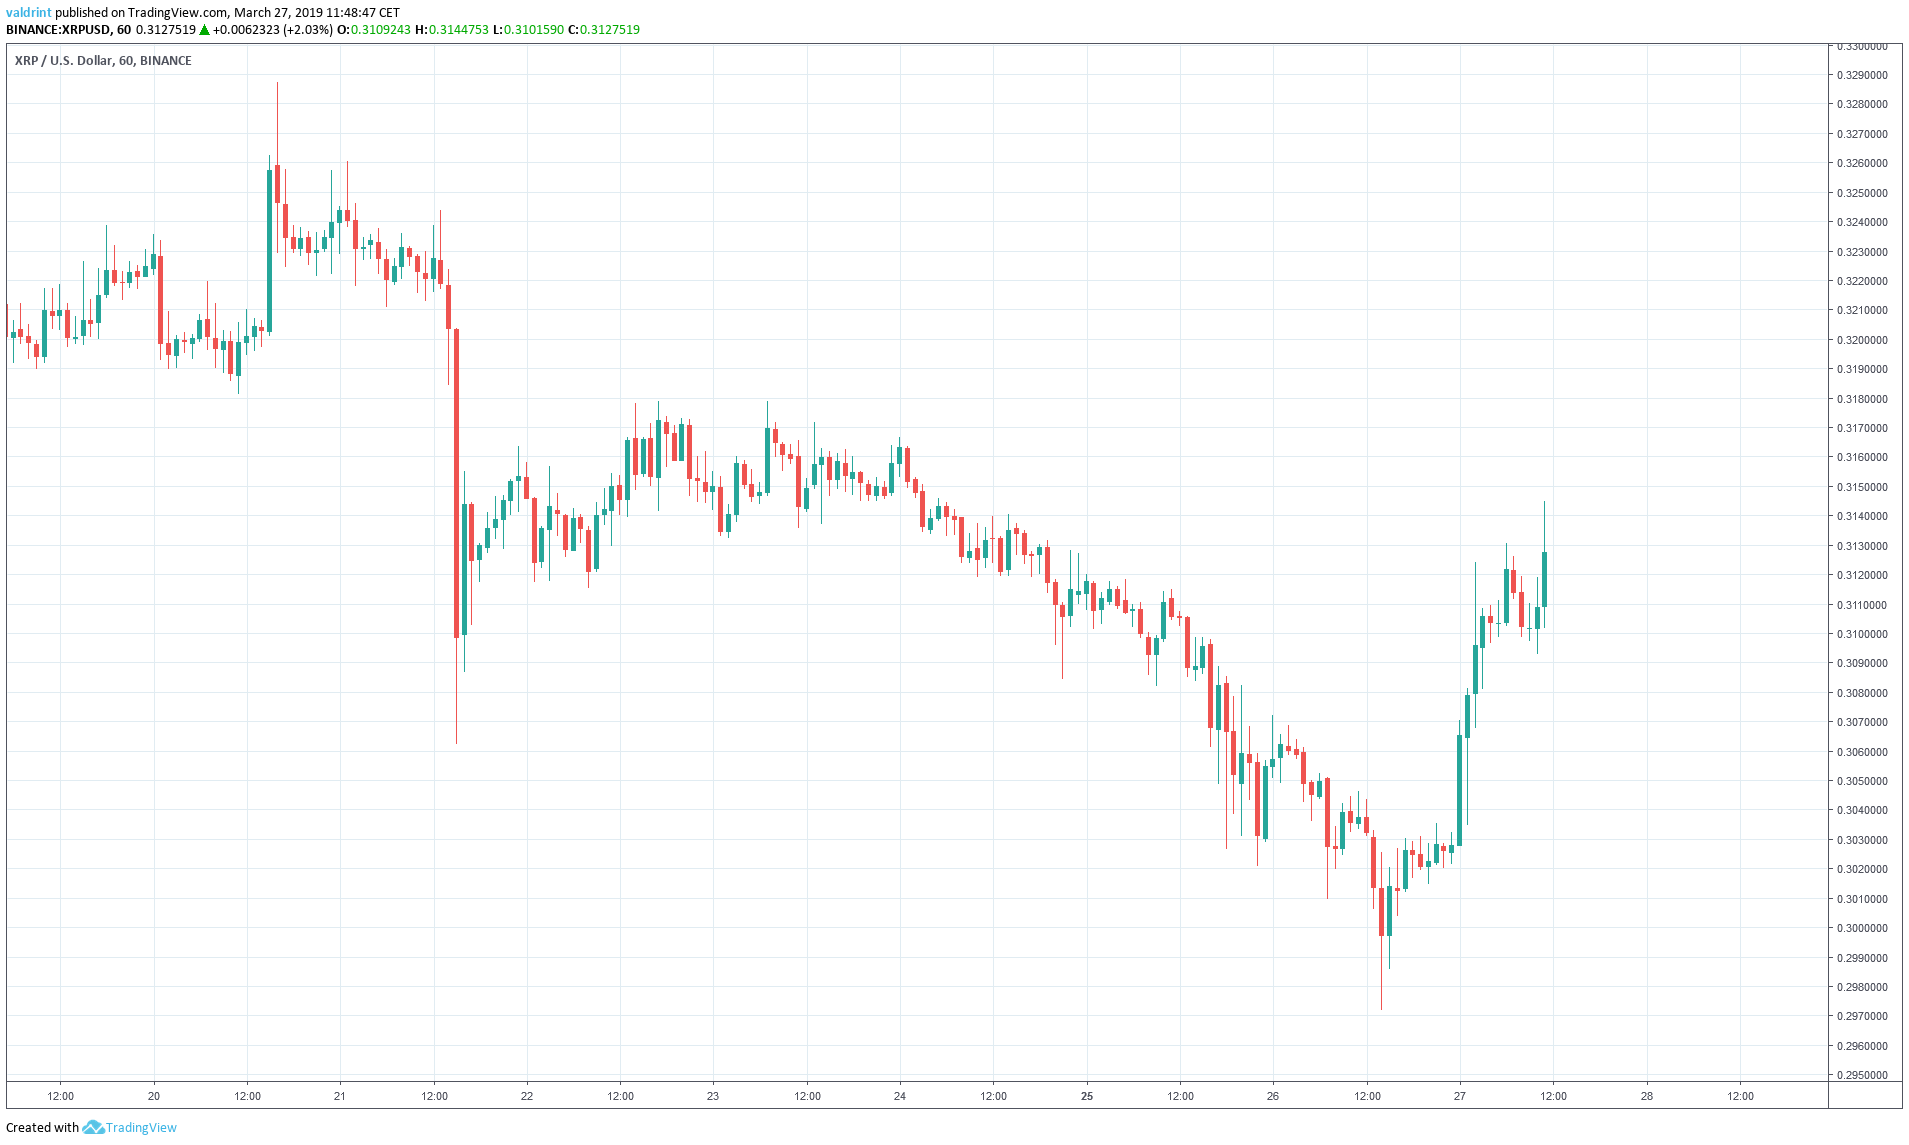
On March 20, 2019, the price of XRP (XRP) reached a high of $0.328 before a rapid drop brought prices below $0.306. After a gradual uptrend, prices again dropped, making a low of $0.297 on Mar 26. It has been on an uptrend since.
Based on today’s analysis, we predict that XRP will likely experience slight decreases and fall to one of the minor support areas outlined below.
XRP (XRP): Trends and Highlights for March 27, 2019
- The price of XRP has been on a downtrend since Mar 20.
- It recently broke out of a descending wedge.
- There is bearish divergence developing in the RSI.
- There are resistance areas near $0.325 and $0.316.
- There is support near $0.308 and $0.30.
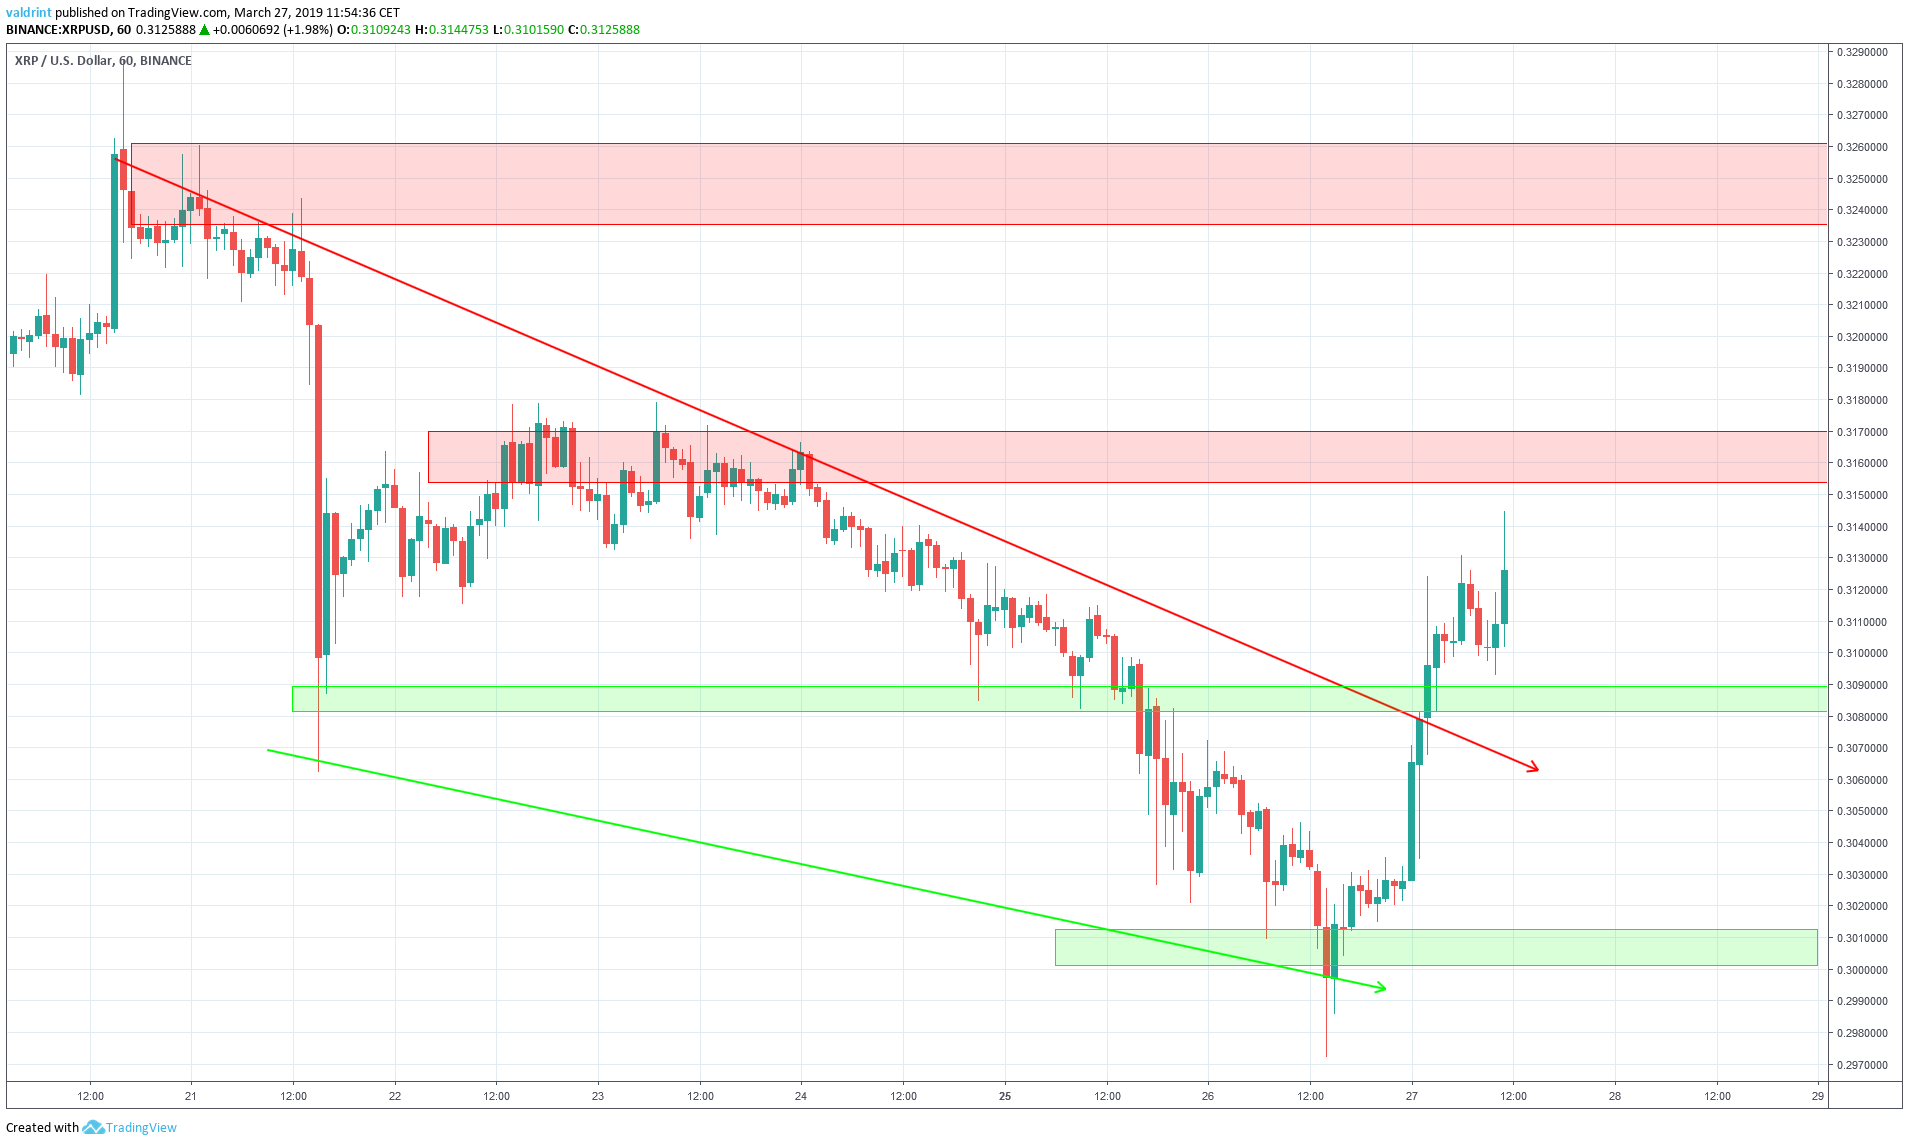
Descending Wedge
The price of XRP on Binance is analyzed at one-hour intervals from Mar 19 to Mar 27.
The price reached a high of $0.328 on Mar 20. A sharp drop ensued, followed by a gradual downtrend move. The price has made successively lower highs.
Tracing these highs gives us a descending resistance line:
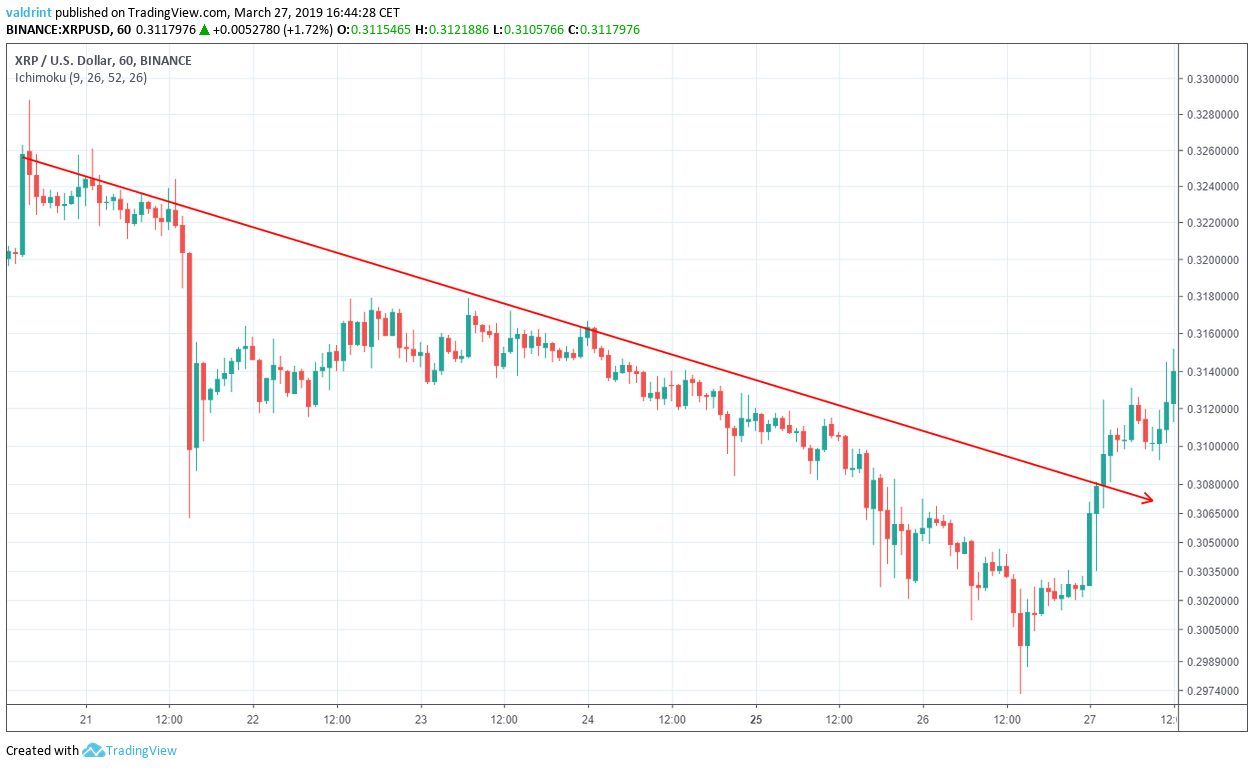
The resistance line acts as a ceiling to price, preventing further upward movement. It theoretically traces the upper limits of the price and measures the rate of decrease.
Breakouts above the line such as the wick highs of $0.326 and $0.324 on Mar 21 can be considered insignificant since they were not supported by continuous gains.
Furthermore, XRP reached a low of $0.306 on Mar 21. It immediately rebounded and closed at $0.312 on the same day. An upward move was followed by a gradual decline. XRP made a lower low of $0.296 on Mar 26.
Tracing these lows gives us a descending support line:
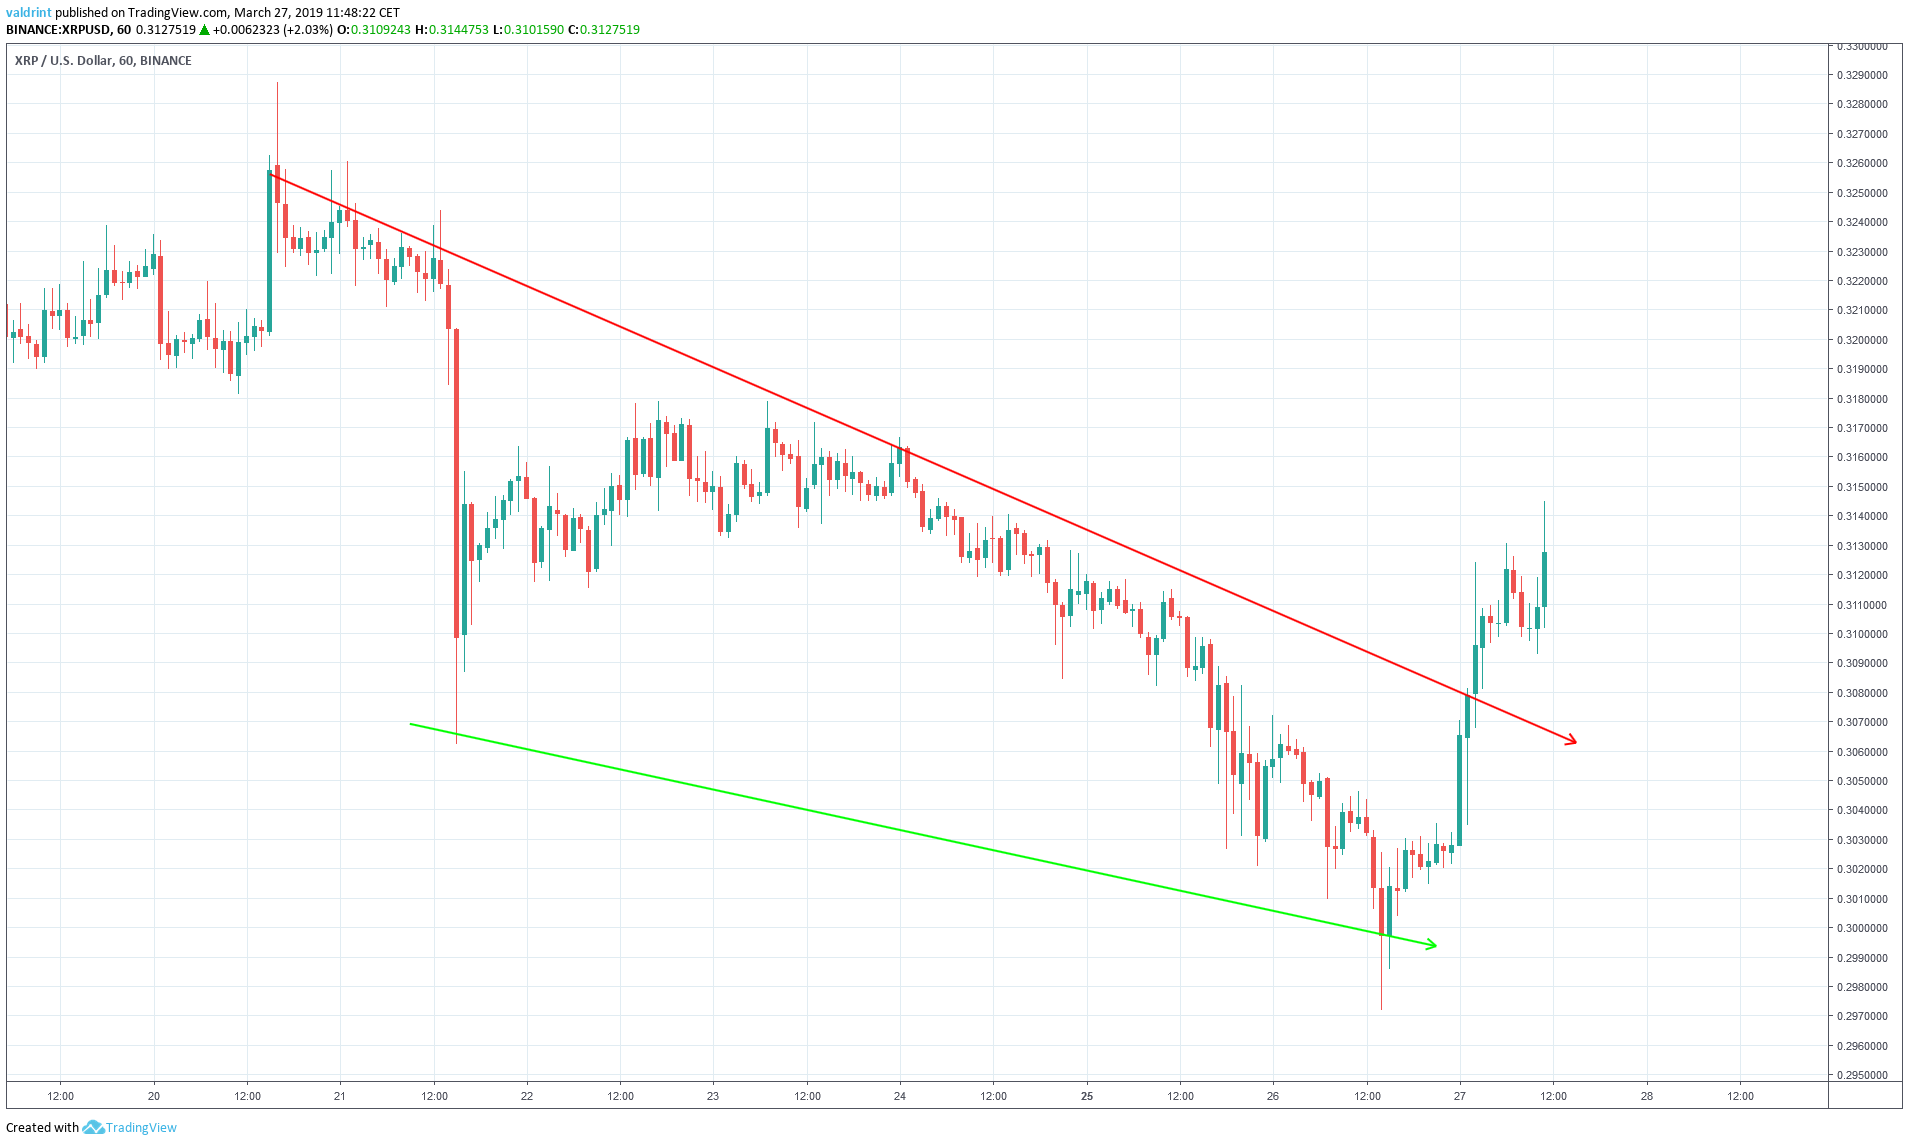
The resistance and support lines combine to create a descending wedge. This is a bullish pattern and suggests that price increases are more likely than decreases.
A breakout occurred on Mar 27. Prices have since been rapidly increasing past the current levels of the channel. This is common behavior during a breakout.
Based on this recent movement, it appears as if new resistance and support levels are emerging. However, to better understand the nature of these movements, we must look at the technical indicators.
Future Movement
The first technical indicator we will examine is relative strength index (RSI). It calculates the size of the changes in price in order to determine oversold or overbought conditions in the market.
Combining RSI bullish/bearish divergence with support/resistance essentially predicts price fluctuations.
We also examine trading volume. This indicator measures how much of a certain asset is traded in a certain period of time. Combined with breakouts or breakdowns, it can be used as a confirmation tool for the validity of a movement.
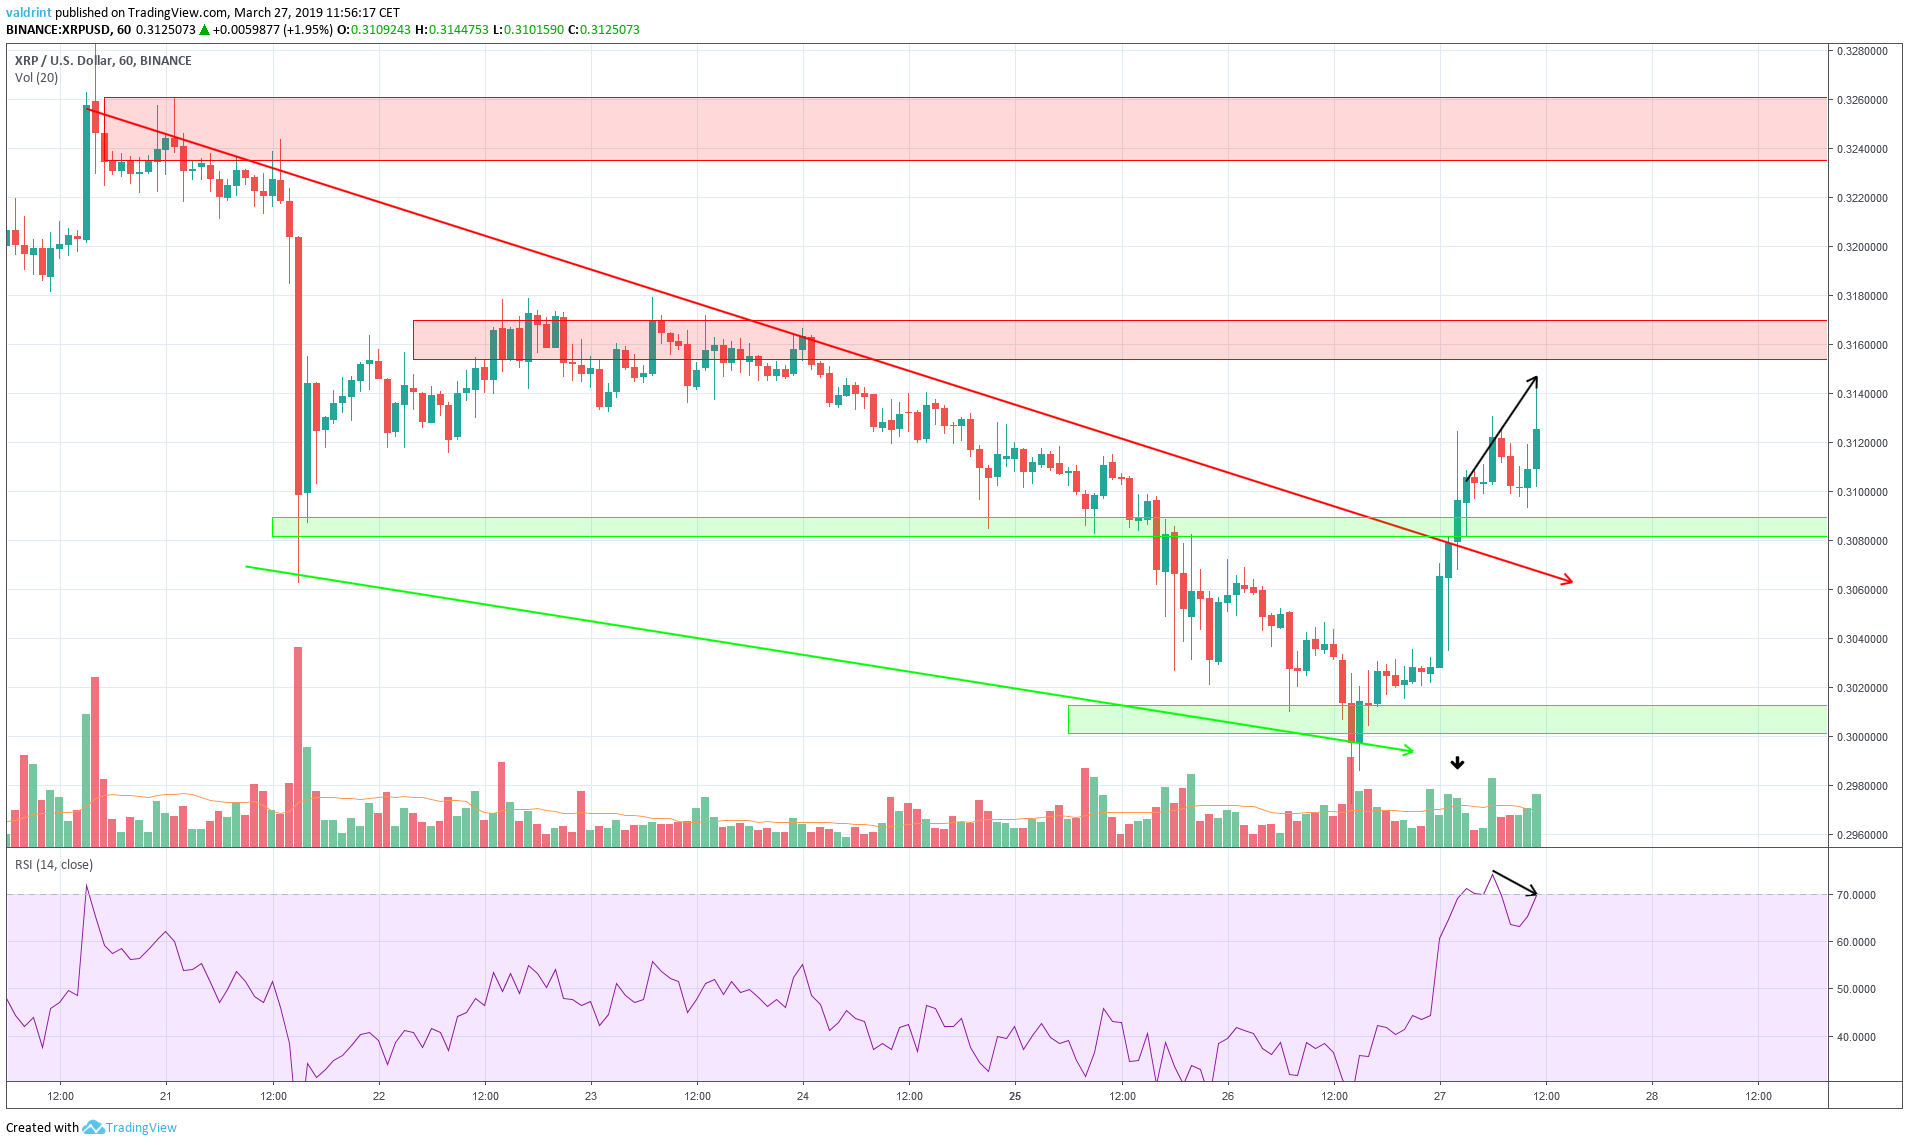
On Mar 27, the price made a high of $0.312. It proceeded to make another high of $0.315 later in the day.
Similarly, the RSI made the first high on Mar 27. However, it has continued to generate lower values since. The aforementioned high is still the highest value recorded.
Furthermore, we can see that the breakout from the wedge occurred when trading volume was at average levels.
The use of volume combined with the bearish divergence leads us to believe that future price decreases may be in store. This could represent a return to the wedge. In such a case, these recent increases might represent a false breakout.
Resistance and Support
Resistance and support lines are created when the price revisits the same level several times. They help to determine possible future price values given increases, decreases, breakouts, and breakdowns.
There are two visible resistance areas, near $0.325 and $0.317. In case the price continues to increase, XRP may reach values around $0.317. However, is less likely that price would continue to rise to $0.325 before a subsequent drop.
If price, however, returns to the wedge as predicted above, we may see price moving toward the first support area of $0.308. During the increase on Mar 27, this level was already reached. Prior to this point, it marked the highest levels of the current trading pattern. Now, this level is above the downward facing wedge.
Price is likely to return to this area and possibly drop to the second support area of $0.30. This level is now within the wedge defined above. If XRP does return to the support and continues trading there, the likelihood of reaching and dropping below $0.30 increases in the longer-term.
Summary of Analysis
Based on this analysis, the price of XRP is likely to drop to the minor support area near $0.308. It may return to the support and continue trading there. This would be evidence of a false breakdown and make a movement toward $0.30 more likely.
However, the price might continue trading above the wedge and generate new support and resistance lines. In such a case, a new trading pattern would emerge.
Based on the indicators, price losses and a return to the support areas likely.
Do you think the price of XRP will continue its upward move? Let us know in the comments below.
Disclaimer: This article is not trading advice and should not be construed as such. Always consult a trained financial professional before investing in cryptocurrencies, as the market is particularly volatile.


