


The Ripple XRP price has increased since completing its double bottom pattern on Sept. 12.
However, the upward movement could not be sustained and the XRP price is at risk of breaking down below the $0.49 support area.
XRP Creates Bullish Pattern – Fails to Sustain Increase
The daily time frame technical analysis for XRP shows that the price has increased since Sept. 11. The increase completed a double bottom, considered a bullish pattern. After the double bottom, XRP began the current upward movement, which is still ongoing.
Read More: Best Crypto Sign-Up Bonuses in 2023.
After the second bottom, XRP broke out from a descending resistance line that had been in place since the yearly high in July. Due to these two bullish developments, the XRP price was expected to increase significantly after the breakout.
However, this was not the case. The upward movement culminated with a high of $0.52 on September 20 and the price has fallen since, rapidly approaching its pre-breakout levels.
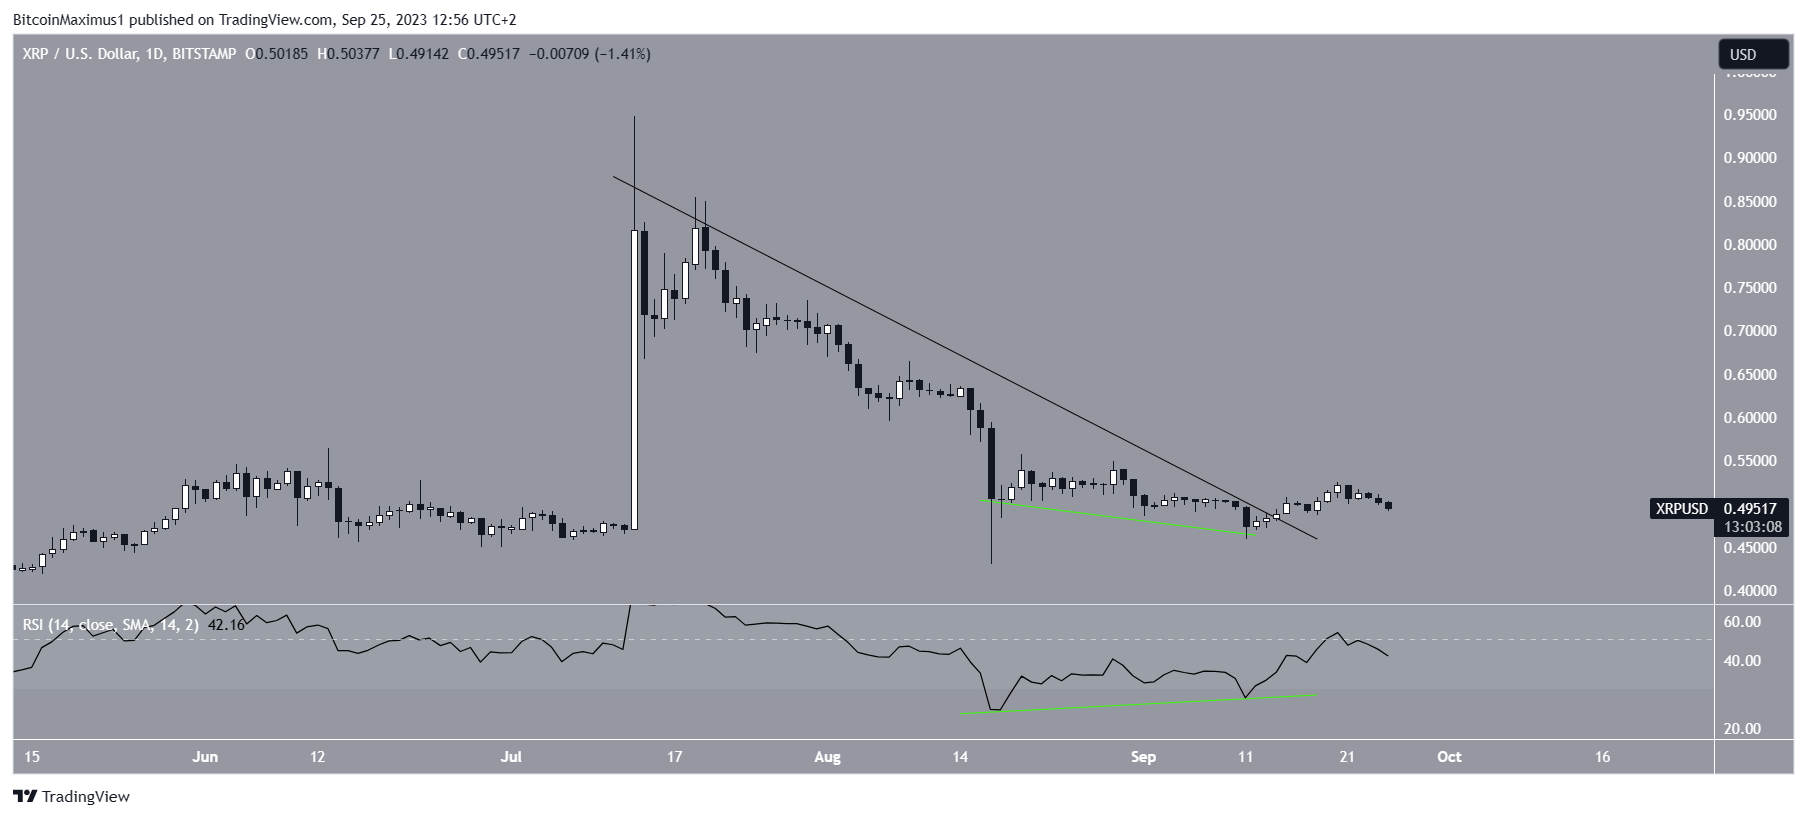
The Relative Strength Index (RSI) gives a mixed reading, though it is leaning bullish.
While the RSI is increasing, it has not moved above 50 yet. However, the double bottom pattern was combined with bullish divergence in the RSI, something which preceded the entire breakout.
The RSI is a momentum indicator used by traders to evaluate whether a market is overbought or oversold, and to determine whether to accumulate or sell an asset. Readings above 50 and an upward trend suggest that bulls still have an advantage, while readings below 50 indicate the opposite.
In any case, the RSI has to move and stay above 50 to confirm the bullish trend reversal.
XRP Price Prediction: Bounce or Breakdown?
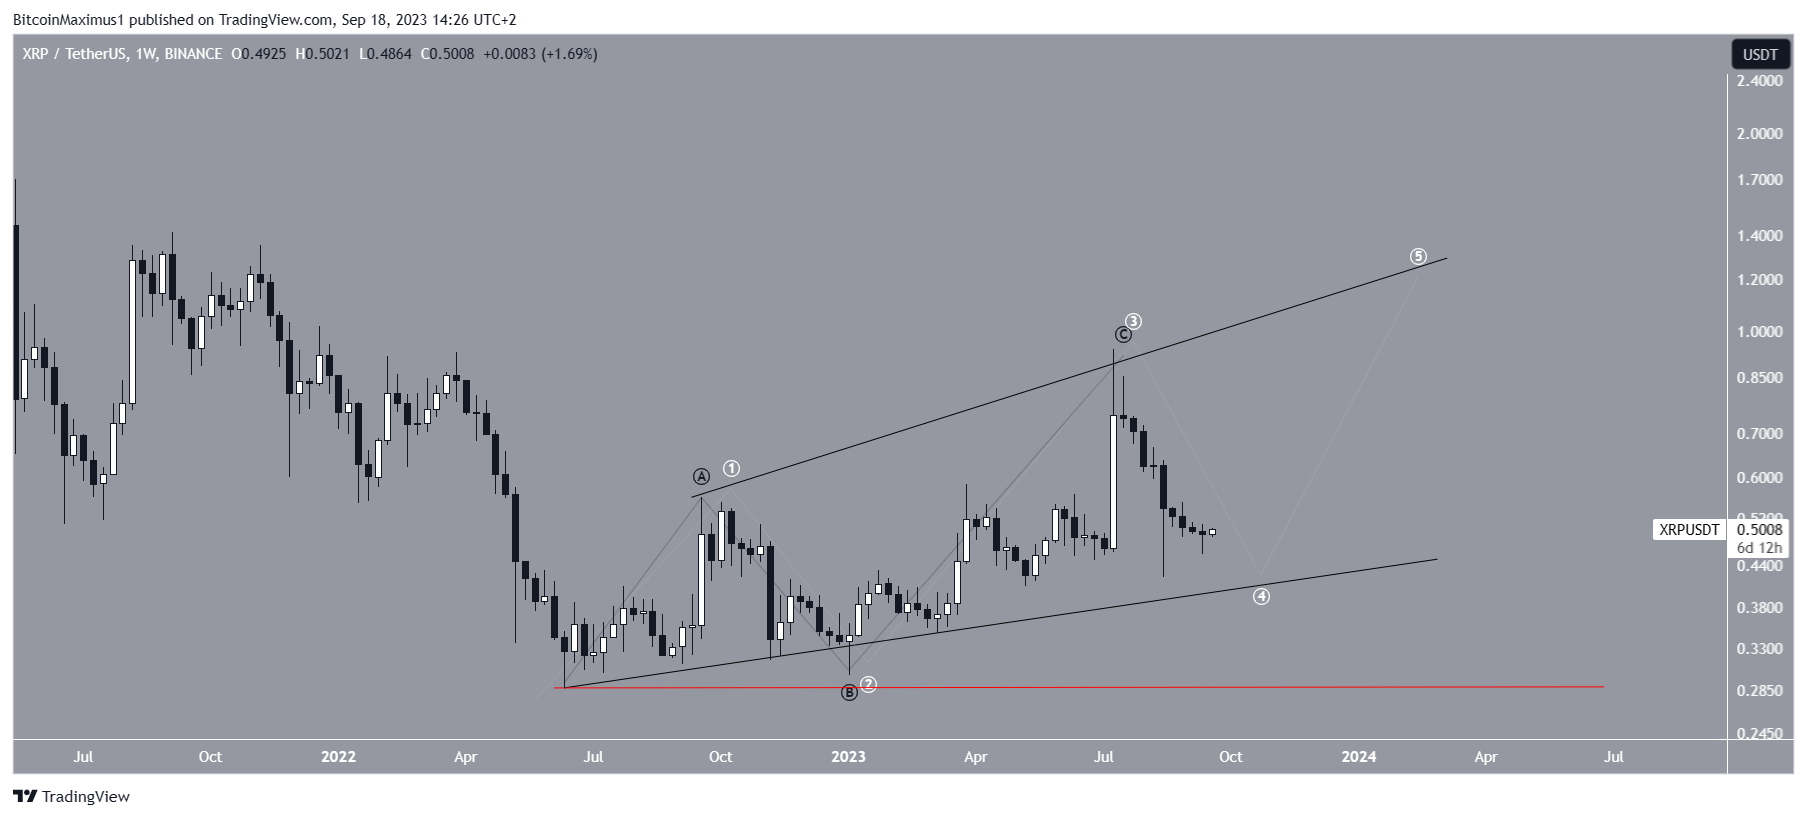
Similar to the daily time frame, the six-hour one offers mixed readings.
On the bullish side, XRP has reclaimed the $0.49 horizontal area after previously falling below it (red circle). Currently, it seems to be in the process of validating it as support.
However, the price has also broken down from a short-term ascending support line. This is a bearish sign that suggests the previous upward movement has now ended. Moreover, the six-hour RSI has fallen below 50 (red icon) and is decreasing.
Read More: Everything You Need To Know About Ripple vs. SEC
Therefore, if the XRP price falls below the $0.49 horizontal support area, it can decrease by another 7% and reach the $0.46 support. On the other hand, a strong bounce can take the price to the previous ascending support line at $0.52. This would be an increase of 5%.
It is worth mentioning that there is no major news regarding the Ripple vs. SEC case. In less important news, Ben Armstrong, alias BitBoy, is asking for XRP donations to fund his legal action against the parent company of the BitBoy Crypto brand which recently fired him.
To conclude, the future XRP price prediction will be determined by whether the price breaks down from the $0.49 horizontal support area or bounces. A 5% increase can occur in case of a bounce while a 7% drop is likely if the price breaks down.
For BeInCrypto’s latest crypto market analysis, click here.


