


The Bitcoin (BTC) price could not sustain its bounce last week, casting some doubt on the possibility that a bullish trend reversal began two weeks ago.
A breakout from a descending resistance line in the daily timeframe would be required to confirm the trend as bullish.
Bitcoin (BTC) Weekly Price Cannot Sustain Bounce
The weekly timeframe technical analysis shows that the BTC price bounced significantly two weeks ago. The bounce validated the $24,800 horizontal area. This is a crucial area that has intermittently acted as both resistance and support (red & green icons) since July 2022.
So, as long as the price does not close below it, it is possible that the ongoing decrease is just a retest of the area, validating it as support in the process.
Check out the Best Crypto Sign-Up Bonuses in 2023
However, the cryptocurrency failed to sustain the increase last week. While it reached a local high of $27,486, the price created a long upper wick and closed bearishly. The wick (black icon) and lower close indicate that bulls could not sustain the upward movement. Instead, bears took over and pushed the price down.
If the decrease continues, the $24,800 area will be 5% below the current price. On the other hand, a 20% increase would be required for the price to reach the $31,000 resistance area.
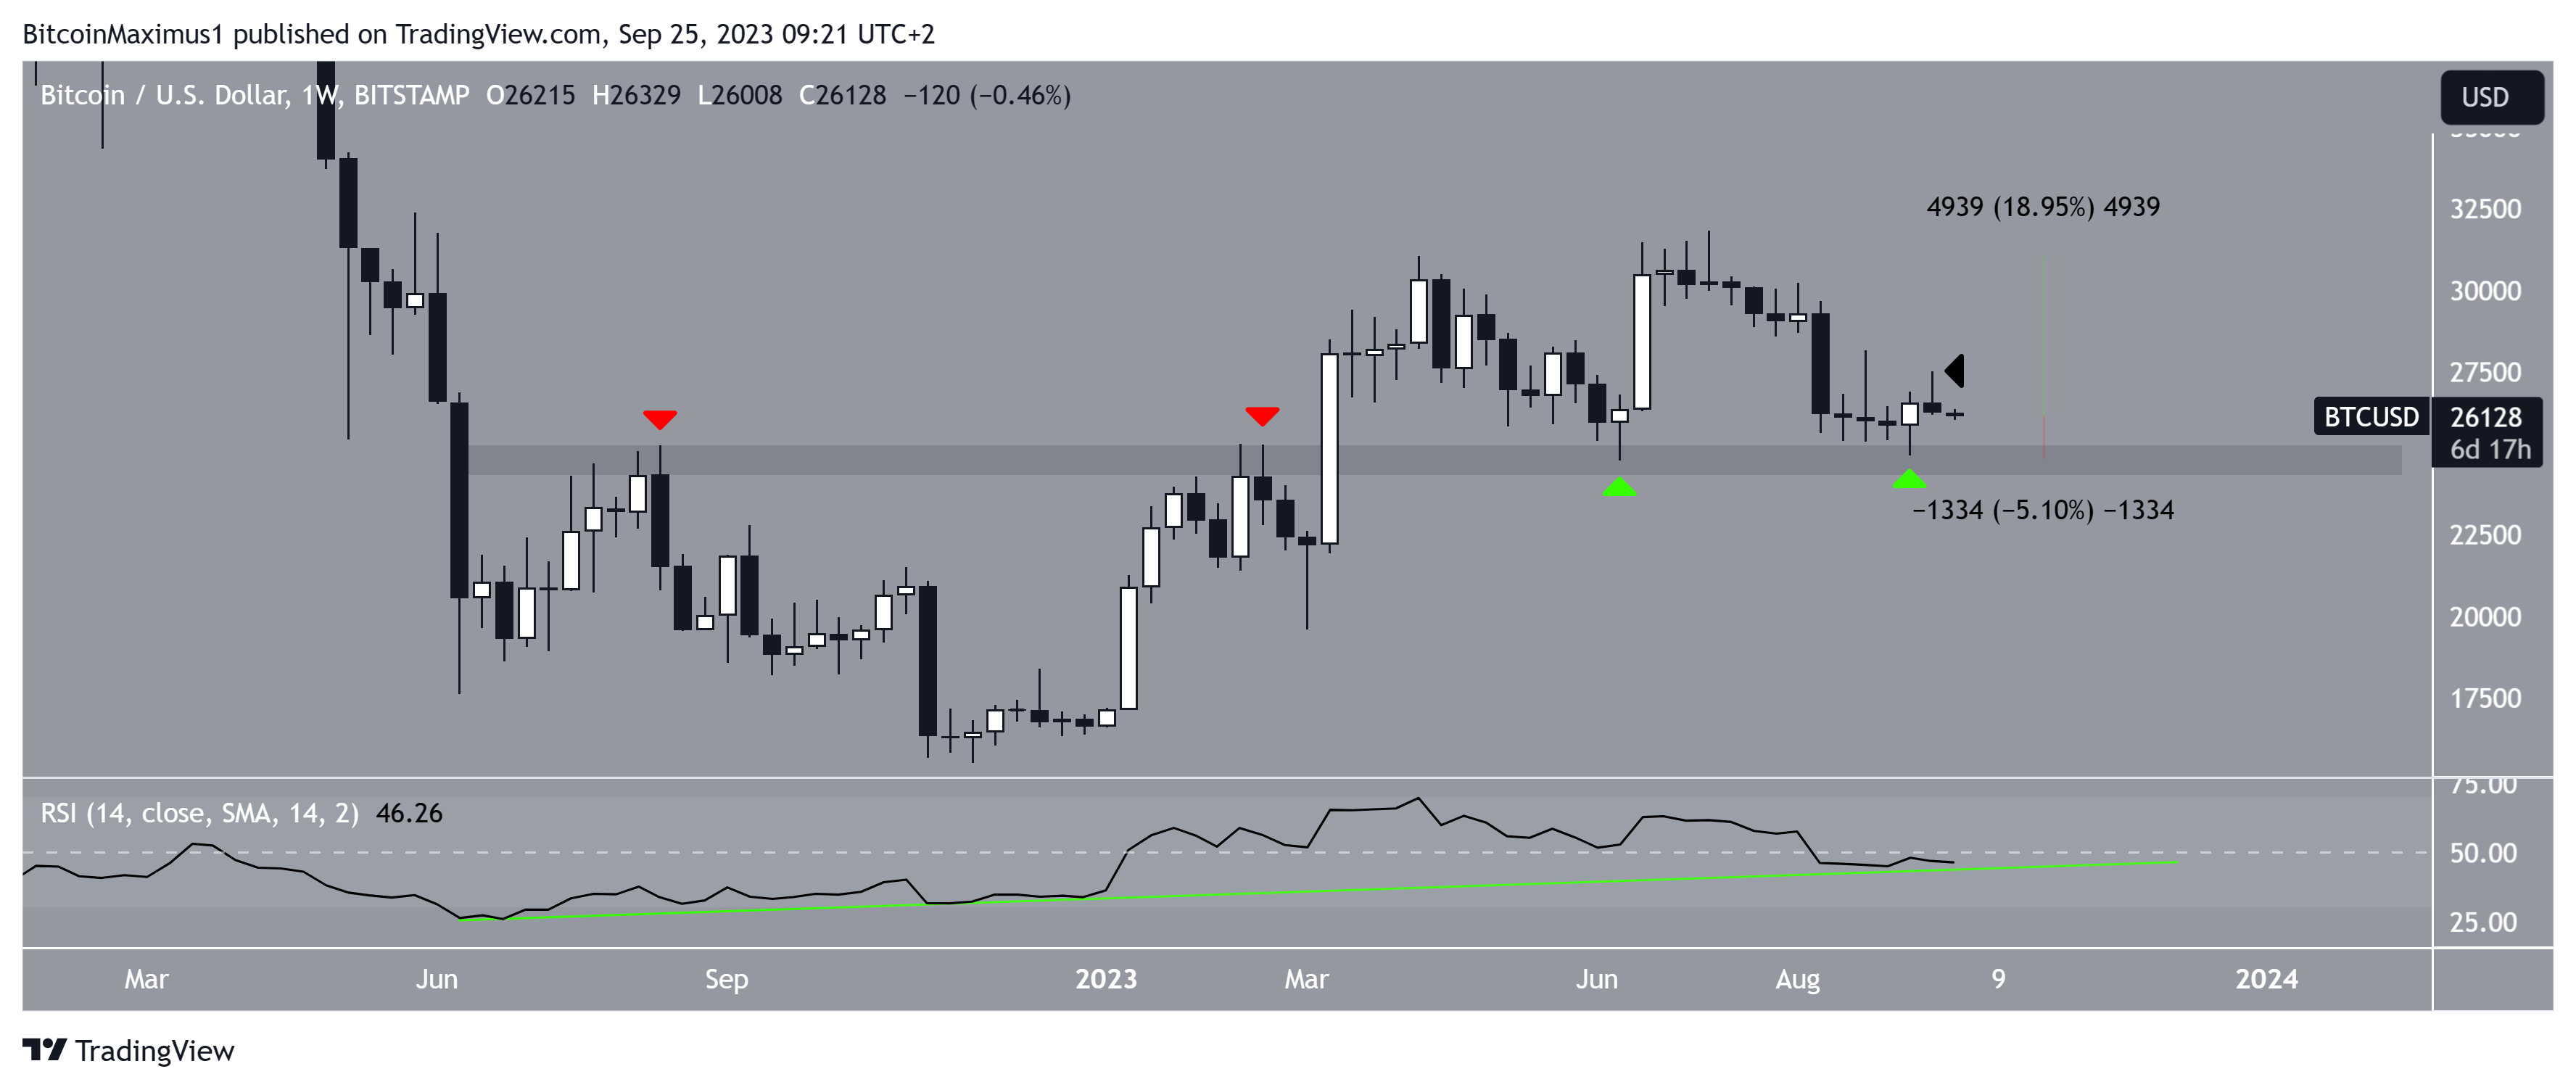
Similar to the price action, the weekly RSI is undetermined. When evaluating market conditions, traders use the RSI as a momentum indicator to determine if a market is overbought or oversold and to decide whether to accumulate or sell an asset.
Bulls still have an advantage if the RSI reading is above 50 and the trend is upward. But, if the reading is below 50, the opposite is true.
Currently, the RSI is slightly below the 50-line even though it is still above the bullish divergence trendline that started in July 2022. Since the initial bullish divergence catalyzed the current upward movement, the trend can still be considered bullish if the trendline does not break.
Will the Weekly BTC Price Break Out Above Resistance?
The technical analysis for the daily timeframe also gives conflicting signs. On the bullish side, the price reclaimed the $25,600 horizontal area after deviating below it on September 11 (green circle).
More bearishly, the price failed to break out from the descending resistance line in place since the yearly high. Rather, the line caused a rejection on September 19 (red icon).
Like the weekly timeframe, the daily RSI is close to the 50-line. Additionally, the bullish divergence trendline that caused the reclaim of the $25,600 area is still intact, currently being at 41.
In the daily timeframe, the closest support is at $25,600, an area that is 3% below the current Bitcoin price. Besides the resistance line, the $29,250 resistance area is 12% above the current price.
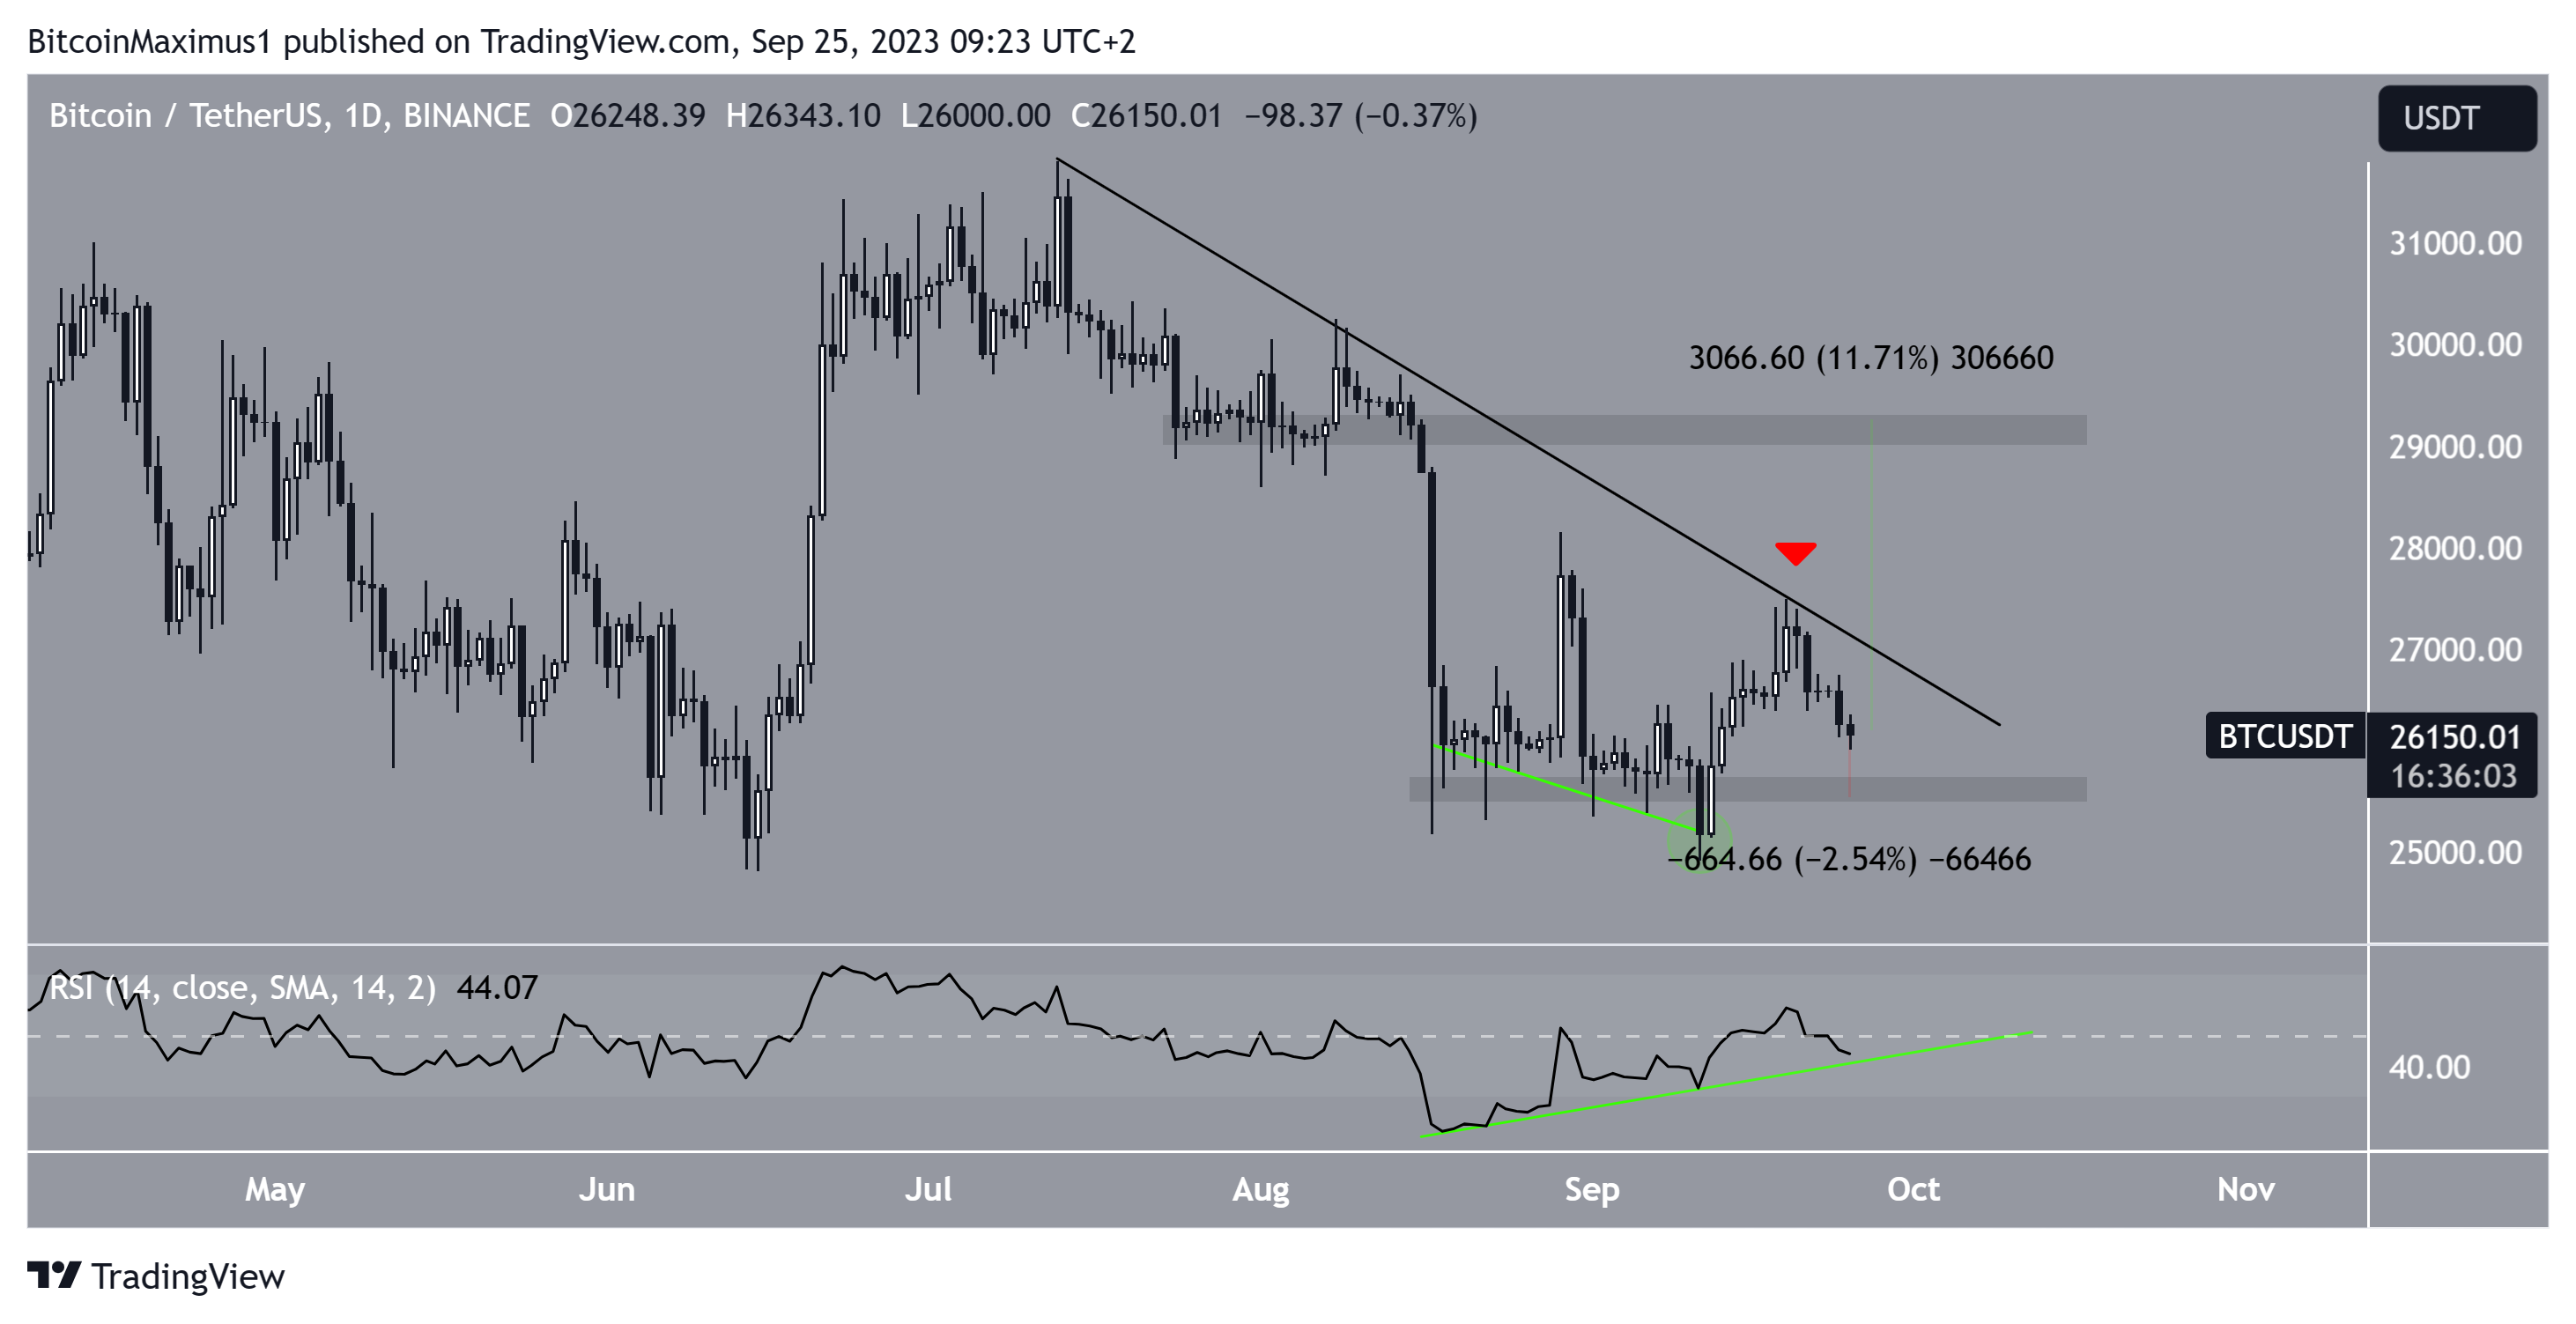
Therefore, the near-term BTC price will be determined by whether the price breaks out from the descending resistance line or breaks down below the $25,600 area instead.
In case of a breakout, at least a 10% increase to $29,250 will be expected. On the other hand, a breakdown below $25,600 can cause a drop to $24,800.


