The XRP price is attempting to break out from a long-term symmetrical triangle. Doing so would likely accelerate the rate of increase. However, there is no decisive XRP news yet regarding the Ripple vs. SEC case.
Even though there hasn’t been a settlement yet, the case took a twist after Ripple filed a motion opposing a previous filing by “Investment Banker Declarant,” who is seeking to keep his information confidential.
The crypto community is eagerly awaiting positive XRP news since the settlement could impact how all other crypto assets will be regulated in the future.
Bullish Long-Term Movement
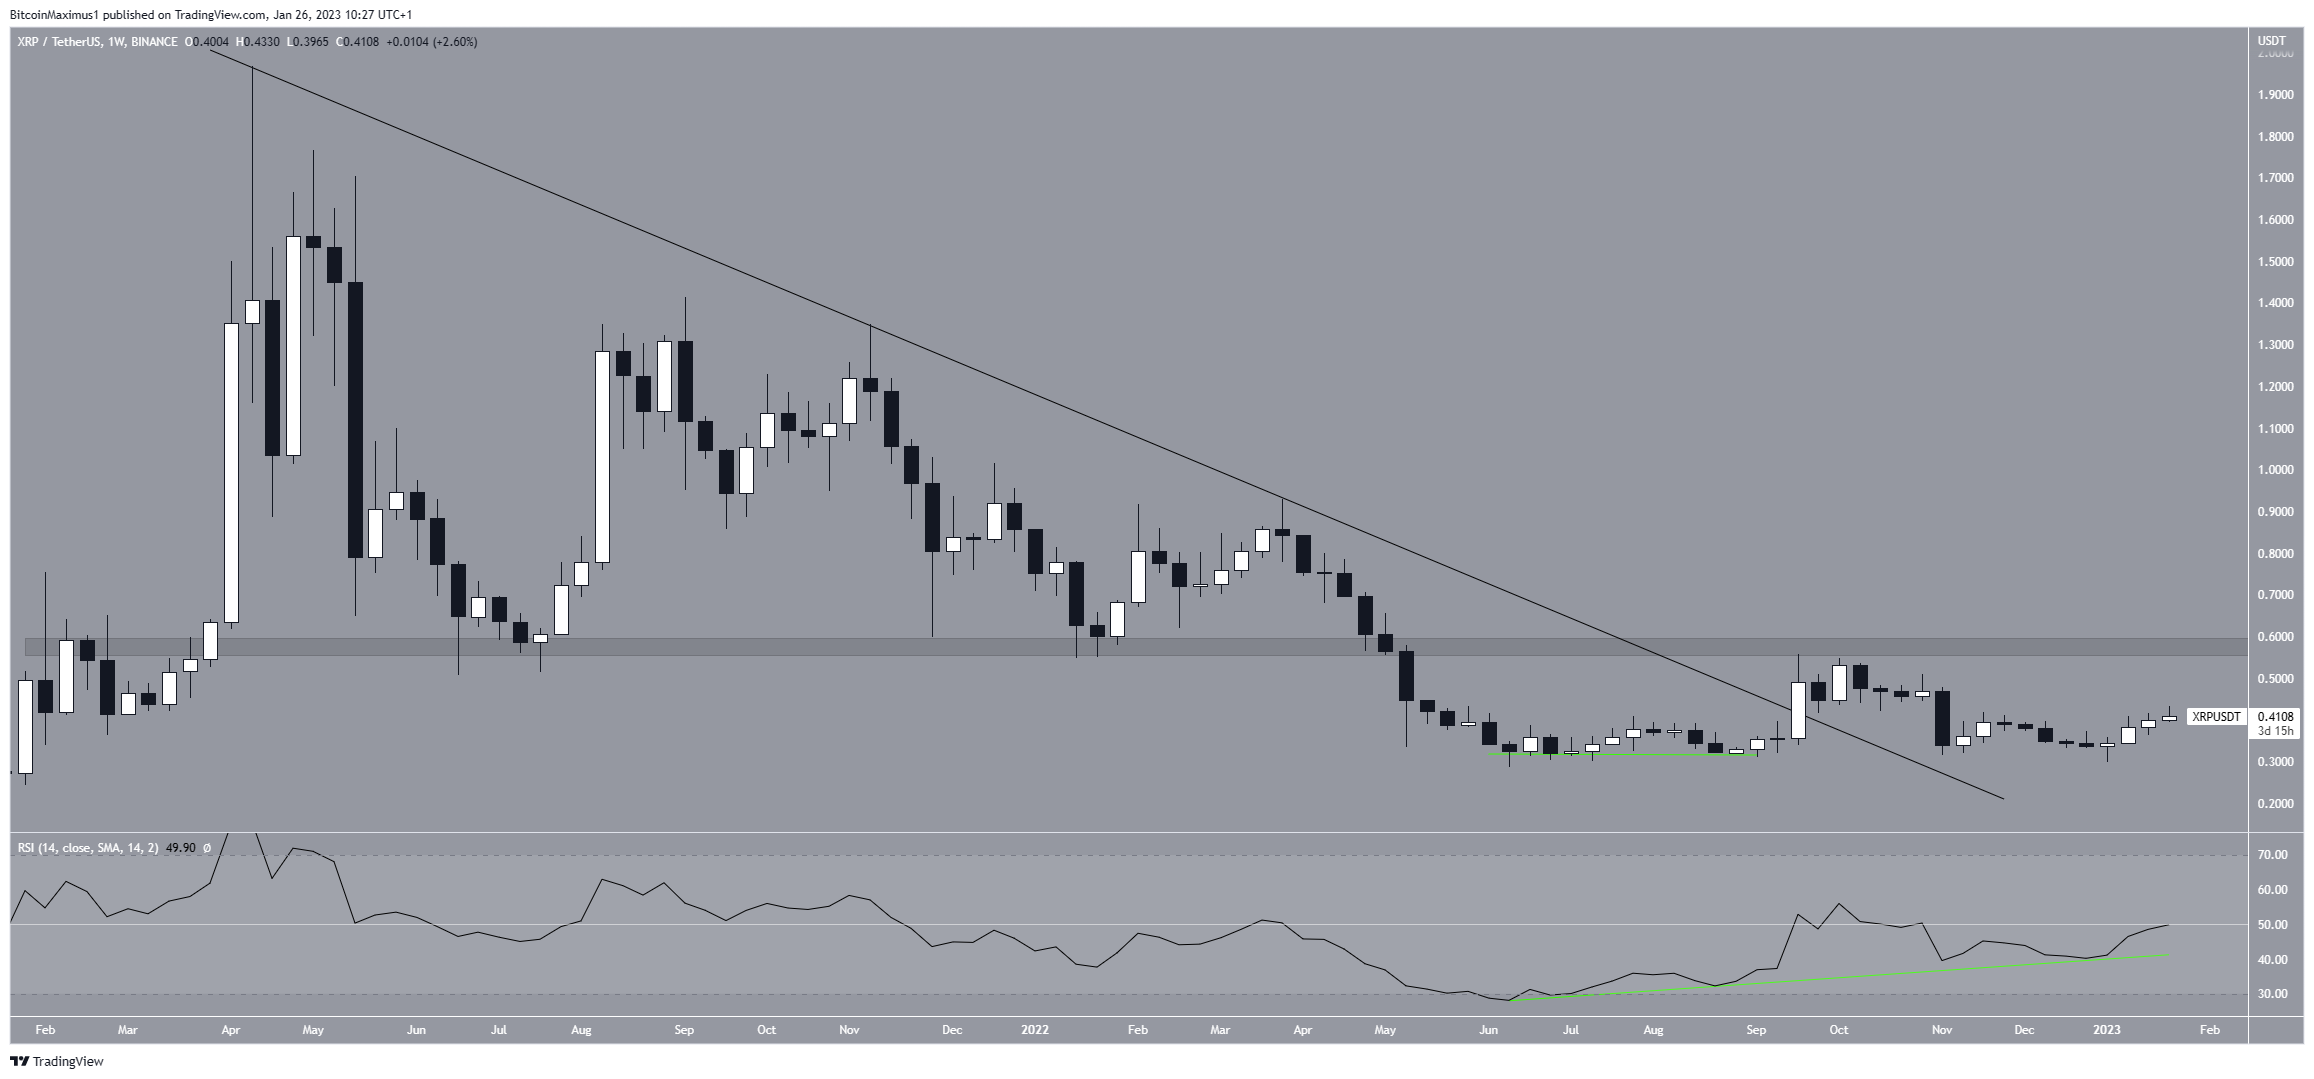
The XRP price had decreased below a descending resistance line since April 2021. The downward movement led to a low of $0.287 in June 2022.
Afterward, fueled by a bullish divergence in the weekly RSI (green line), the price initiated an upward movement and broke out from the resistance line in Sept. However, it failed to sustain its upward trend and is now trading below its breakout level.
Despite the failure to launch, the bullish divergence trend line in the RSI is still intact. Therefore, it is still possible that the price will move toward its $0.58 horizontal resistance area. A breakout above it could accelerate the upward movement toward an average price of $0.90.
On the other hand, a weekly close below $0.30 would be bearish and could send the XRP token price toward $0.20.

XRP Price Prediction for Feb: Breakout From Triangle Could Confirm Upward Movement
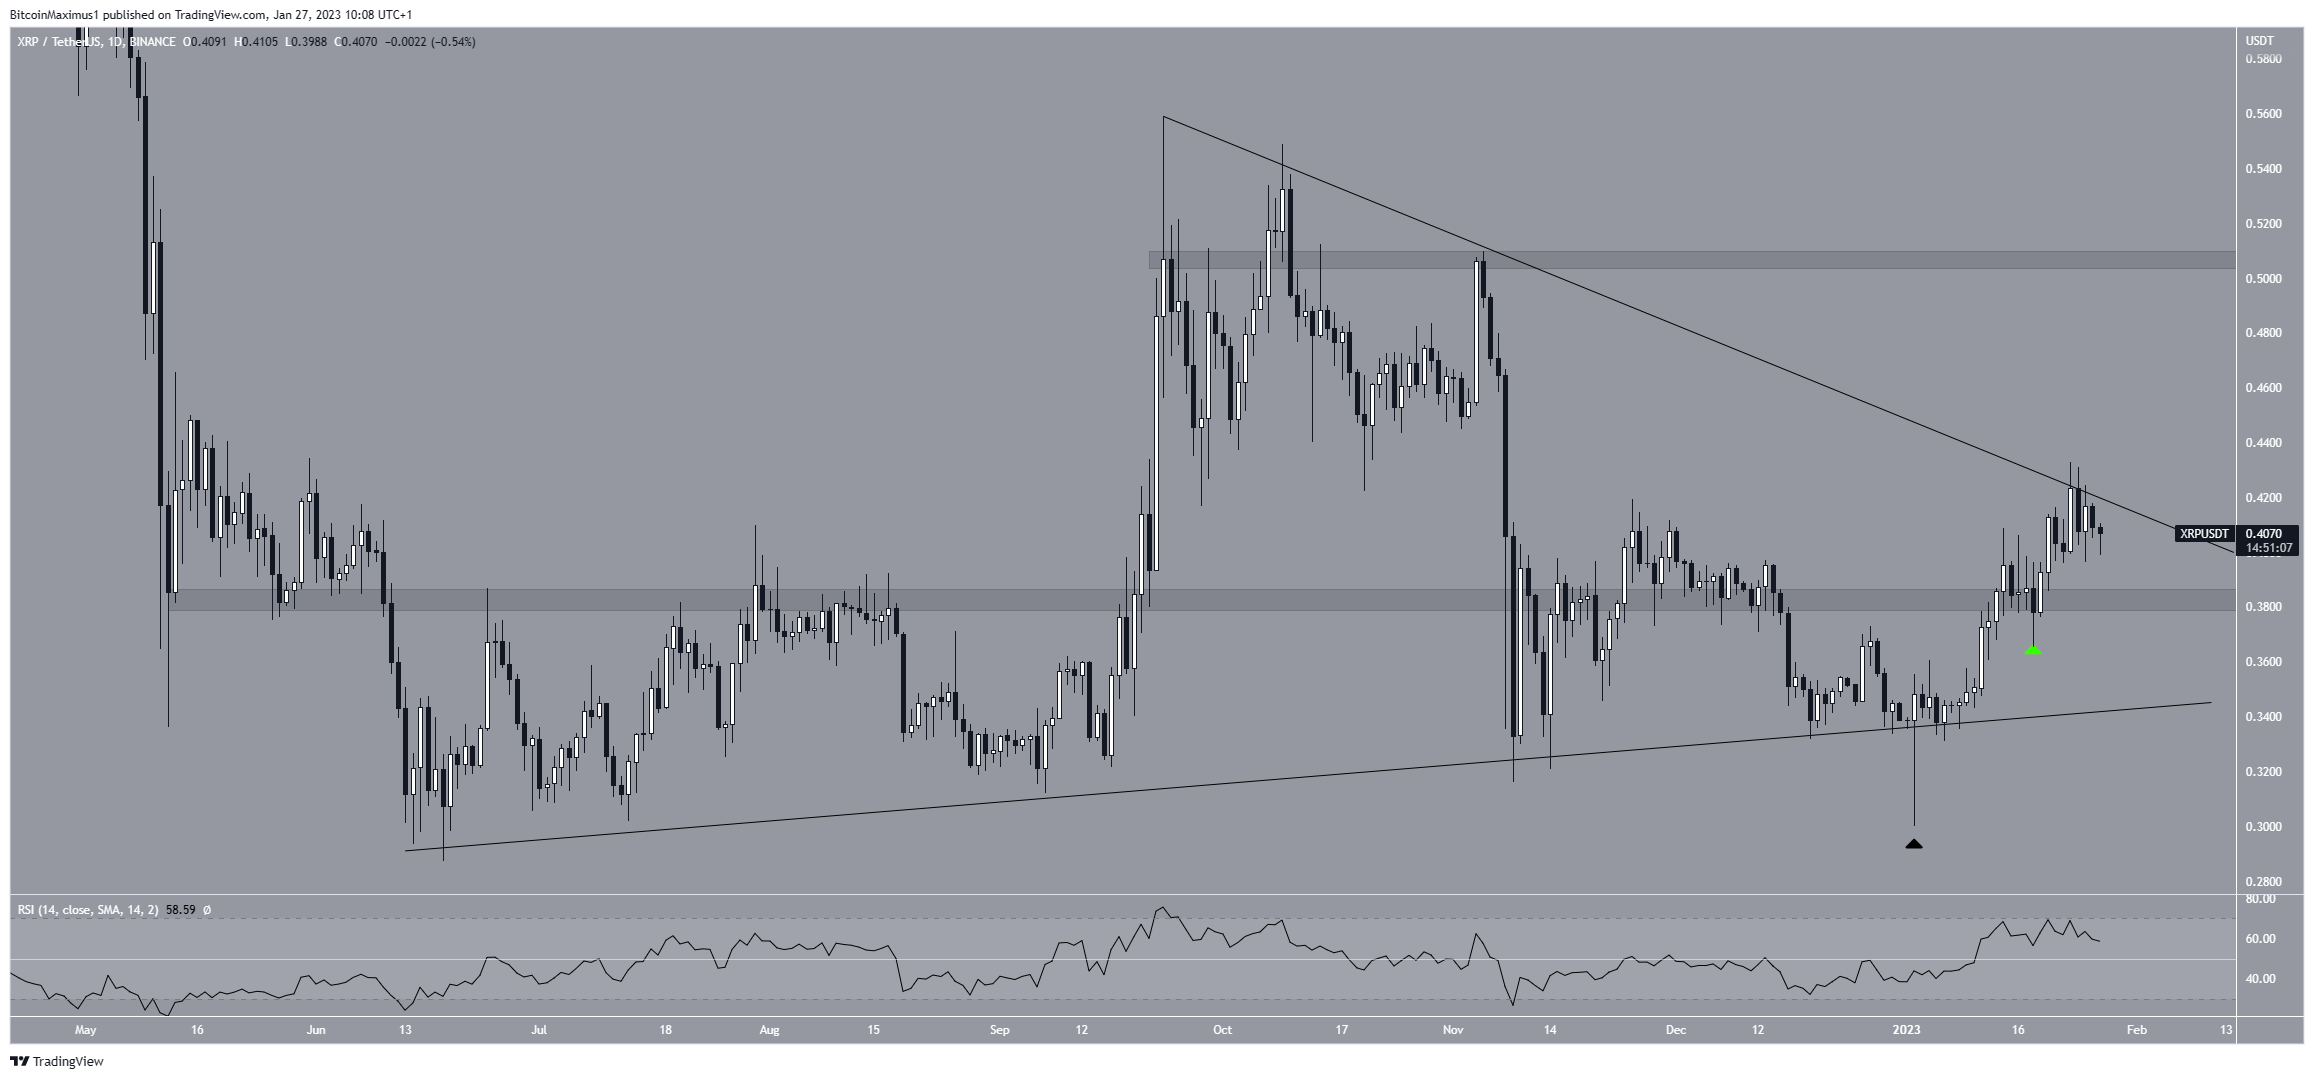
The technical analysis from the daily chart shows that the XRP price movement has been contained in a symmetrical triangle since June 2022. Even though the symmetrical triangle is considered a neutral pattern, the price action shows various bullish signs. Therefore, it gives a bullish XRP price prediction for Feb.
Firstly, the XRP price created a massive bullish hammer candlestick on Jan. 2 (black icon). The candlestick saved a breakdown from the triangle and began the ongoing upward movement. Next, the XRP price reclaimed the $0.385 horizontal area and validated it as support (green icon). It has attempted to break out from the triangle over the past 24 hours.
The daily RSI is above 50, increasing, and has not generated bearish divergence. Therefore, a breakout will likely occur. If it does, the next resistance would be at $0.505.
On the other hand, a close below $0.385 would invalidate this bullish XRP forecast and likely take the price back to $0.340.

To conclude, the most likely XRP price forecast is a breakout from the triangle and an increase to $0.505. On the other hand, a daily close below $0.385 would invalidate this bullish outlook and could take the XRP price back to the ascending support line at $0.340.
For BeInCrypto’s latest crypto market analysis, click here.
Disclaimer
In line with the Trust Project guidelines, this price analysis article is for informational purposes only and should not be considered financial or investment advice. BeInCrypto is committed to accurate, unbiased reporting, but market conditions are subject to change without notice. Always conduct your own research and consult with a professional before making any financial decisions. Please note that our Terms and Conditions, Privacy Policy, and Disclaimers have been updated.


