XRP’s price is facing uncertainty regarding its future. This is because two distinct signals can be observed by looking at the price chart and the on-chain performance.
Will the XRP bow to the bears or move in favor of the bulls?
Ripple Price Rise Substantiates Market Top Conditions
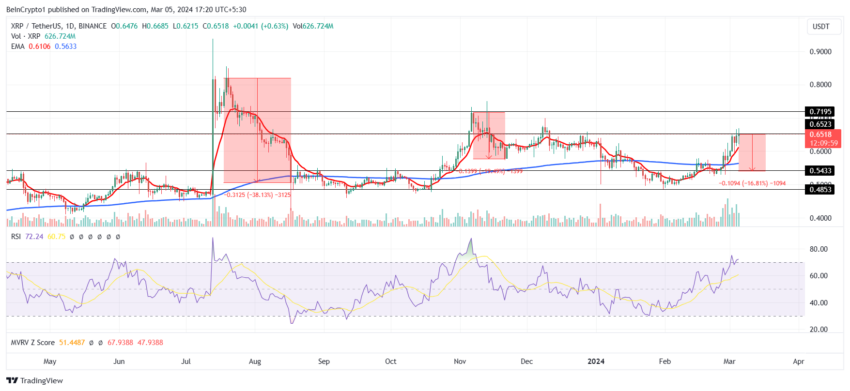
Despite not creating ripples on the daily chart, the XRP price rose by more than 30% throughout February. The altcoin is trading at $0.651 at the time of writing, standing just below the resistance level of $0.652.
The altcoin faces two natural outcomes: breaching the resistance level or testing it as a support floor. Or it could fail to break through the barrier and witness a correction. The development in the value of the cryptocurrency supports the latter outcome.
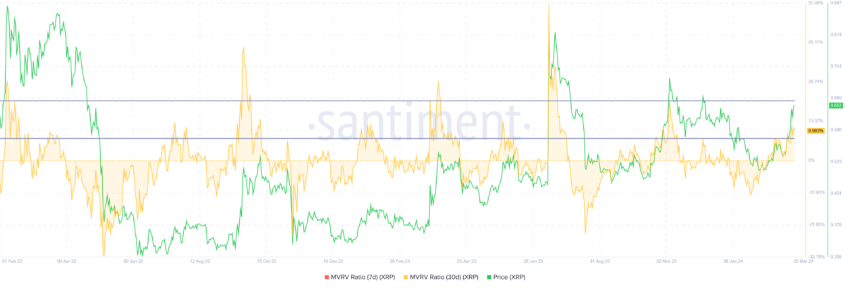
The Market Value to Realized Value (MVRV) ratio is an indicator for evaluating investors’ average profit or loss upon acquiring an asset. Specifically, the 30-day MVRV ratio offers insight into the average profit or loss of investors who purchased within the previous month.
Read More: Ripple XRP Price Prediction 2024/2025/2030
In the case of Ripple, the current 30-day MVRV stands at 9.9%, indicating a 9.9% profit for investors who bought XRP in the past month. Such profits suggest that XRP meets market-top conditions. Consequently, these investors may sell their holdings to capitalize on their profits, potentially triggering a sell-off.

Historical data suggests that when the MVRV reaches 7.4% to 20.2%, Ripple has often undergone significant corrections, identifying this range as a “danger zone” on the chart.
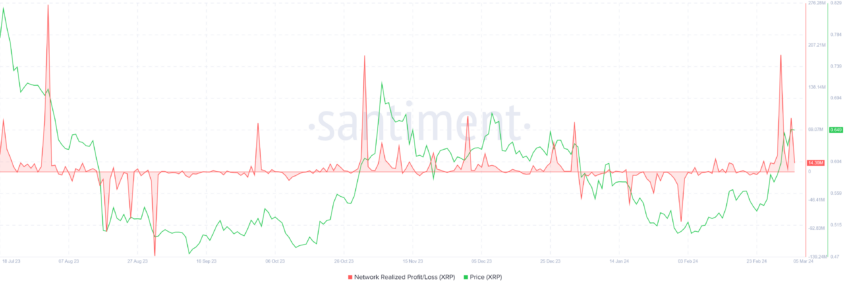
Furthermore, investors are observing the first bout of profits in over two months, making them all the more susceptible to profit-taking. The network realized profit and losses show a surge in the gains since the beginning of the month.

These factors contribute to a potential sell-off, which could result in a decline in the asset’s price.
XRP Price Prediction: The Golden Cross Defense
XRP price is witnessing the first Golden Cross in over five months, owing to the 30% increase throughout February. The Golden Cross is a bullish technical analysis pattern.
This occurs when a short-term moving average, typically the 50-day Exponential Moving Average (EMA), crosses above a long-term moving average, usually the 200-day EMA.

This event signifies a potential shift from a bearish to a bullish trend, indicating increasing momentum and investor confidence. This is often interpreted as a buy signal, anticipating further price appreciation.
However, investors must restrain from selling their holdings for the Golden Cross to be significant. Additionally, pushing through and flipping the $0.652 barrier into support would validate the cross.
But if these conditions are not met and XRP price notes a correction, the Golden Cross could fail. As is, the Relative Strength Index (RSI) is already inching closer to being overbought.
If XRP is overbought, the altcoin will correct, as noted historically. As a result, the altcoin could fall to test the $0.543 level as a support floor, marking a 16% price decline.
Disclaimer
In line with the Trust Project guidelines, this price analysis article is for informational purposes only and should not be considered financial or investment advice. BeInCrypto is committed to accurate, unbiased reporting, but market conditions are subject to change without notice. Always conduct your own research and consult with a professional before making any financial decisions. Please note that our Terms and Conditions, Privacy Policy, and Disclaimers have been updated.


