
On June 3, 2019, the XRP price reached a high of $0.465. A gradual decrease ensued and the price reached a low of $0.383 on Jun 4. The price has been increasing since.
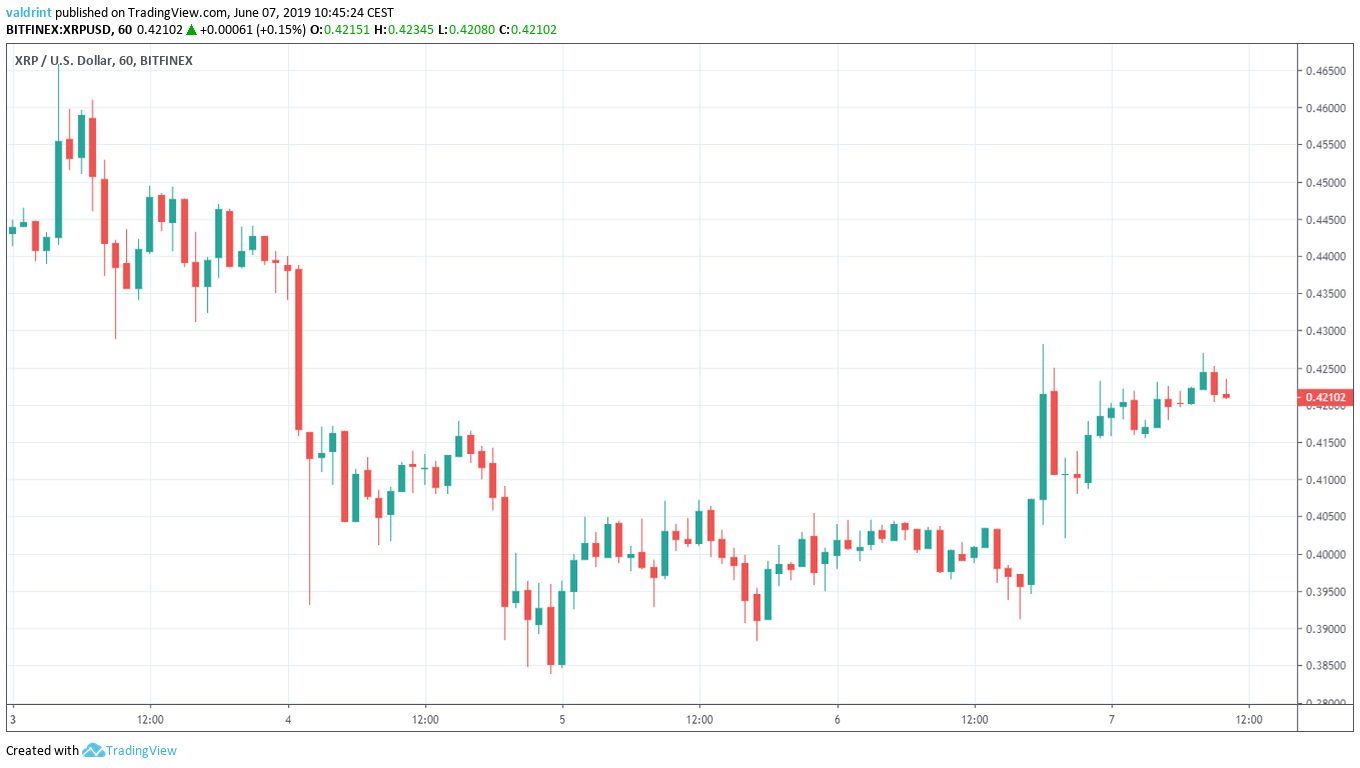
Where will it go next? Keep reading below and find out.
XRP Price: Trends and Highlights for June 7
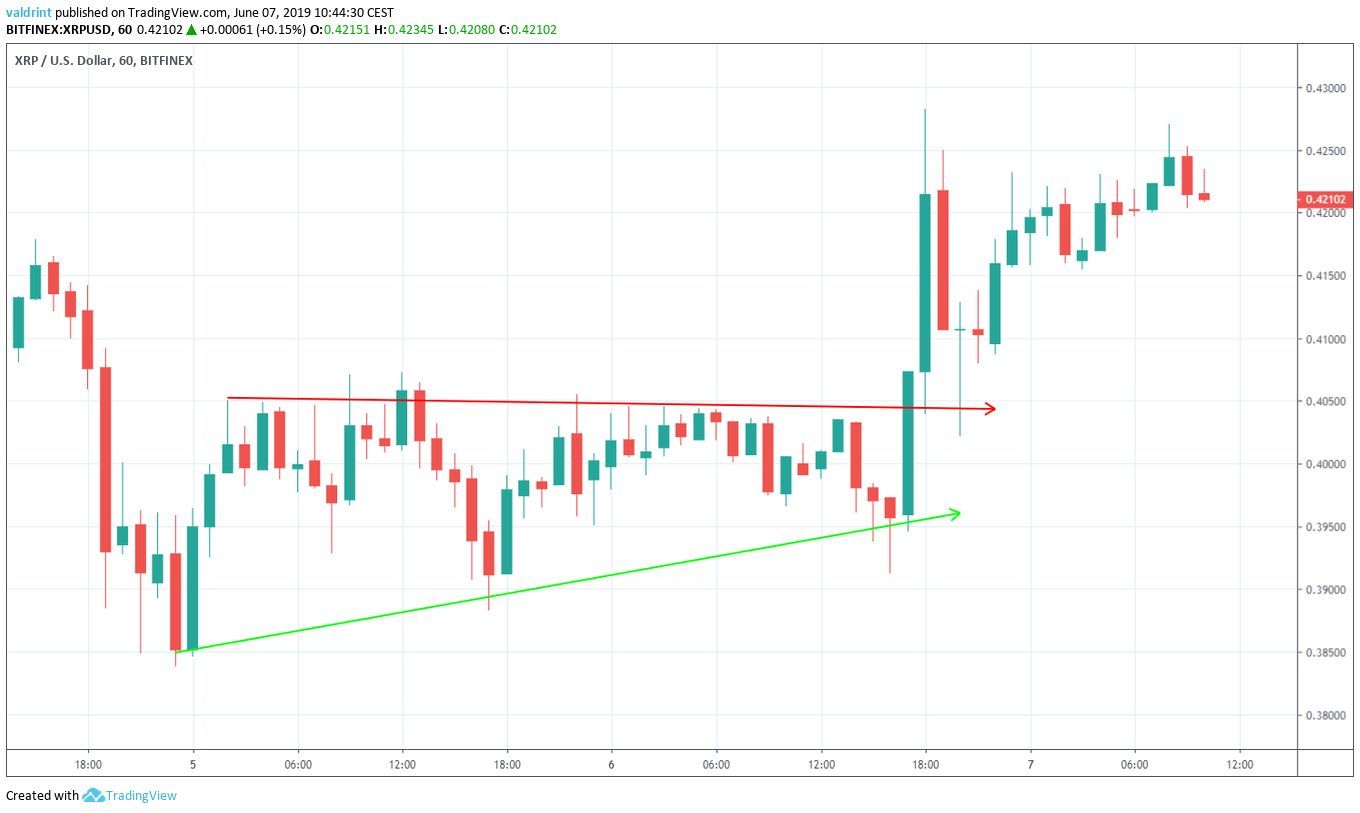
- The XRP price reached a high on June 3.
- It broke out from an ascending triangle.
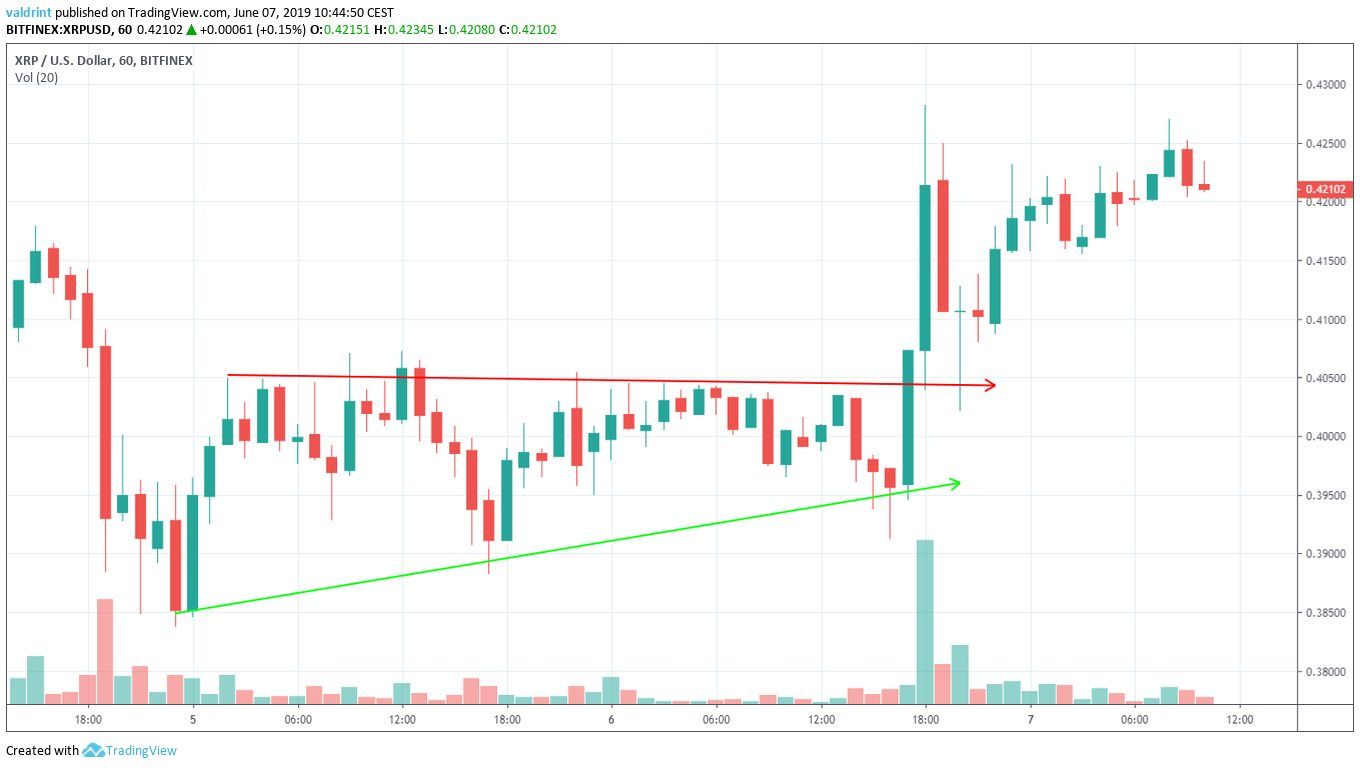
- The breakout occurred with significant volume.
- It is facing resistance from the moving averages.
- There is resistance near $0.45 and support near $0.40.
Previous Movement
XRP Price: Technical Indicators
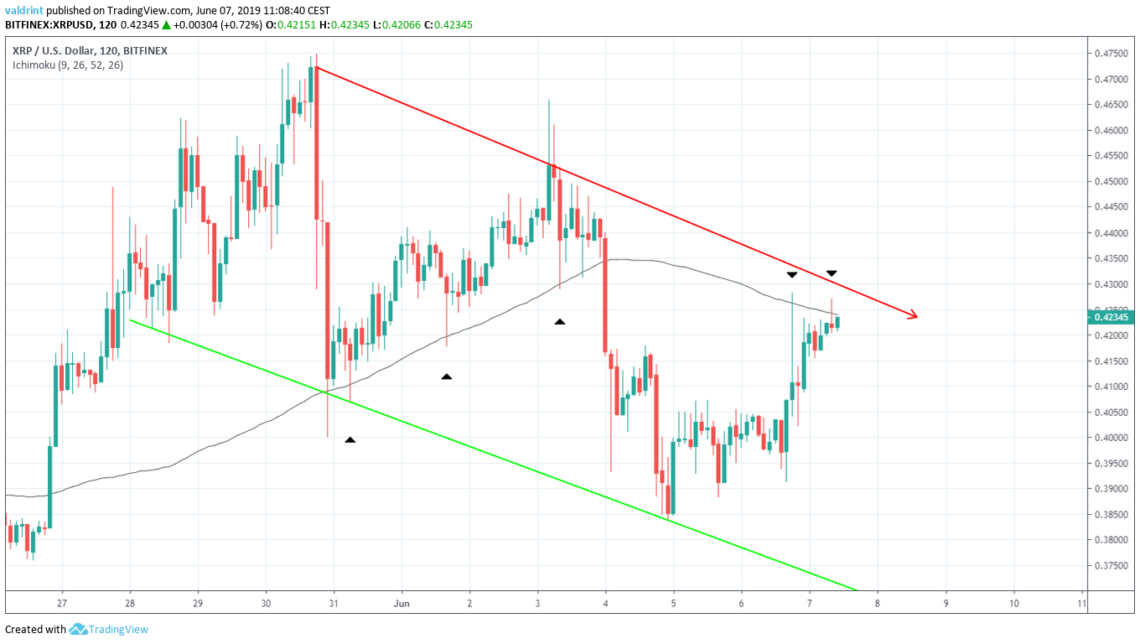
At the time of writing, the XRP price was struggling to break out above the 200-period MA.
Previously, the MA provided support on May 31, June 1 and June 3. This is the second attempt at breaking out above the MA. A breakout would also indicate that the price would break out above the descending channel.
As stated in our June 5 analysis, due to the long-term bearish divergence that has occurred, we believe this to be unlikely.
Reversal Areas
One support area and one resistance area is traced for XRP below.
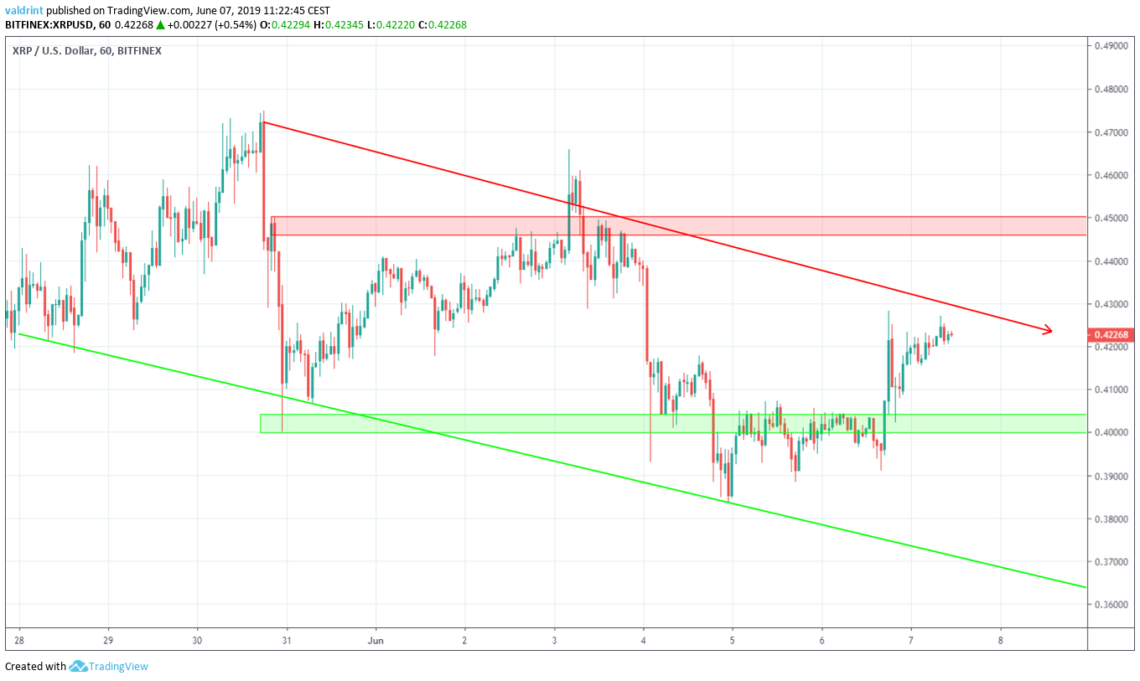
The closest support area is found near $0.40. If the XRP price gets rejected by the resistance and begins to decrease, it is likely to reach this area. The analysis of technical indicators supports this claim.
The closest resistance area is found near $0.45. If the XRP price breaks out from the channel, it is likely to provide resistance. We do not believe this to be likely.
Summary
To conclude, the XRP price made a high on May 30 and is currently trading inside a descending channel. Furthermore, it recently broke out from a short-term ascending triangle. It is facing resistance from the moving averages and the technical indicators support a decrease.
Do you think the XRP price will break out from the channel? Let us know in the comments below.
Disclaimer: This article is not trading advice and should not be construed as such. Always consult a trained financial professional before investing in cryptocurrencies, as the market is particularly volatile.
