


On May 30, the XRP price reached a high of $0.474. A rapid decrease ensued. The next day, the price reached a low of $0.40. After a gradual increase which took it to a high near $0.47, the price began another downward move on Jul 3.
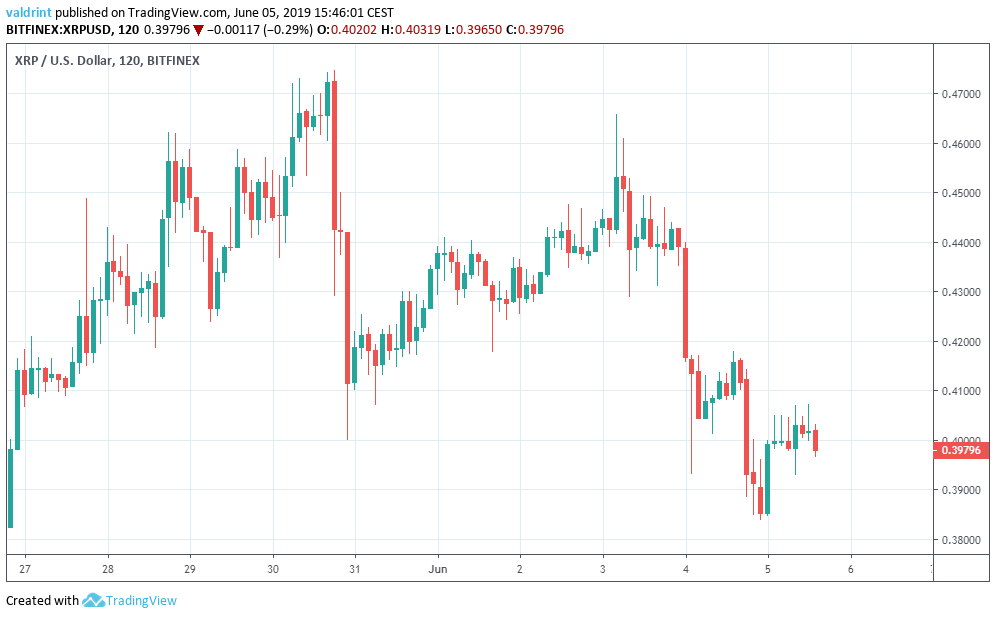
The XRP price reached lows near $0.38 on Jul 5. Will it trade above $0.40 again? Keep reading below and find out.
Ripple Price (XRP): Trends and Highlights for June 5
- The XRP price reached a high on May 30.
- It is trading inside a descending channel.
- There is bearish divergence developing in the RSI and the MACD.
- The price has made a possible double top pattern.
- The price is trading below the 10- and 20-day moving averages.
- There is resistance near $0.42 and support near $0.37.
Ripple (XRP) in a Descending Channel
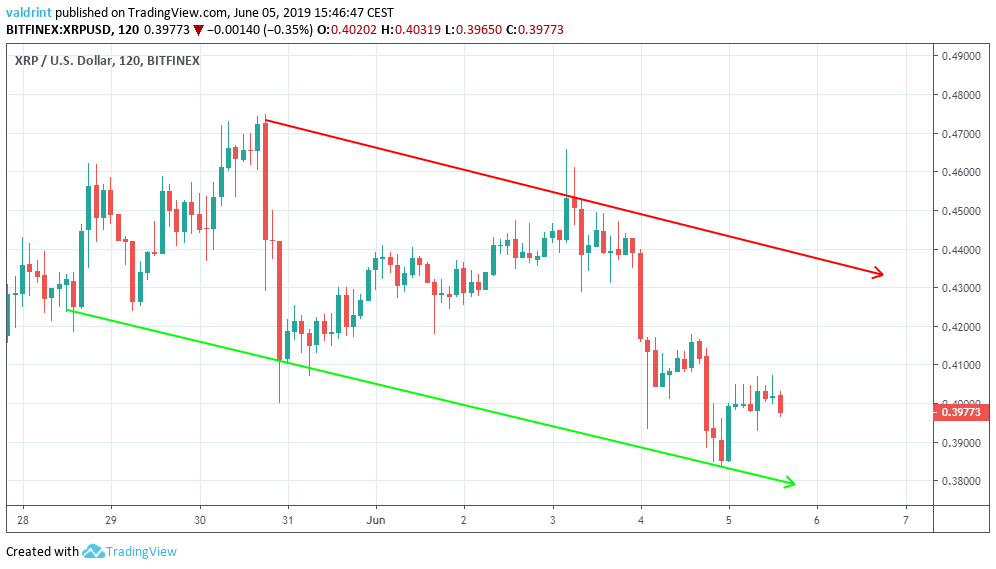 On Jun 5, the price touched the support line of the channel before beginning an upward move.
XRP Price: Technical Indicators
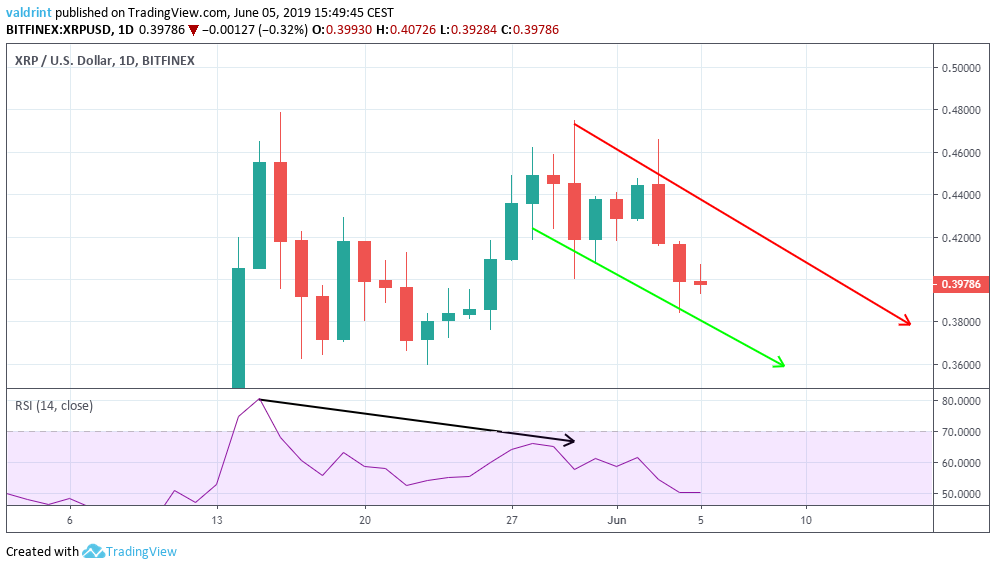
During this same interval, the RSI reached lower highs. This is known as bearish divergence and often precedes price decreases.
The divergence gains more validity since it is occurring in a double top, which is a bearish reversal pattern.
Furthermore, this view is supported by the moving averages, which are outlined in the graph below.
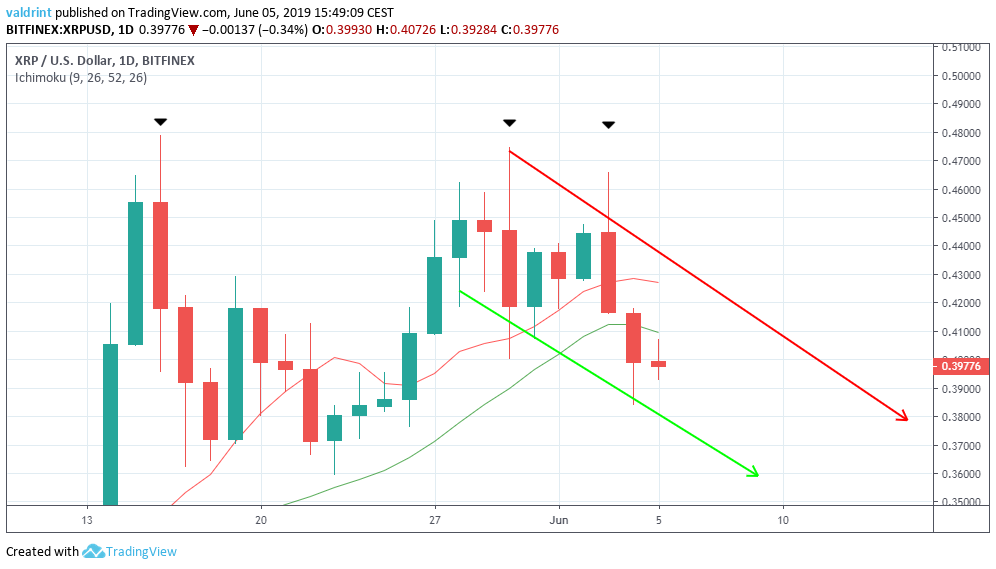
On Jun 3, the price began a rapid downward move, which created a bearish engulfing candle. The continuing decrease on Jun 4 brought the price below both MAs, which are now providing resistance to the XRP price.
However, a bearish cross between them is yet to occur.
Furthermore, the three daily candles with values above $0.45 have been characterized with long upper wicks. This is a sign that there is selling pressure above that level.
The use of these indicators supports further price decreases.
Reversal Areas
One support area and one resistance area is traced for Ripple (XRP) below.
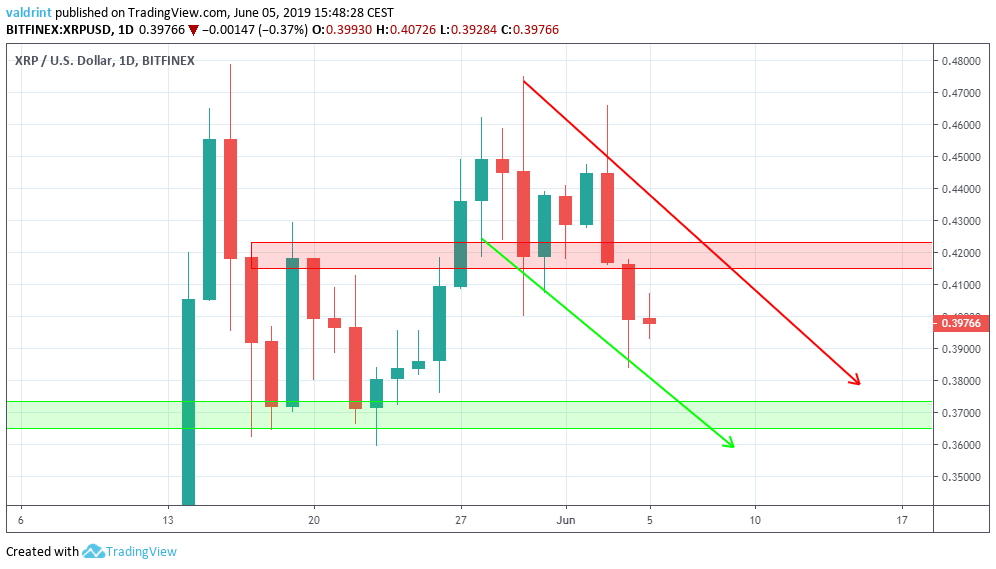
The closest support area is found near $0.37. If the XRP price keeps decreasing at the rate predicted by the channel, it will reach this area on Jun 10. The analysis of technical indicators supports this hypothesis.
The closest resistance area is found near $0.42. It coincides with the resistance line of the wedge. A significant increase against the current trend would be required for the Ripple price to reach this area. We do not believe this to be likely.
Summary
To conclude, the Ripple price (XRP) made a high on May 30 and is currently trading inside a descending channel. Furthermore, it has created a double top pattern combined with bearish divergence in long-term timeframes. This bearish reversal pattern and the reading from the technical indicators make it likely that the price will eventually reach the support area outlined above.
What do you think will happen to the price of XRP? Let us know in the comments below.
Disclaimer: This article is not trading advice and should not be construed as such. Always consult a trained financial professional before investing in cryptocurrencies, as the market is particularly volatile.


