


On June 6, 2019, the XRP price reached a high of 3600 satoshis. A gradual decrease ensued, which intensified on June 8. On June 11, it reached lows of 2780 satoshis.
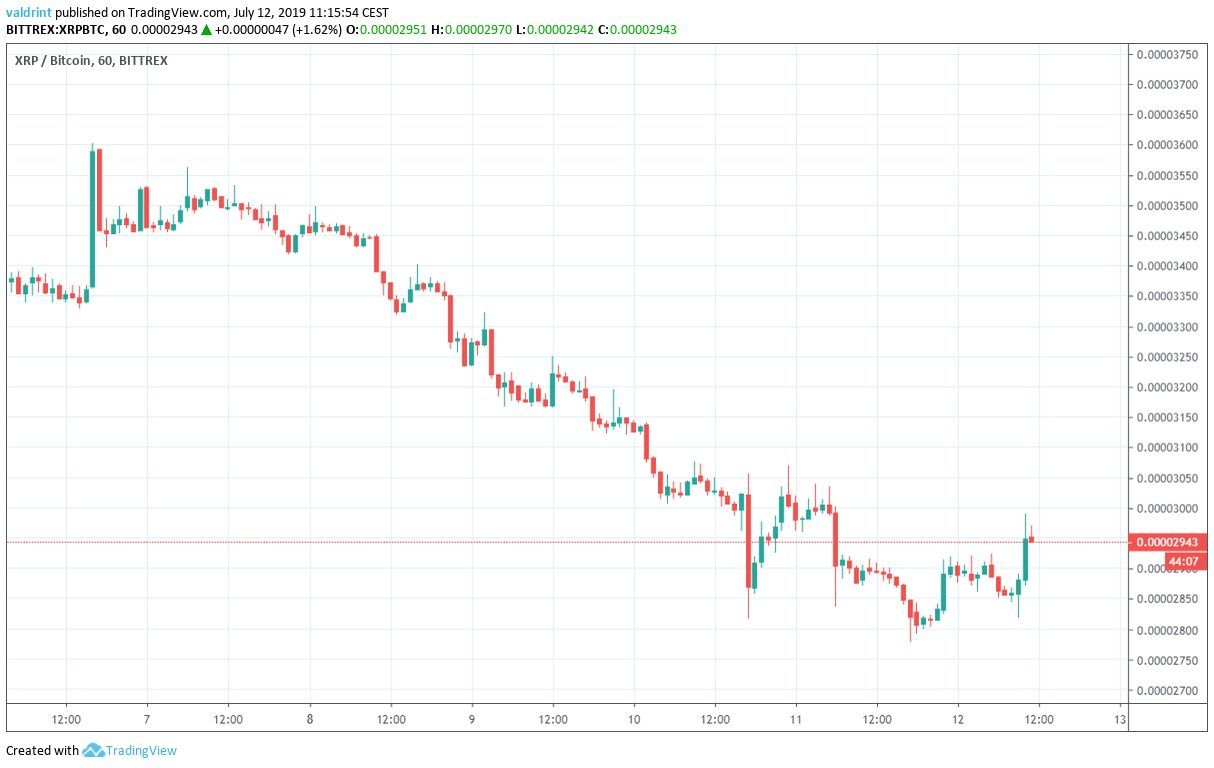
At the time of writing, it was trading near 3000 satoshis.
Where will it go next? Keep reading below in order to find out.
You can read our previous analysis here.
XRP Price: Trends and Highlights for July 12
- XRP/BTC is trading inside a descending wedge.
- There is a very strong bullish divergence developing in the short-term.
- It is following a short-term descending resistance line.
- There is strong resistance near 3500 satoshis.
XRP Price in a Descending Wedge
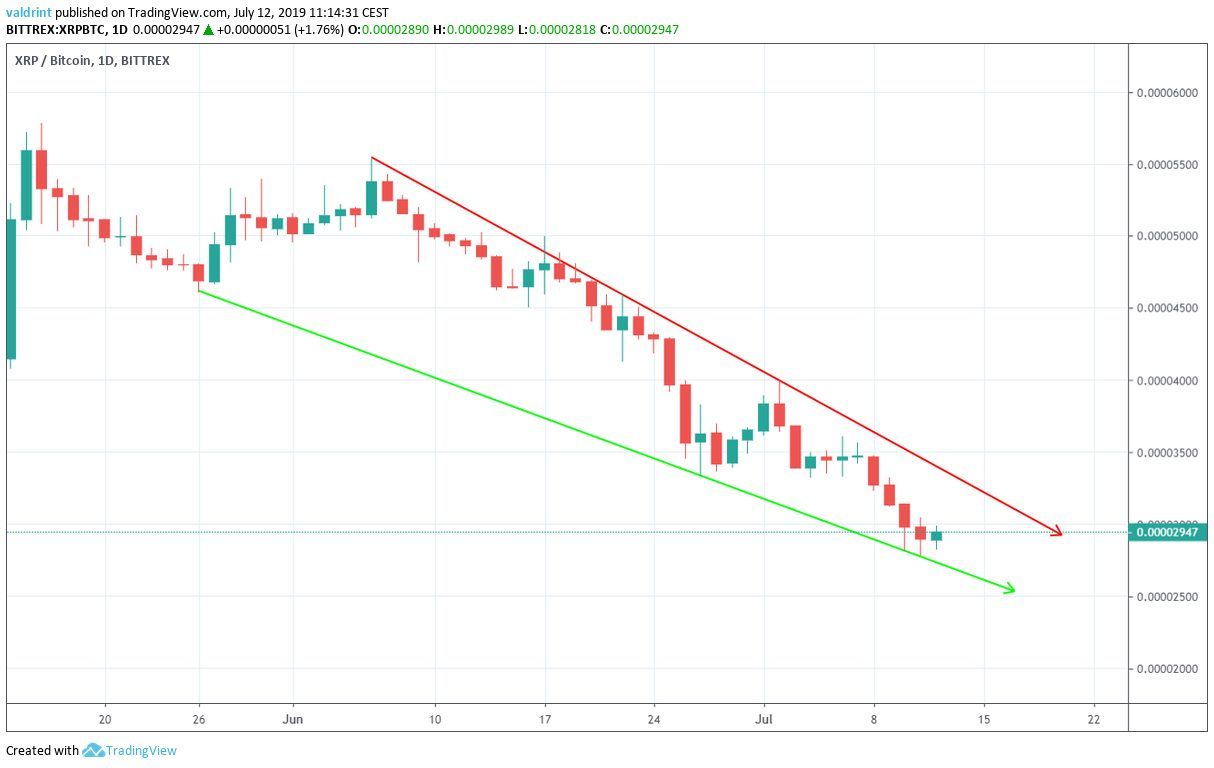
A look at the daily time-frame shows that XRP has been trading inside a descending wedge since May 26.
The descending wedge is a bullish pattern, making price breakouts more likely.
Furthermore, the RSI supports the initiation of a breakout.
As is visible below, it has been generating bullish divergence since June 25.
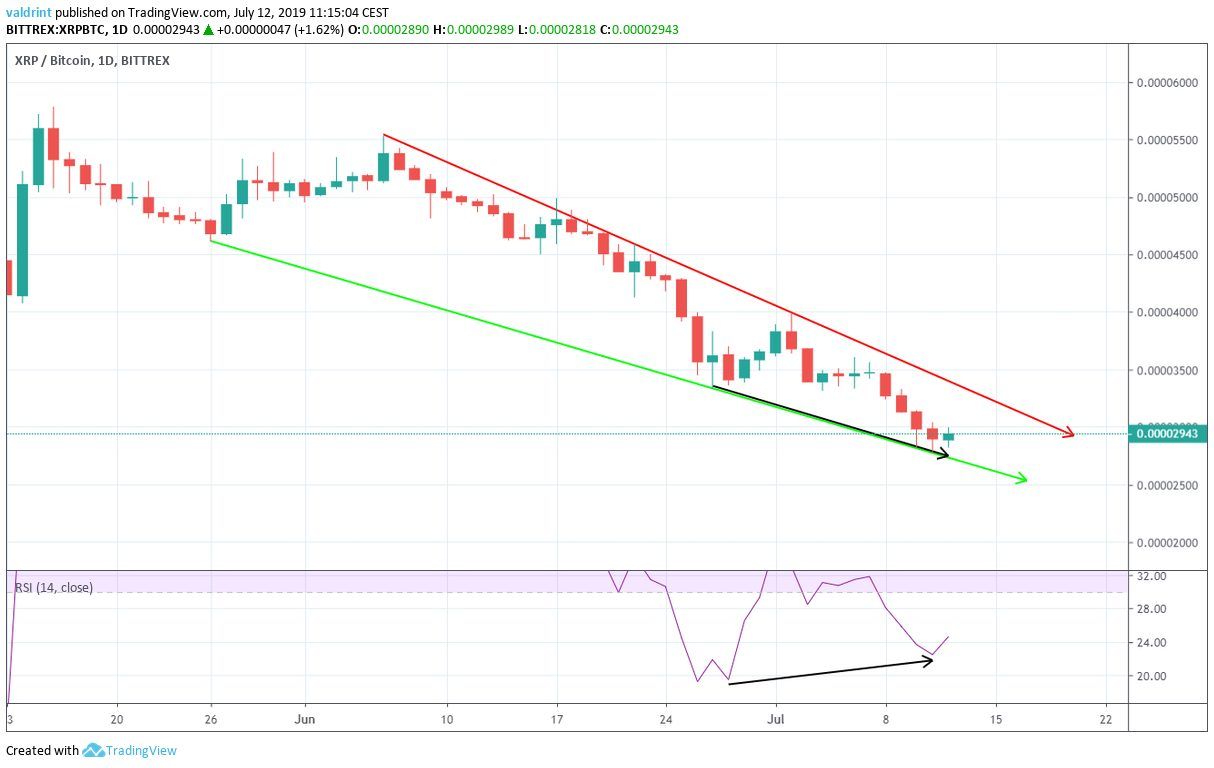
The fact that the divergence is occurring at the support line of a bullish pattern further affirms its validity.
However, it is not present in the MACD.
In order to break out from the wedge, the price would have to increase above 3500 satoshis — the level of the resistance line.
Let’s take a look in the short-term to see potential resistance levels until 3500 satoshis.
Short-Term
In the short-term, we can see that the XRP price is following a descending resistance line.
At the time of writing, it was making an attempt at a breakout.
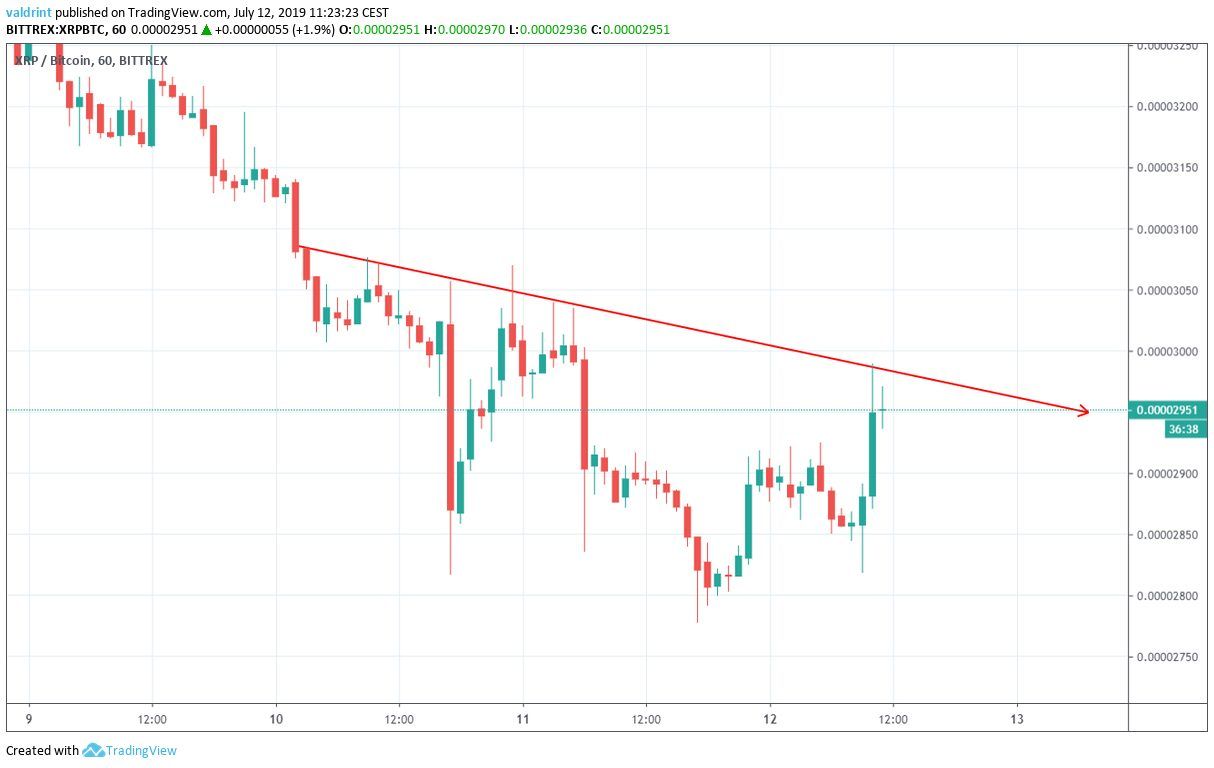
Additionally, similar to the long-term view, there has been bullish divergence developing in both the RSI and the MACD.
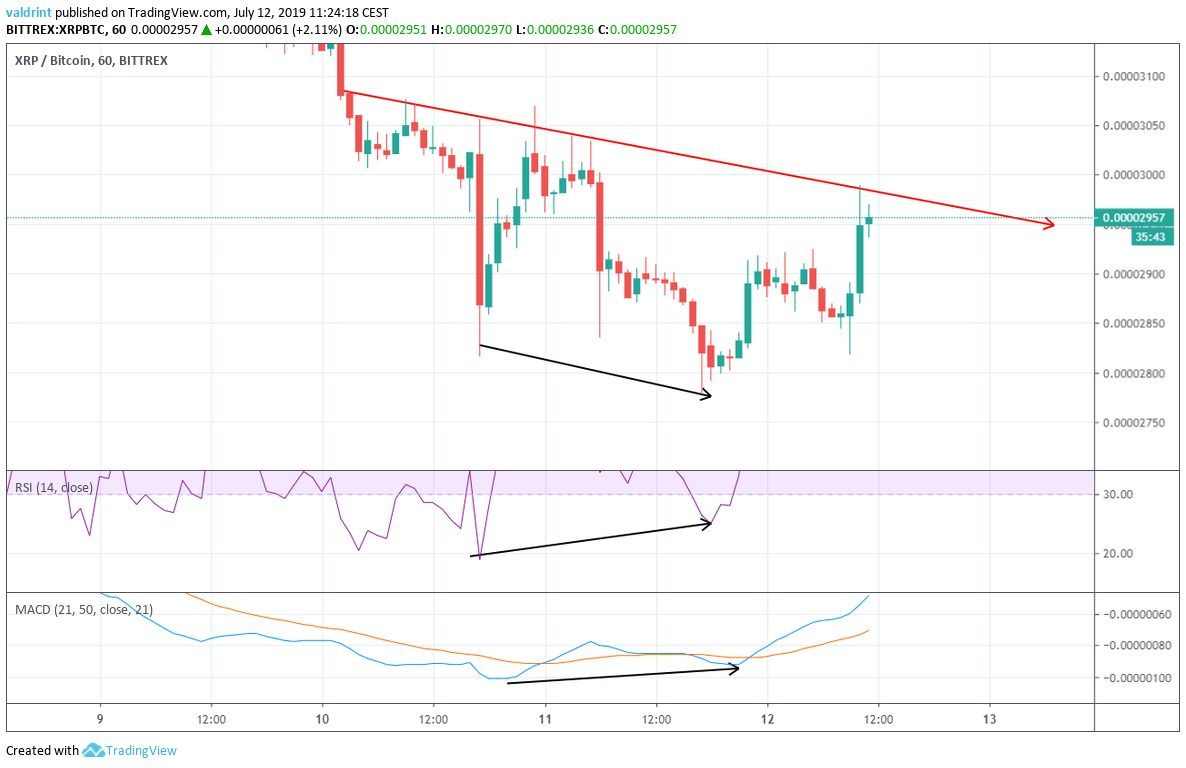
This divergence is especially noticeable during the lows of July 10 and 11.
It preceded the upward move towards the resistance line.
The combination of short- and long-term divergence makes it likely that the XRP price will break out of the resistance.
If it does, potential resistance levels are shown below:
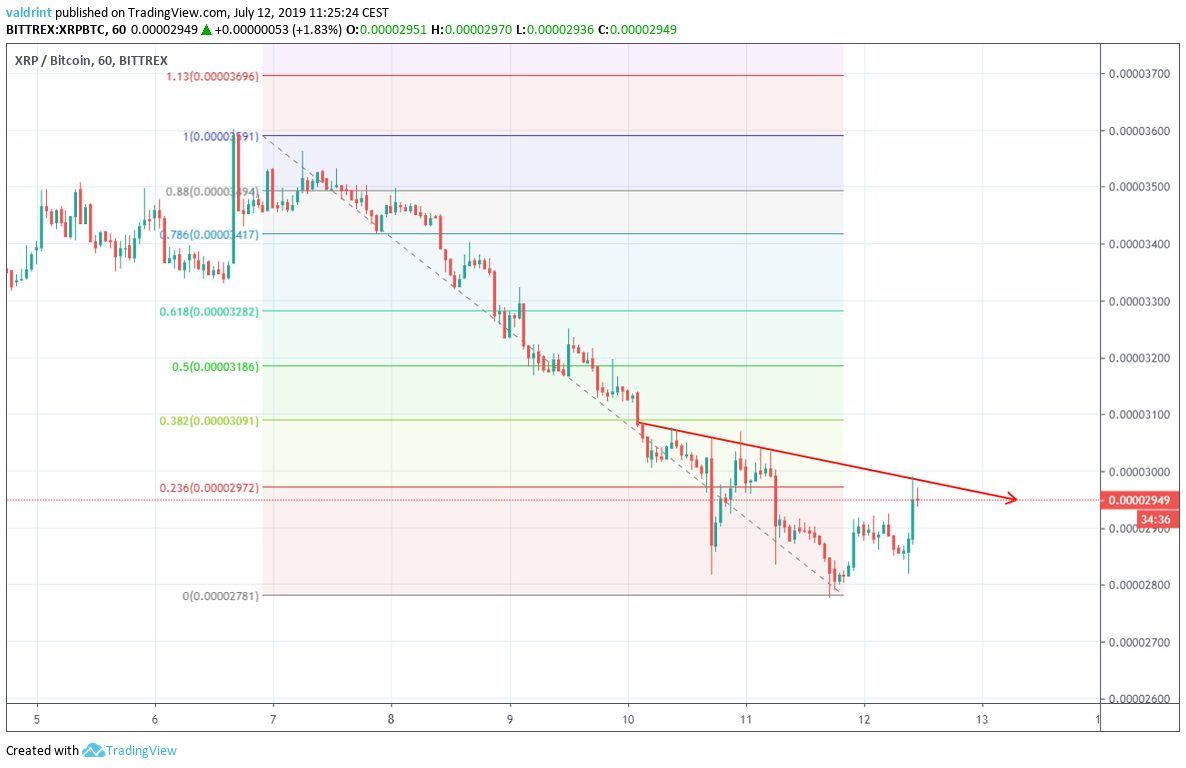
The closest resistance level is found near 3200 satoshis, given by the 0.5 fib level of the drop.
It is followed by resistance levels at 3300 and 3500 satoshis.
The final resistance level of 3500 satoshis also coincides with the resistance line of the wedge outlined in the first section.
Therefore, a breakout above it would signify a breakout from the wedge.
Summary
The XRP price is trading inside a descending wedge.
Technical indicators support the initiation of an upward move towards the resistance line of the wedge.
A breakout remains possible.
Do you think the XRP price will reach the resistance line of the wedge? Let us know in the comments below.
Disclaimer: This article is not trading advice and should not be construed as such. Always consult a trained financial professional before investing in cryptocurrencies, as the market is particularly volatile.
Images are courtesy of Shutterstock, TradingView.


