


In this article, BeInCrypto takes a look at the price movements of XRP and measures its yearly increases to see how it measures up to the growth that it’s seen in 2021.
Its most bullish year to date was 2017 when it increased by a massive 32,943%. So far in 2021, it has moved upwards by 625%.
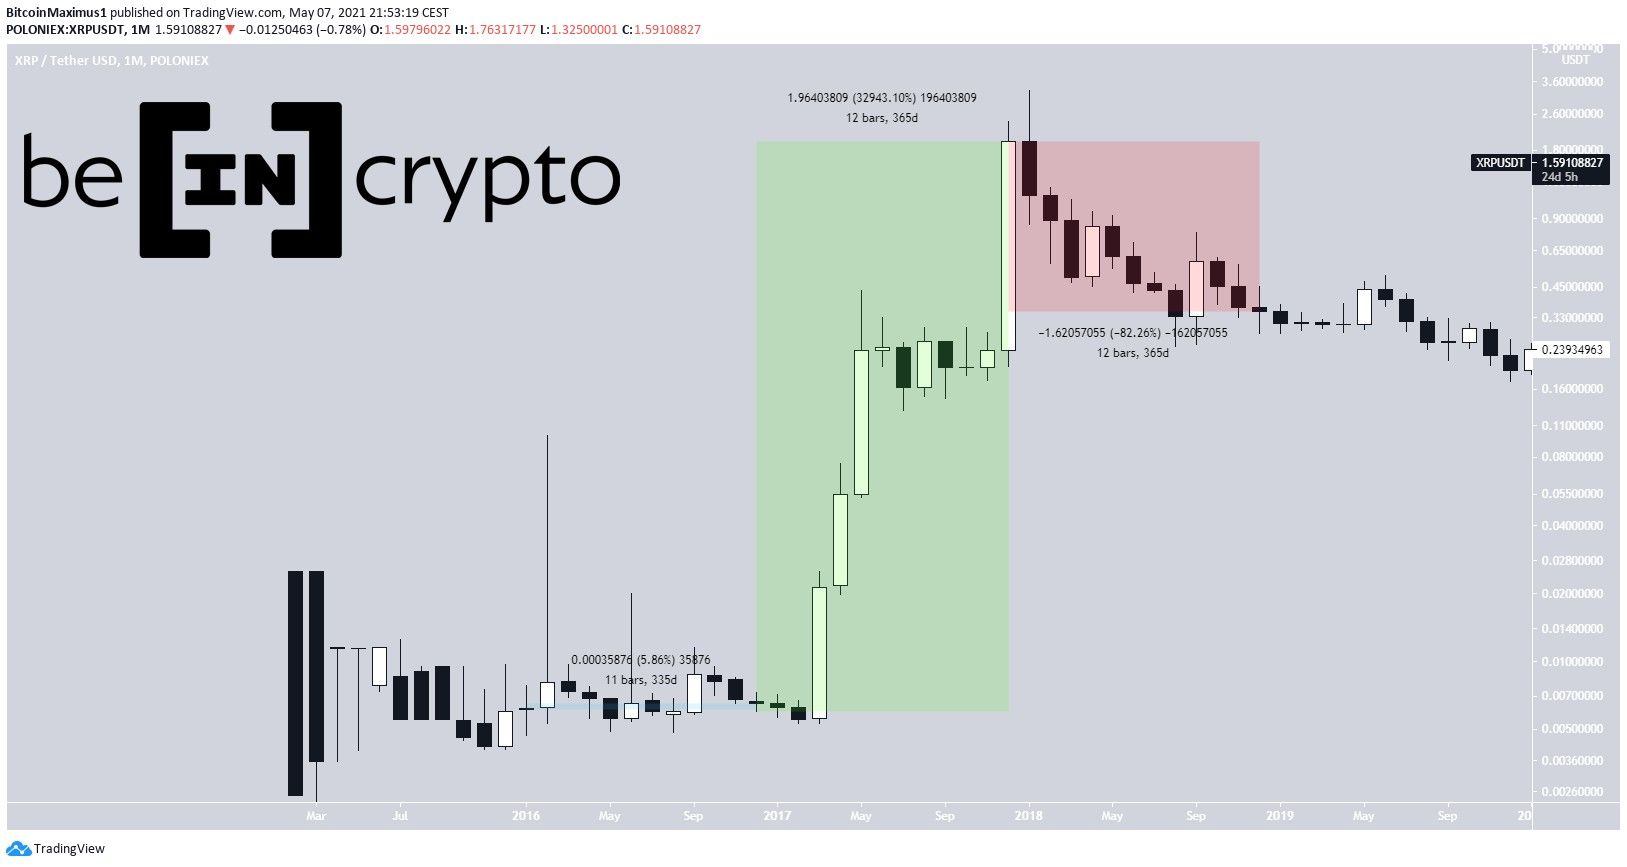
XRP 2016-2018
In 2016, XRP began the year trading at $0.0061. The year was not very eventful, with a lack of volatility noted throughout. The yearly closing price was at $0.0066, an increase of only 5.86%.
This all changed in 2017, a year that saw a colossal increase in the token’s price. The token moved upwards by 32,943%, reaching a yearly close of $1.97.
While its all-time high price of $3.28 was reached in January 2018, the rest of the year was bearish. The token decreased each month with the exception of April and September. It proceeded to reach a yearly close of $0.349—a decrease of 82.26% on the year.
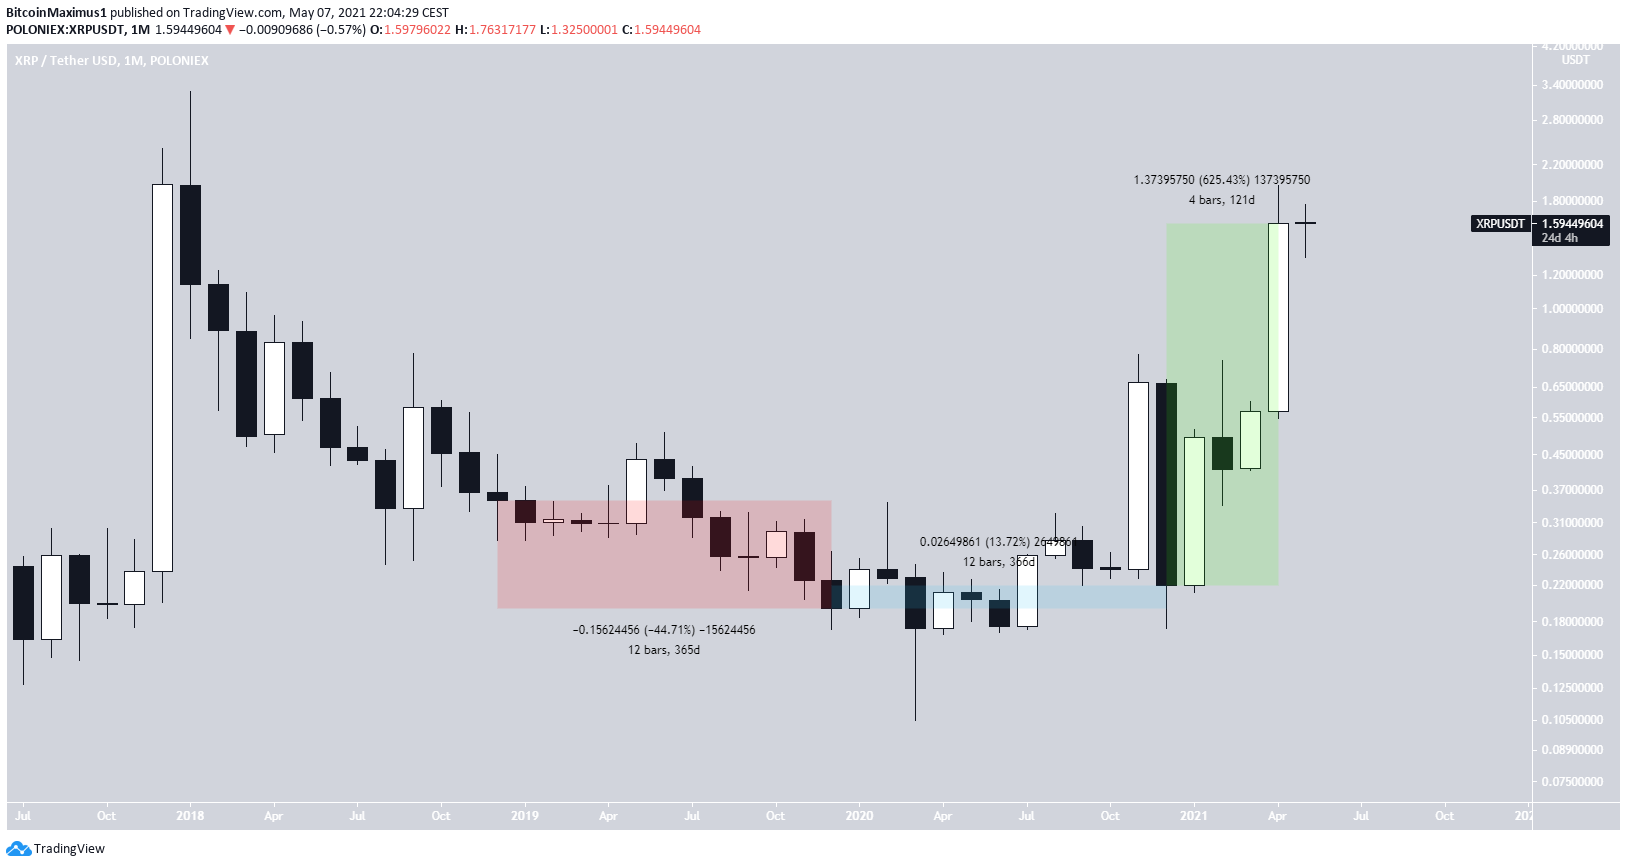
XRP 2018-present
2019 was also a bearish year for XRP, its second consecutive year in which the closing price was lower than the opening. All in all, the token decreased by 44.71%, settling on a new low of $0.173.
2020 was a very eventful year with considerable volatility. It reached a high of $0.78 in November before decreasing considerably the following month and creating a bearish engulfing candlestick. However, it still managed to reach a yearly close of about 14% higher than its opening price.
Finally, XRP has increased considerably in 2021. So far, it has moved upwards by 62% in slightly more than four months, making it the second-best year thus far for the token.
Conclusion
Throughout its price history, XRP has increased by :
- 2016: 6%
- 2017: 32,943%
- 2018: -82%
- 2019: -45%
- 2020: 14%
- 2021: 625%


