


On March 14, 2019, Stellar (XLM) was launched on Coinbase Pro. This might mean a boost to price increases that been seen since Mar 9.
Here is the price outlook from Mar 9 to Mar 14:
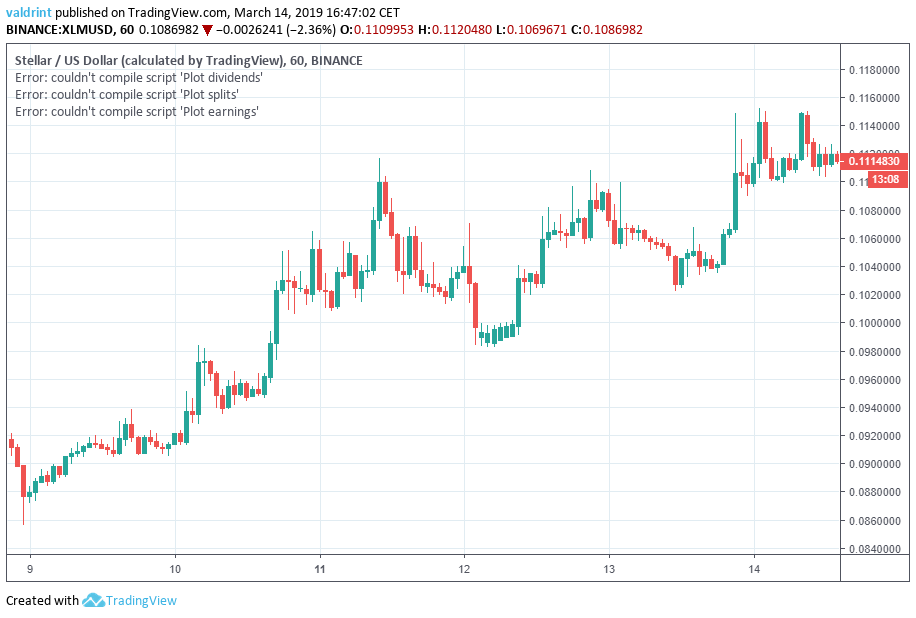
In our Mar 7 analysis of Stellar, we predicted the price of lumens—the native currency on the Stellar network— to increase above $0.094. After reaching that level on Mar 10, prices have continued rising. At the time of writing, the price was trading around $0.111.
Based on today’s current analysis, we predict that the price of lumens is likely to increase. However, a rapid downward move is likely to follow after a peak is reached.
Highlights For Mar 14
- The price has been on an uptrend since Mar 9.
- There has been bearish divergence developing in the MACD and the RSI.
- The price is trading inside an ascending wedge.
- There are resistance areas near $0.112 and $0.13
- There are support areas near $0.098 and $0.088
Ascending Support Line
The price of XLM on Binance is analyzed at one-hour intervals from Mar 9 to Mar 14.
The price reached a low of $0.0855 on Mar 9. Several short market cycles followed. Each dip was higher than the last. Tracing these lows gives us an ascending support line.
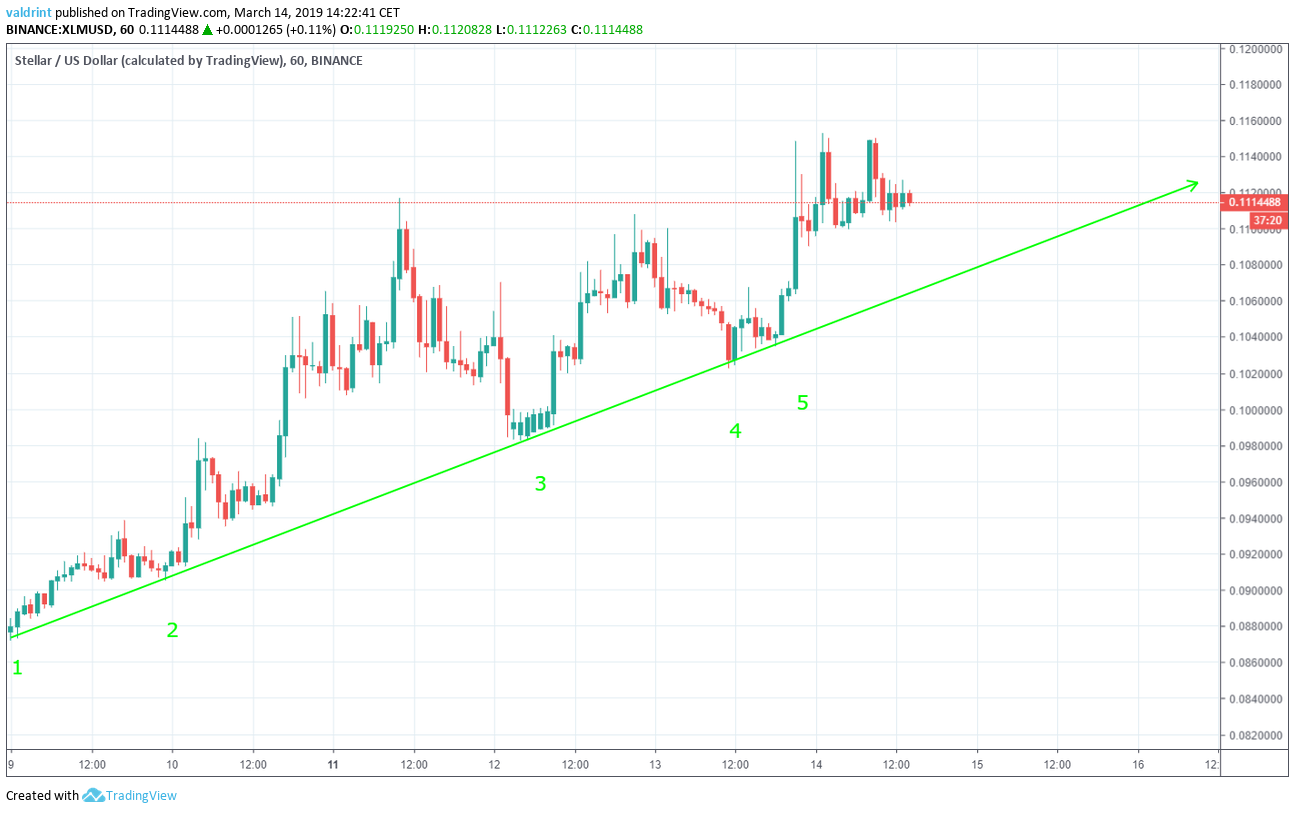
The price has increased at the rate predicted by the ascending support line and likely to continue to do so. Determining when the ascent will end cannot be determined by the support line alone.
Ascending Wedge
The price reached high of $0.111 on Mar 11. A rapid drop ensued, succeeded by a gradual upward move. The price made several higher highs. Tracing these highs gives us an ascending resistance line.

Similarly to the support line, the resistance line prevents further upward movement. The price has increased at the same rate as predicted by the line during the period traced.
The support and resistance lines combine to create an ascending wedge. This is a bearish pattern. It suggests likely price decreases.
Based on this pattern, the price is likely to experience price decreases in the near future. It is possible that price might increase to new highs before a descent begins.
Possible Breakdown
Combining moving average convergence divergence (MACD) and relative strength index (RSI) bullish/bearish divergence with support/resistance essentially predicts price fluctuations.
The MACD is a trend indicator that shows the relationship between two moving averages (long and short-term) and the price. It is used to measure the strength of a move. The RSI is an indicator which calculates the size of the changes in price in order to determine oversold or overbought conditions in the market.
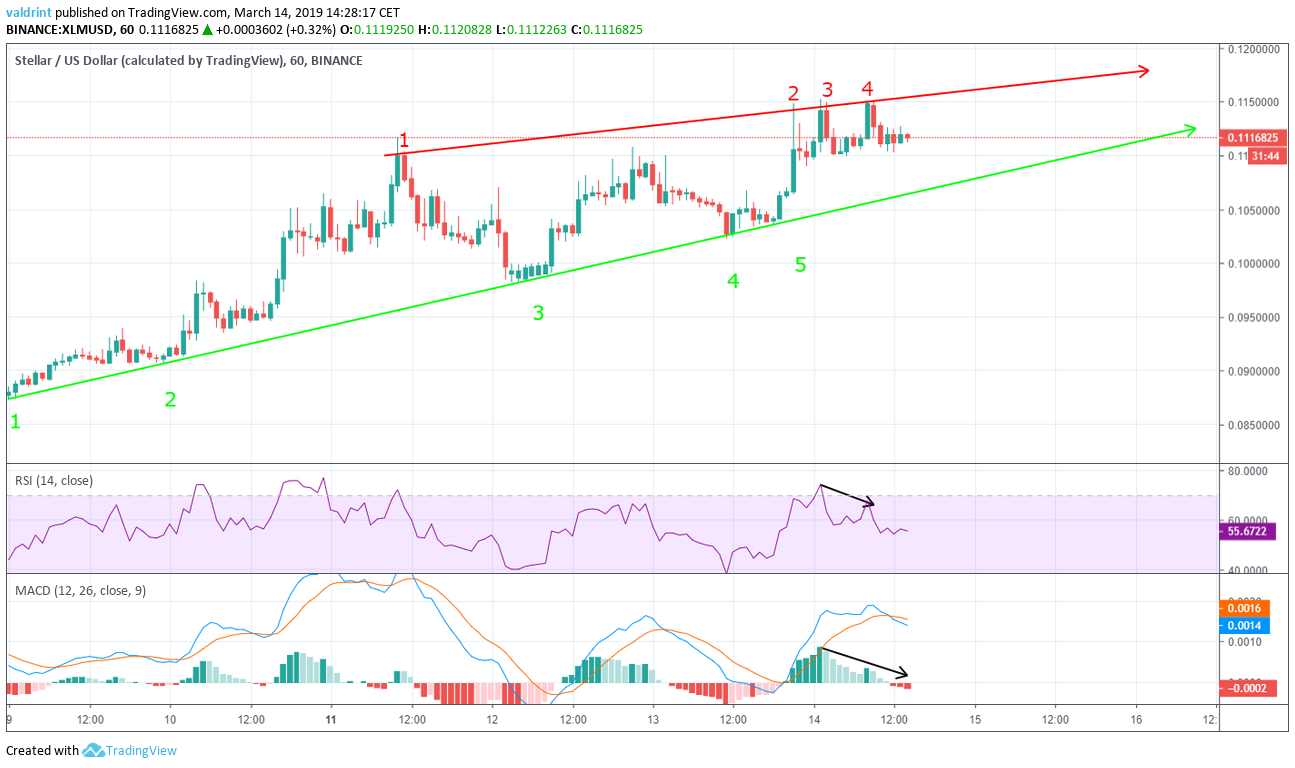
This is called bearish divergence and often precedes drops in price. It is especially effective if bearish divergence occurs in a bearish pattern and vice-versa. This is the case with XLM—The ascending wedge is a bearish pattern.
These indicators confirm that price decreases are likely forthcoming in the near future. It is unclear how much higher XLM will be able to climb before facing a reversal.
Future Movement
The price of XLM on Binance is analyzed at six-hour intervals from Jan 7 to Mar 14 in order to better visualize potential reversal areas in the future.
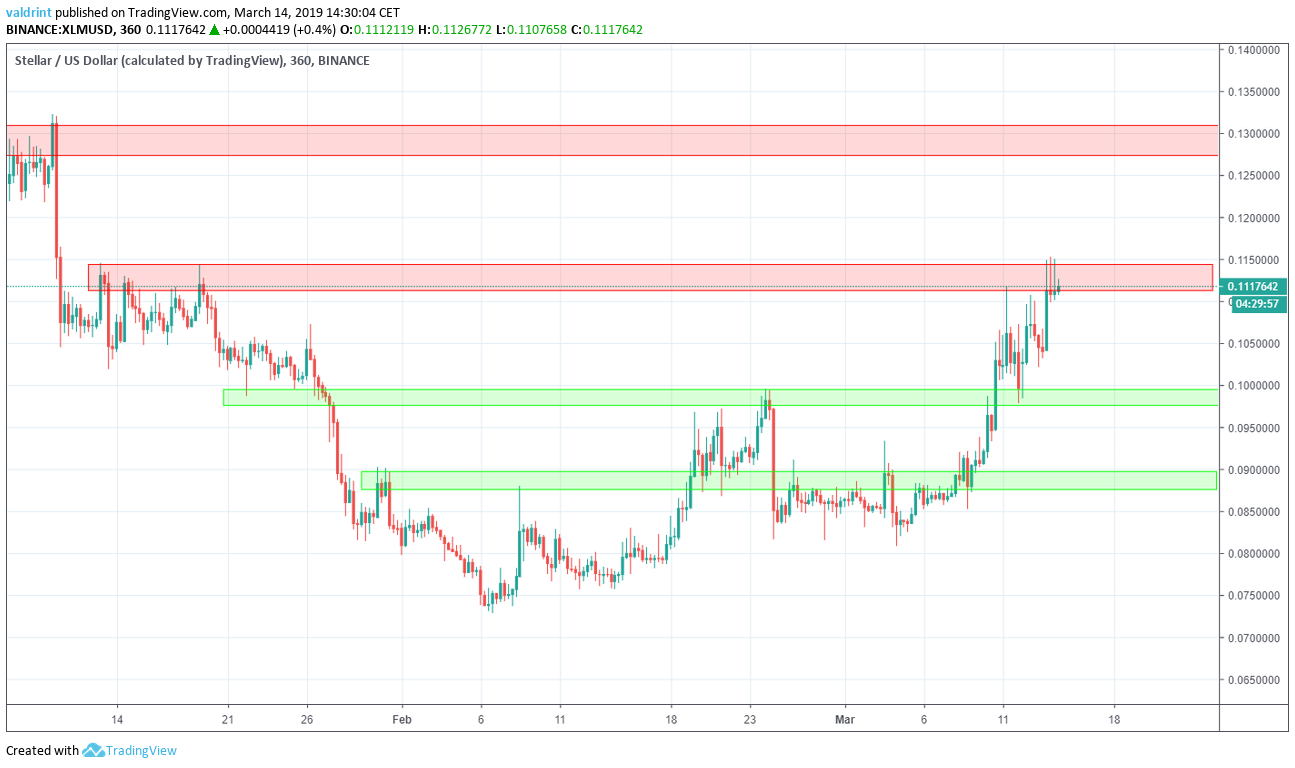
Resistance and support areas are formed when the price reaches a certain level several times. They can act as a ceiling/floor that prevents the price from moving further in that direction.
The closest resistance area is found near $0.112. If the price breaks out if it, the next one will be found near $0.13. Based on our analysis, this movement is unlikely.
There are support areas near $0.098 and $0.088. If the price breaks down from the wedge, these two would provide likely reversal areas. We believe that at least one of these areas will eventually be touched.
Summary of Analysis
Based on this analysis, the price of XLM is likely to decrease in the future. If the price touches the support line of the wedge, this prediction will be partially validated. If it eventually breaks down with sustained prices below the support, it will be fully validated.
What do you think will happen to the price of XLM? Let us know in the comments.
Disclaimer: This article is not trading advice and should not be construed as such. Always consult a trained financial professional before investing in cryptocurrencies, as the market is particularly volatile.


