


Key Highlights For March 7, 2019
- The price of Stellar (XLM) reached a swing high of $0.099 on Feb 24.
- A flash crash caused it to drop to $0.081.
- It is currently trading inside a horizontal channel.
- The MACD and SMAs support further upward movement.
- There is resistance near $0.094.
- There is support near $0.079.
Finding Support
The price of XLM on Binance is analyzed on two-hour intervals from Feb 24 to Mar 7
The price of XLM reached a swing high of $0.099 on Feb 24. A flash crash caused it to drop to $0.081. It has revisited that level five times since.
Tracing these lows gives us a horizontal support line.
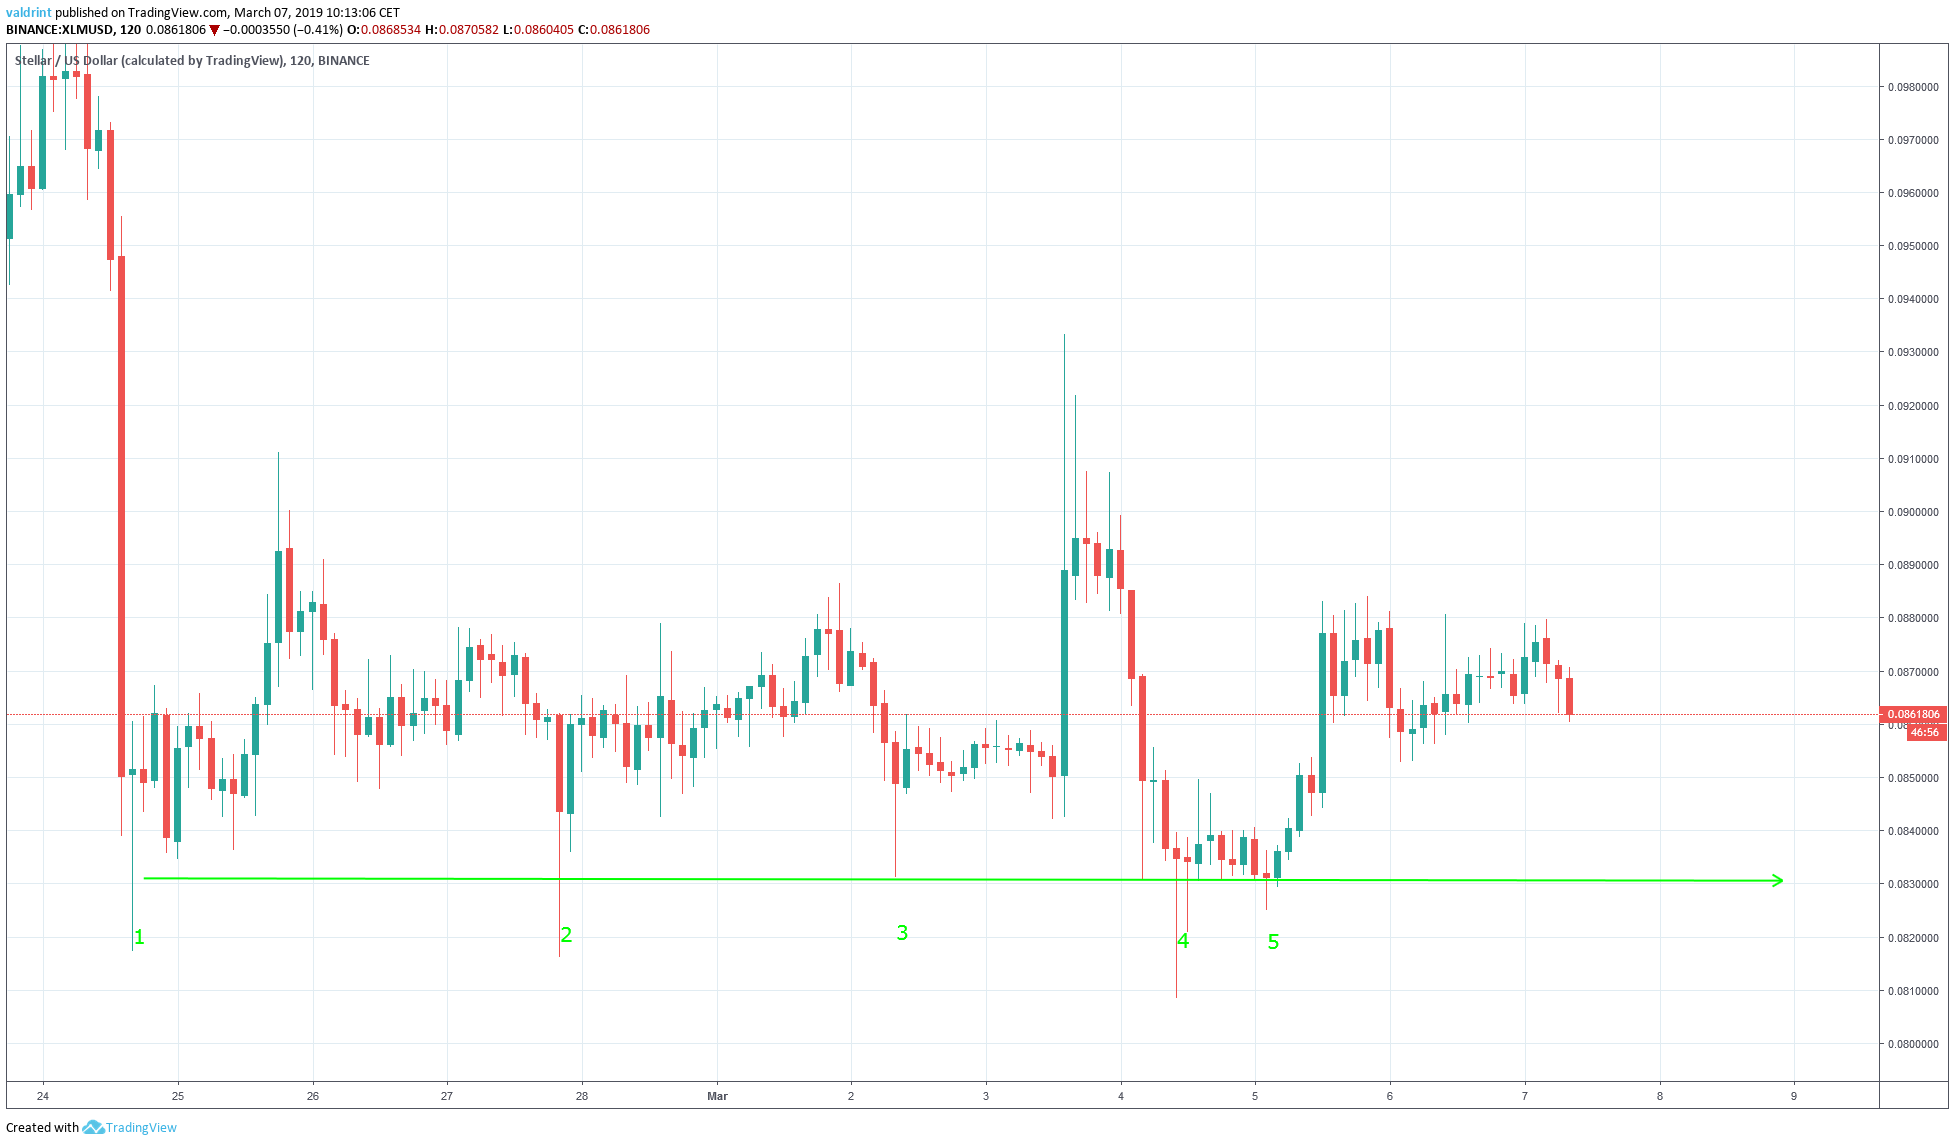
The support line was touched five times
- Feb 24
- Feb 27
- Mar 2
- Mar 4
- Mar 5
The support line can act as a price floor, preventing it from dropping below a certain level.
The breakdown below the support line by a wick in a volatile market is relatively unimportant as long as it is not succeeded by continued breakdowns. In the case of XLM, two-hour lows rarely broke below the support and were not supported by maintained losses.
However, a breakdown below the line could be the initiator of a rapid price decrease.
Horizontal Channel
After the drop to $0.081, the price rebounded to a high of $0.091. It revisited the same level on Mar 3.
Tracing these highs gives us the horizontal resistance line. The resistance and support lines combine to create a horizontal channel. If price moves outside this channel for a significant period of time, new resistance and support lines may develop.
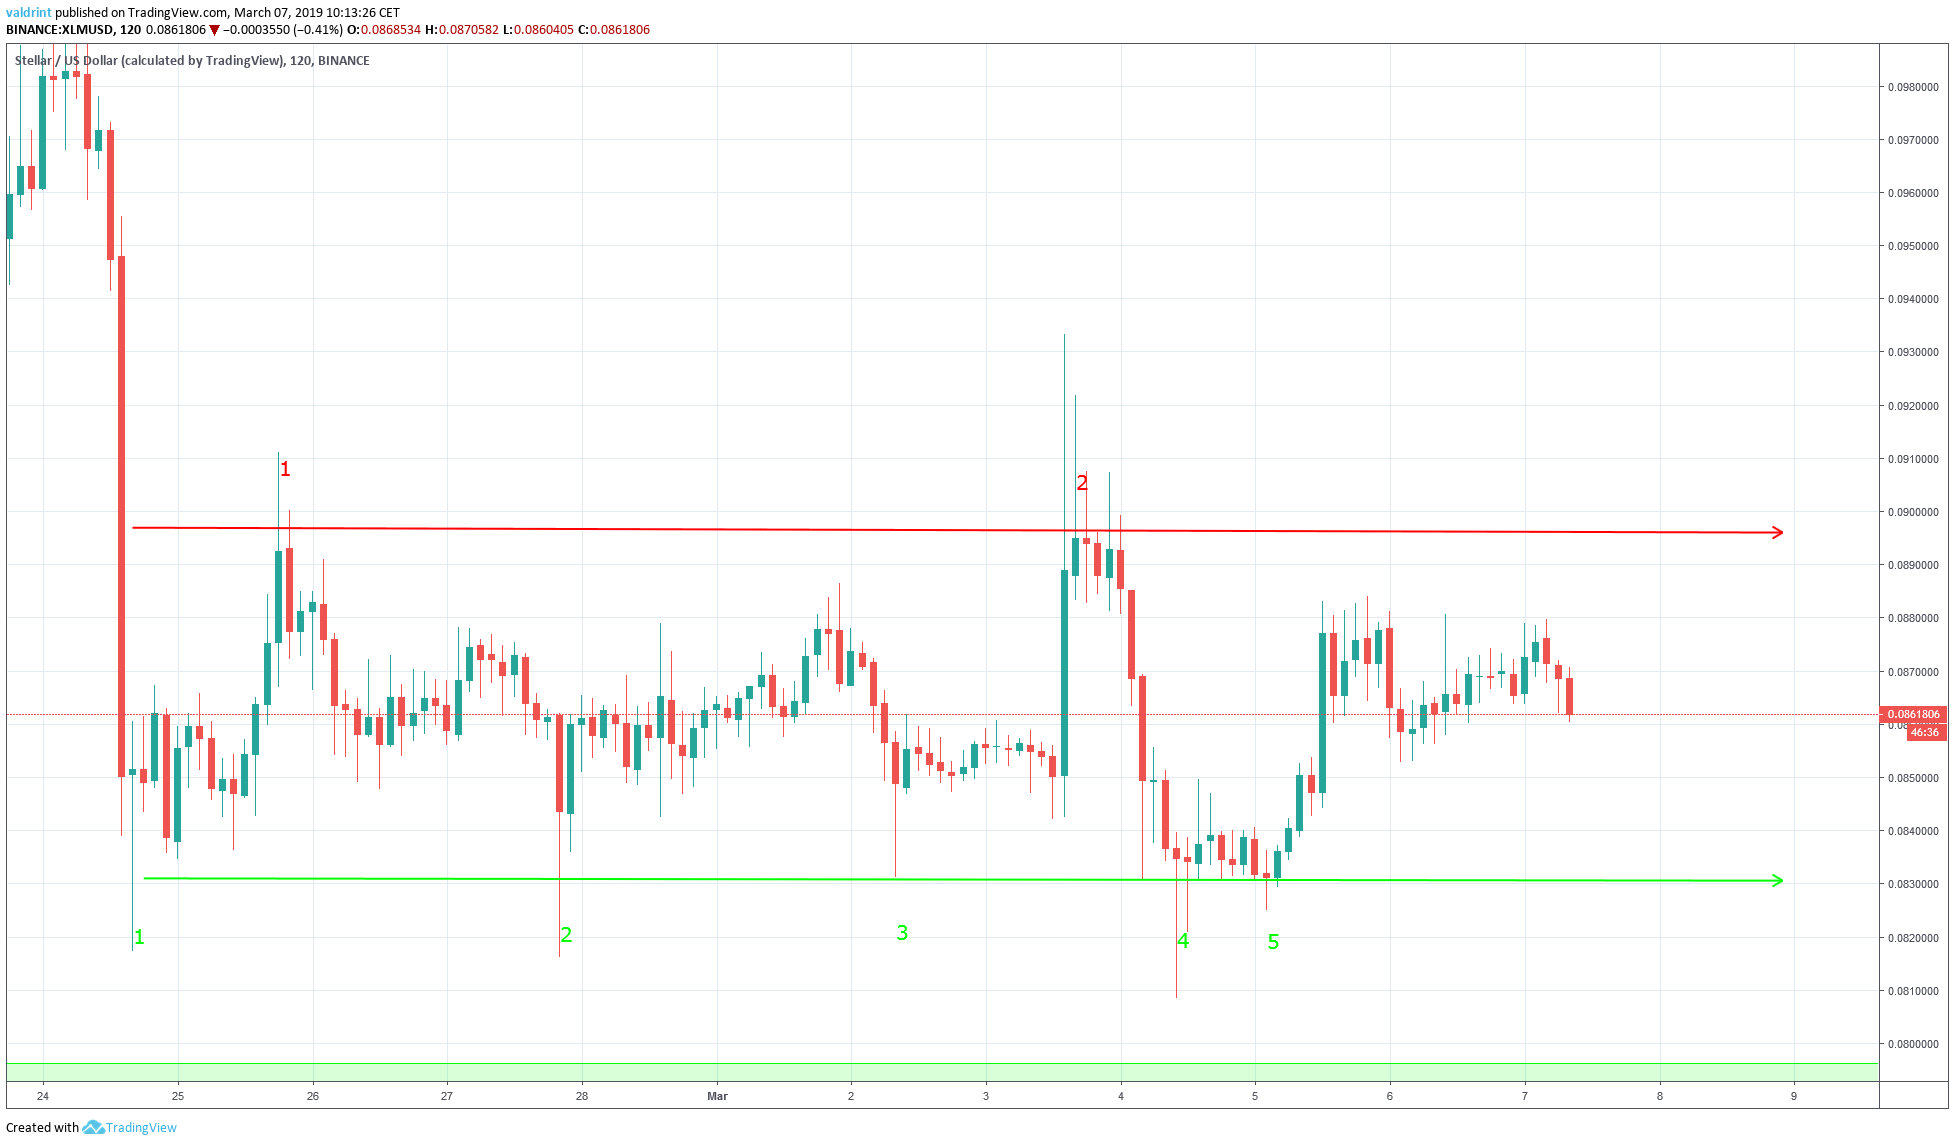
The resistance line was touched twice:
- Feb 25
- Mar 3
The resistance line can act as a ceiling, preventing the price from breaking out above that level. However, a breakout above it could initiate a rapid price increase.
The price last touched the ceiling on Mar 3. This means that the price is increasing at a slower rate than predicted by the channel.
The Signal Is Triggered
The moving average convergence divergence (MACD) is a trend indicator that shows the relationship between two moving averages (long and short-term) and the price. It is used to measure the strength of a move.
Combined with simple moving averages (SMA), MACD can be used as a trigger for buy and sell signals. Signals are triggered whenever the MACD line is above 0 and the price is above the 21 (red) and 50-period (green) SMAs.
Volume is a measure of how much of a certain asset is traded in a certain period of time. Combined with the MACD, it can be used as a confirmation tool for the beginning of a trend.
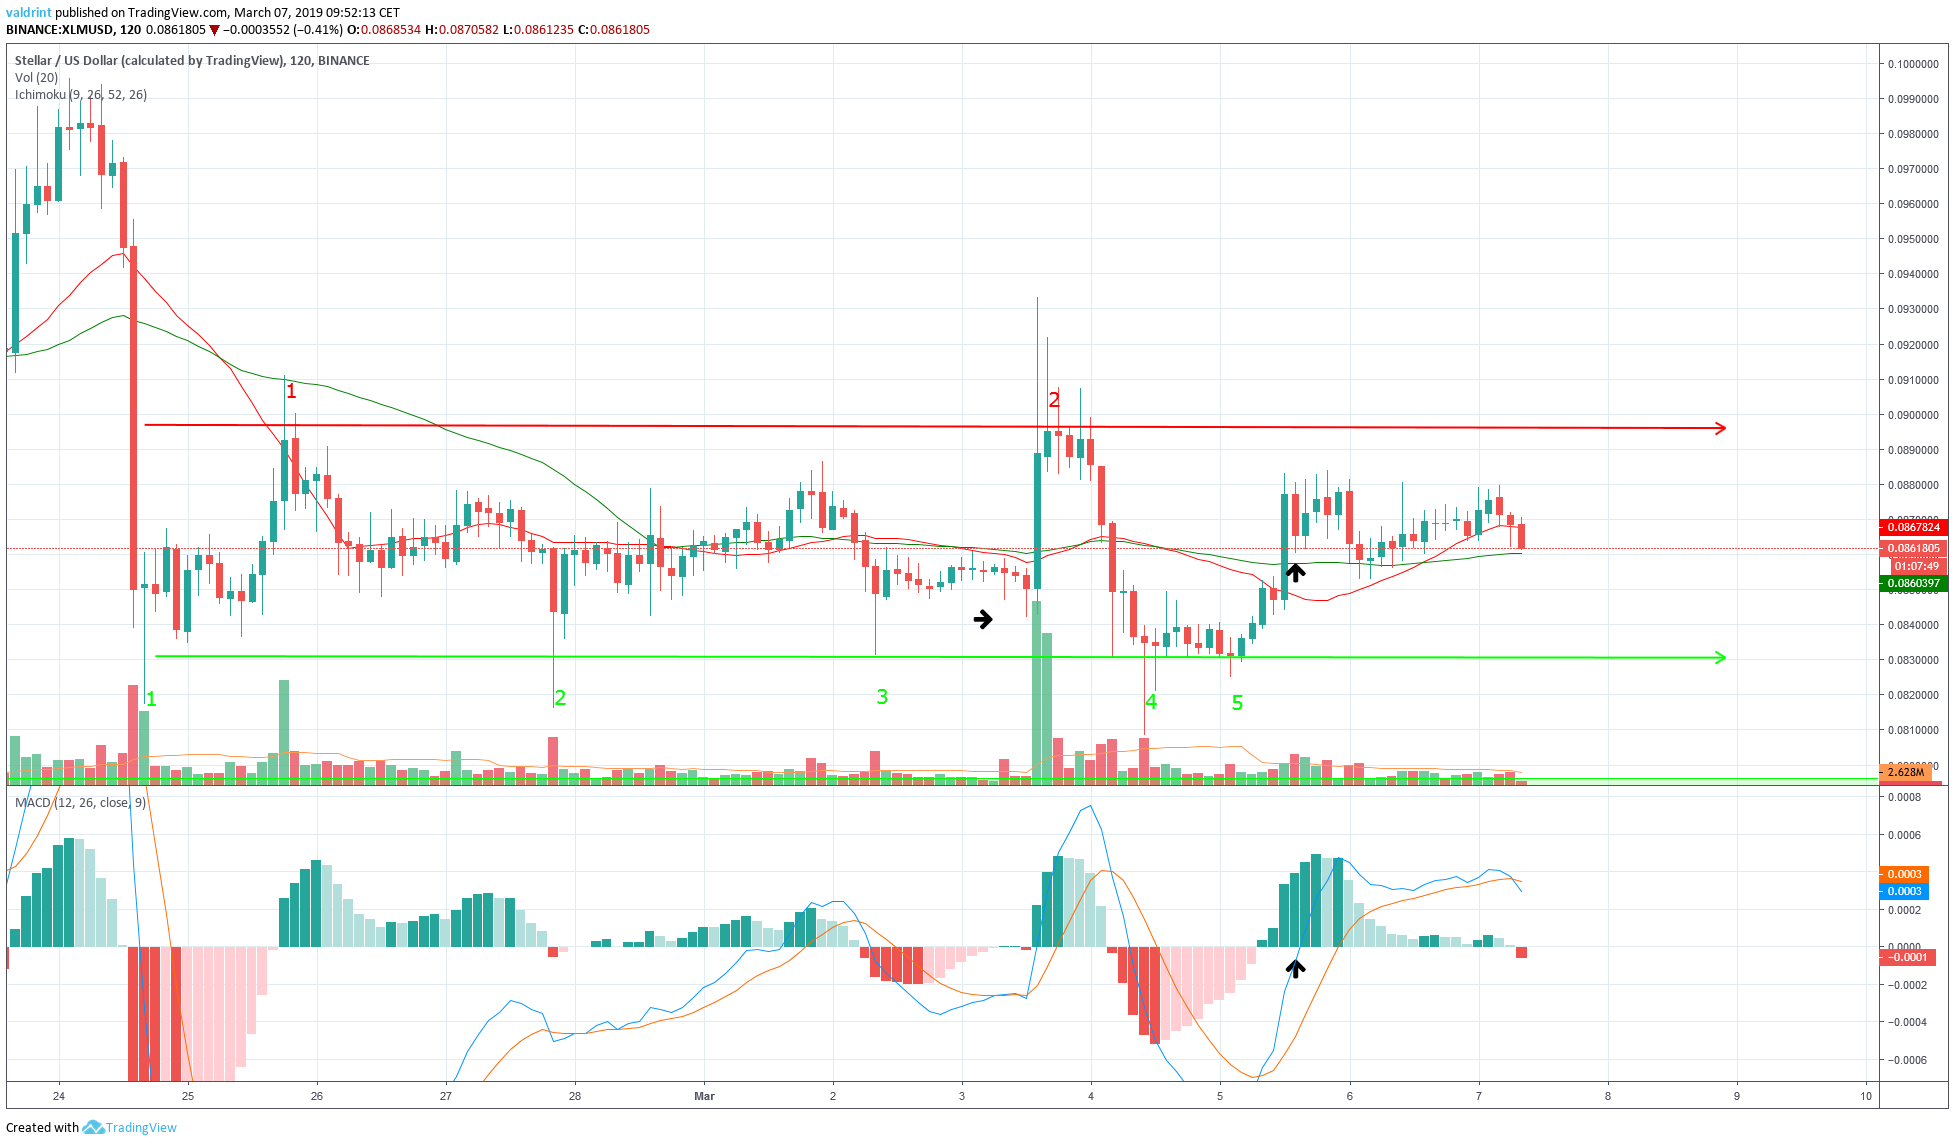
On Mar 3, the price made a rapid upward move from $0.084 to $0.093 inside a two-hour candle. The movement was combined with significant volume.
On Mar 5, the price moved above the 21 and 50-period MA. Similarly, the MACD crossed above the 0 line. This would have triggered a buy signal, indicating that the price may want to start an upward trend and higher prices may be in store in the future.
However, this trend would be invalidated with a breakdown below the support line or a sell signal.
Future Movements
The price of XLM on Binance was analyzed on two-hour Intervals from Feb 19 to Mar 7
Resistance and support areas are formed when the price reaches a certain level several times. They can act as a ceiling/floor that prevents the price from moving further in that direction.
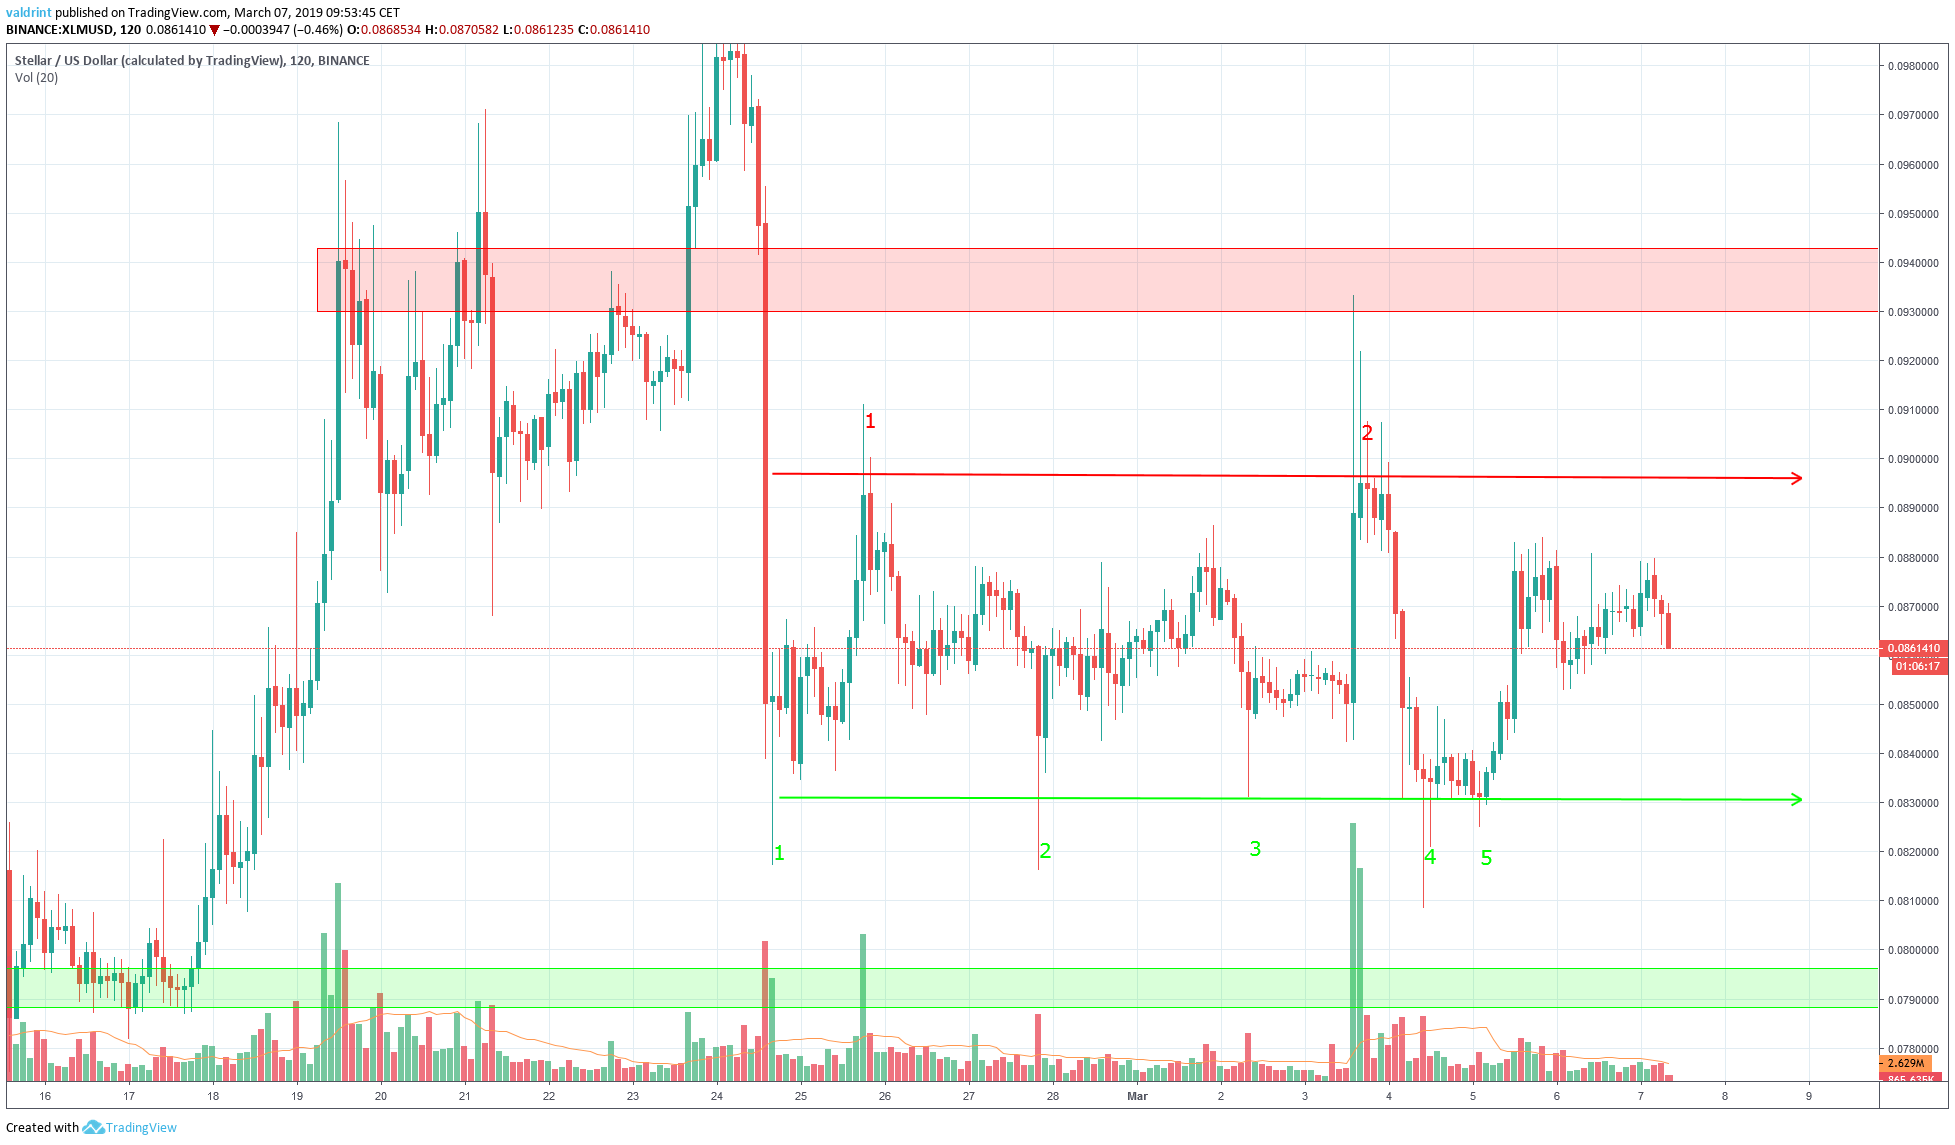
The closest resistance area is found near $0.094. If the price breaks out above the channel, that level would provide a likely reversal area.
The closest support area is found near $0.079. If the price breaks down below the channel, that level would provide a likely reversal area.
Based on this analysis, a breakout above the channel appears more likely than a breakdown below it. If the price of XLM moves toward the first resistance area, such a prediction may be partially validated. If the price reaches or exceeds $0.094, this prediction will be fully validated.
How much longer do you think XLM will continue trading within the parallel channel? Is a breakout or breakdown coming anytime soon? Let us know your thoughts in the comments below, and check out our most recent Bitcoin analysis and price predictions!
Disclaimer: This article is not trading advice and should not be construed as such. Always consult a trained financial professional before investing in cryptocurrencies, as the market is particularly volatile.


