


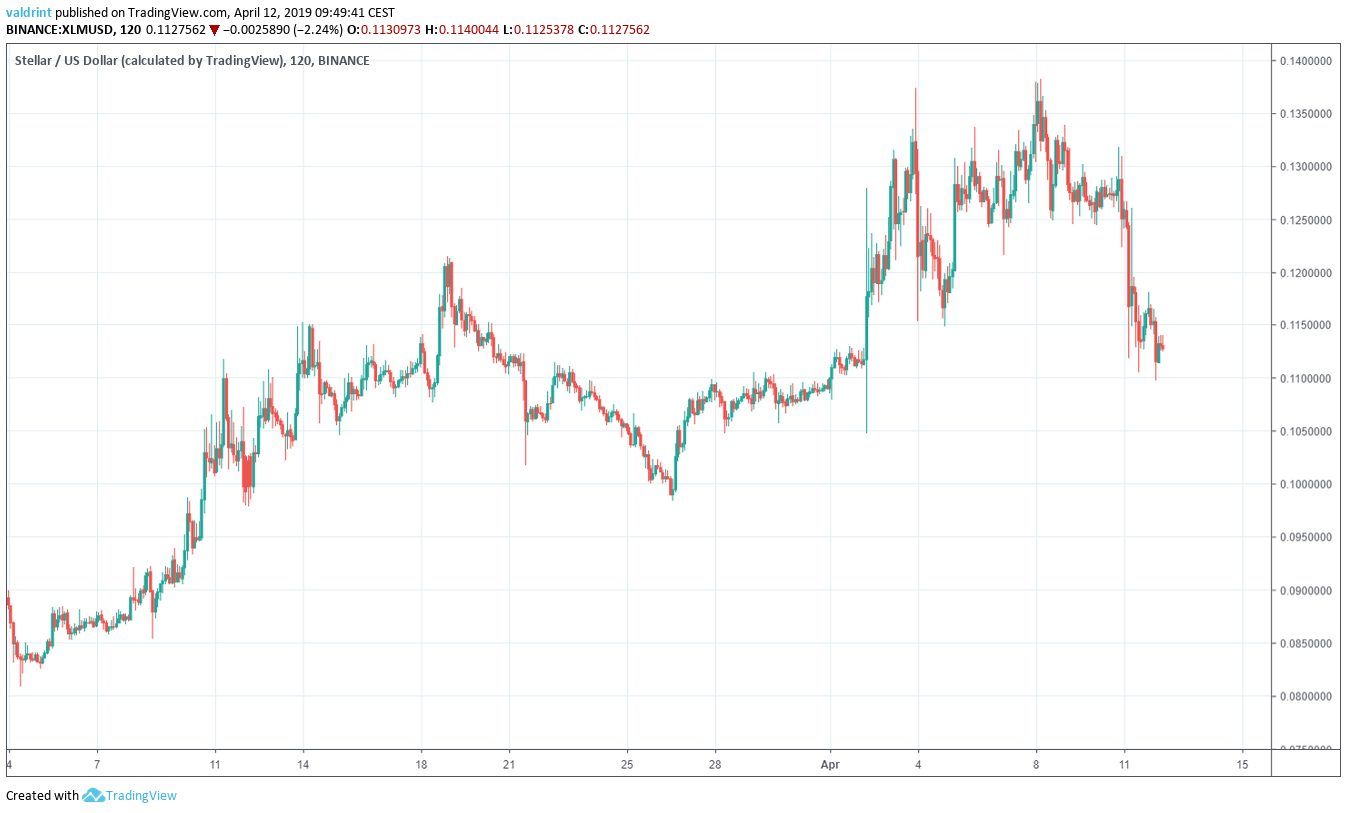
On Mar 4, 2019, the price of Stellar Lumens reached a low of $0.080. A rapid spike in early April and gradual uptrend brought lumens to above $0.135 on Apr 8.
The price has fallen quite rapidly since to a low around $0.11 at the time of writing on Apr 12.
Will the price of Stellar lumens keep going down or should we expect a reversal soon?
Let’s find out:
Stellar Lumens (XLM): Highlights for April 12, 2019
- The price of Stellar lumens has been on an uptrend since Mar 4.
- Since then, XLM/USD is trading inside an ascending channel.
- Bullish divergence is developing in the RSI.
- There is resistance near $0.123 and $0.117
Ascending Channel
On Mar 4 the price made a low of $0.080. Several market cycles have been completed and the price has made a higher low each time.
Tracing these lows gives us an ascending support line:
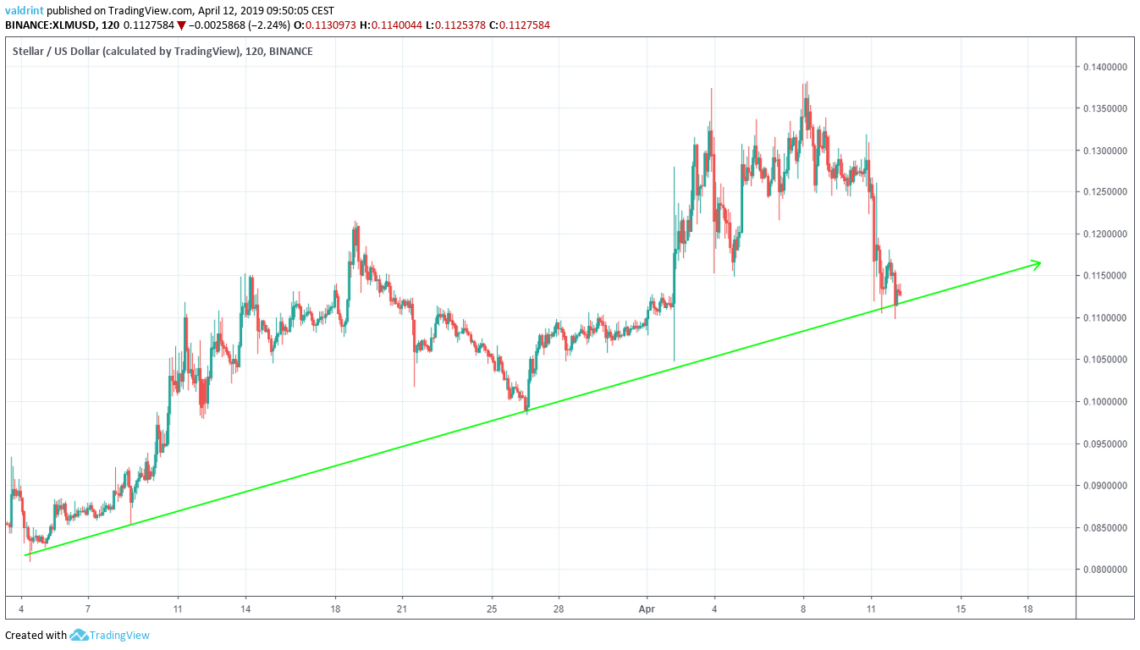
On Mar 13, the price reached a high of $0.115. Several market cycles have been completed since, with each high being higher than the previous one.
Tracing these highs gives us an ascending resistance line.
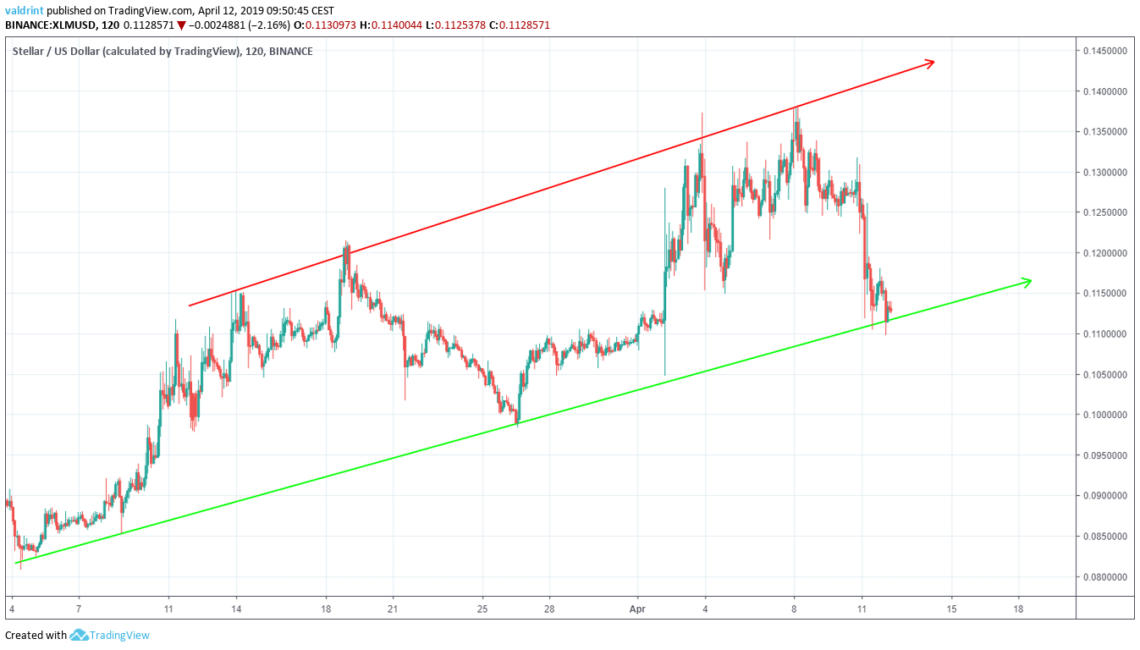
At the time of writing the price is very close to the support line of the channel. A wick low on Apr 12 even dipped below support.
Could this signify an impending breakdown or will Stellar lumens bounce back to the resistance?
In order to answer that question, we need to take a look at some technical indicators.
Technical Indicators
Combining RSI bullish/bearish divergence with support/resistance essentially predicts price fluctuations. They are traced below:
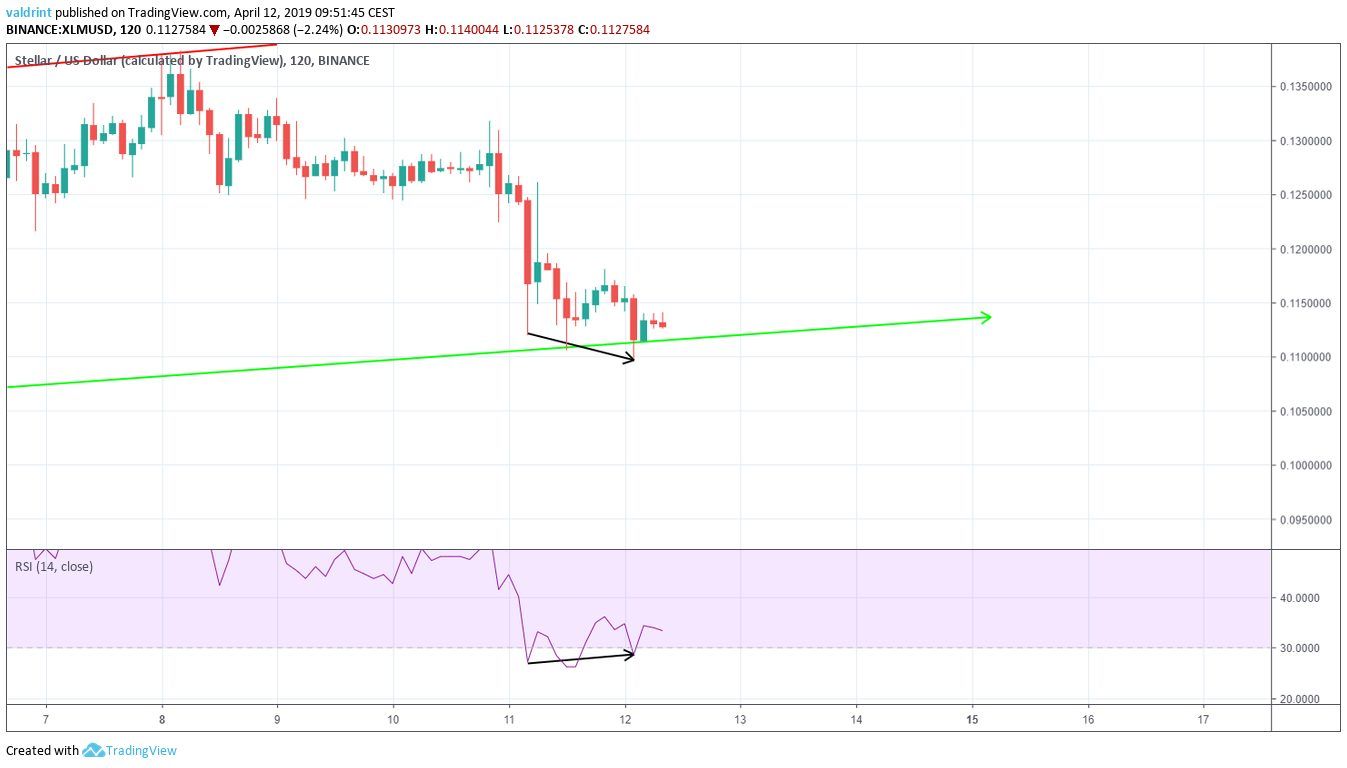 On Apr 11, the price made a low of $0.11. It made a lower low of $0.109 on Apr 12.
Similarly, the RSI made the first low on Apr 11. However, it has continued to generate higher values since.
The use of this indicator suggests price increases towards the resistance line of the channel. A breakdown appear unlikely. XLM/USD may have reached a bottom.
INVEST IN BTC WITH 0 COMMISSION HERE!
Resistance Areas
To determine the actual possible future price levels, we incorporate resistance areas into the analysis.
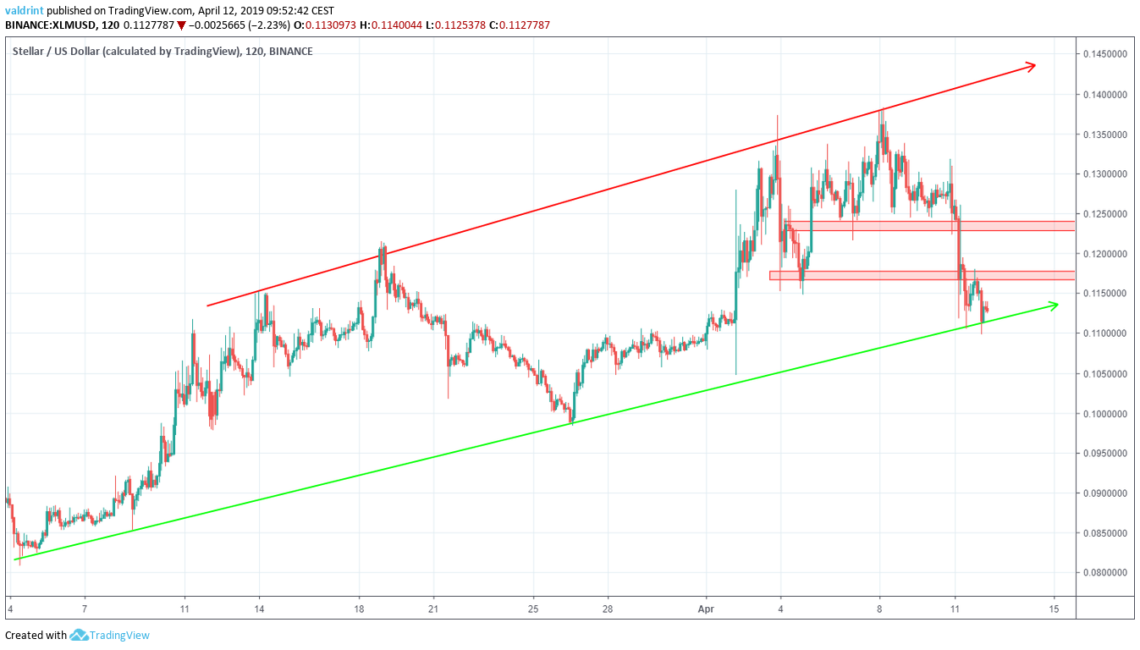
The closest resistance area is found near $0.117, followed by the second one near $0.123. Both of these are within the current trading pattern. This makes it likely that one or both will be reached in the near-future.
Summary of Analysis
Based on this analysis, the price of XLM is likely to increase in the near future, reaching at least one of the resistance areas outlined above. This means price may reach push toward $0.12 soon and possibly exceed this range. If the second resistance area of $0.123 is exceeded, we may expect greater rises toward the resistance line.
However, we should also expect volatility along this upward movement.
Do you think the price of XLM will begin to increase? Let us know in the comments.
If you’re interested in Stellar lumens price predictions for 2019 and 2020, click on the green button below:
Disclaimer: This article is not trading advice and should not be construed as such. Always consult a trained financial professional before investing in cryptocurrencies, as the market is particularly volatile.


