


On Apr 8, the price of Stellar Lumens reached a high of approximately $0.138. It has been gradually decreasing since.
At the time of writing on Apr 10, lumens had reached a a low of approximately $0.125 on two occasions.
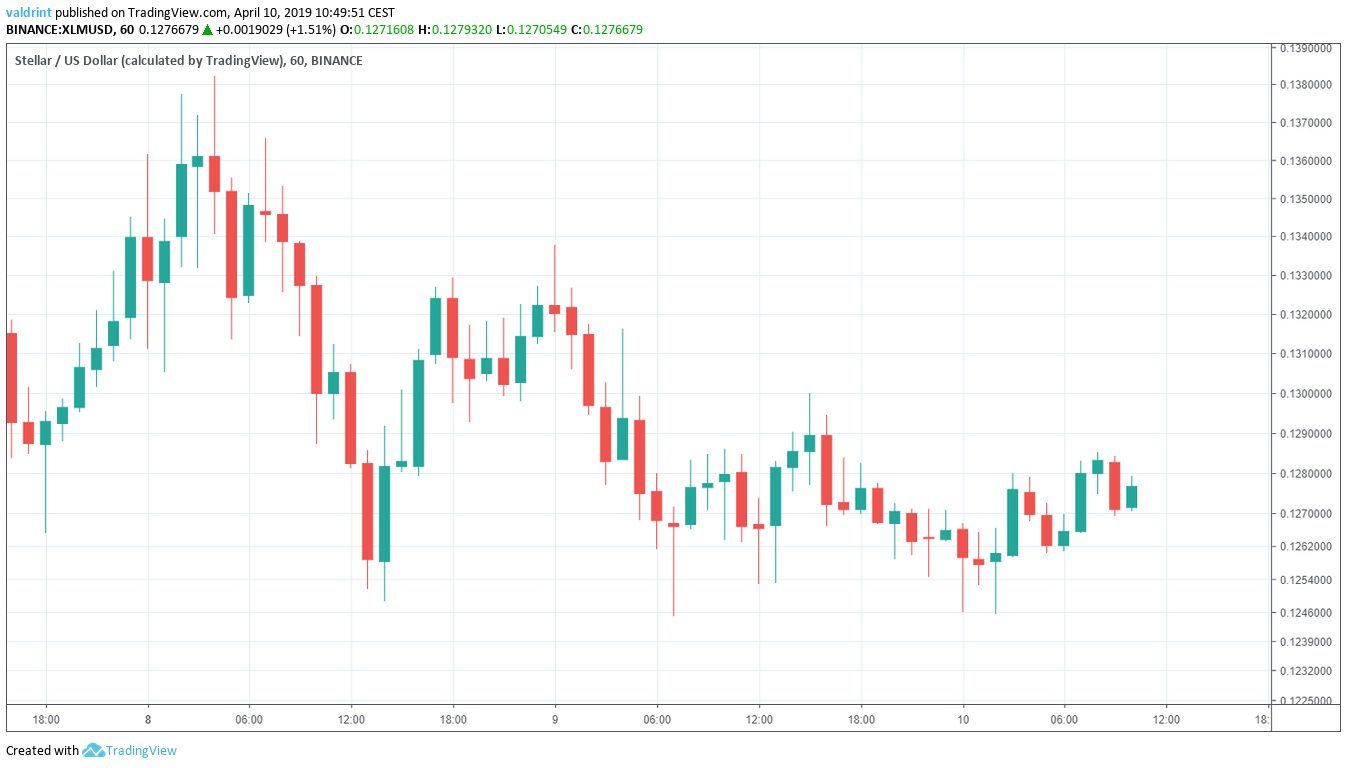
Will the price of Stellar lumens keep going down or should we expect a reversal soon?
Let’s find out:
Stellar Lumens (XLM): Highlights for April 10, 2019
- The price of Stellar lumens has been on a downtrend since Apr 4.
- Since then, XLM/USD has been trading inside a descending triangle.
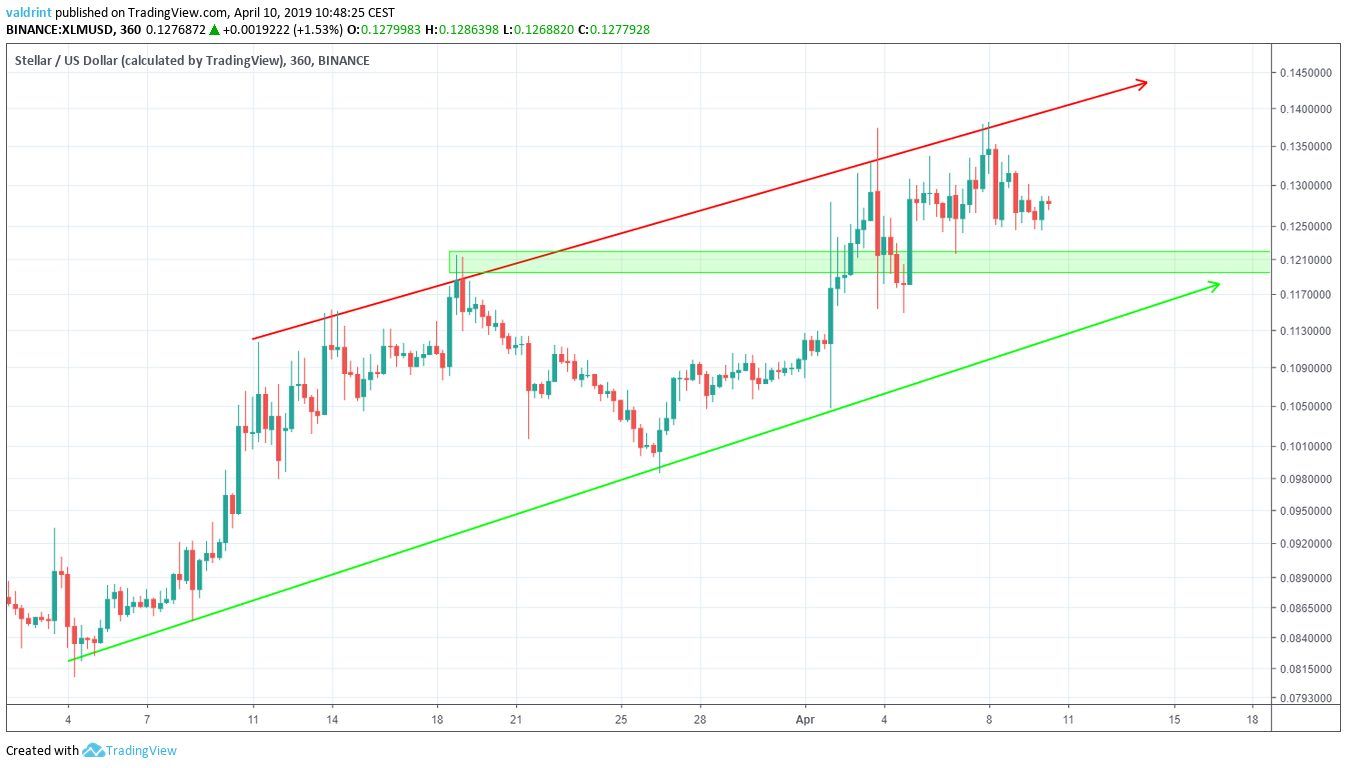
- The price has been trading inside a long-term ascending channel since Mar 4.
- Bearish divergence is developing in the RSI.
- There is support near $0.12.
Descending Triangle
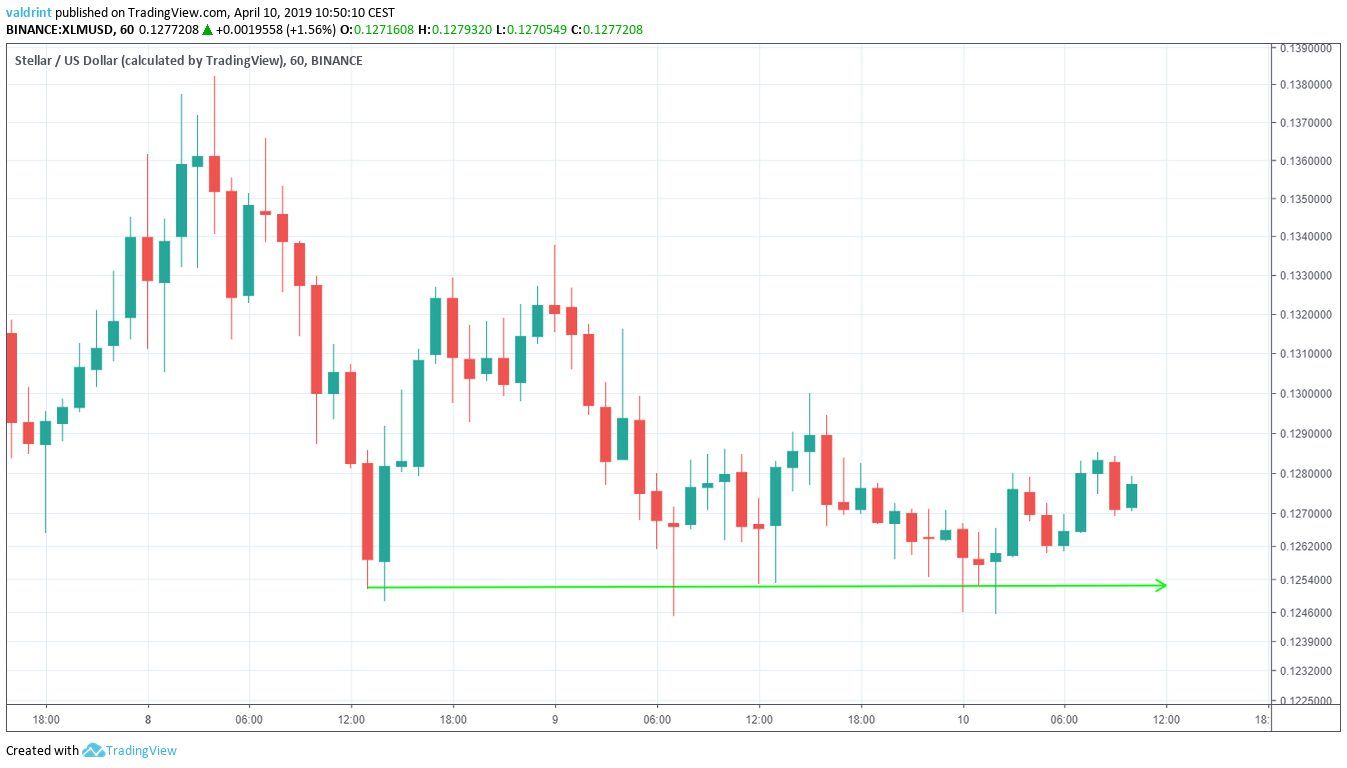
On Apr 8, the price made a low of $0.125. A rapid increase was followed by a gradual decrease. The price reached the same level several times.
Tracing these lows gives us a horizontal support line:
Apr 8, the price reached a high of $0.138. Several market cycles have been completed since, with each high being lower than the previous one.
Tracing these highs gives us a descending resistance line.
The resistance and support lines combine to create a descending triangle:
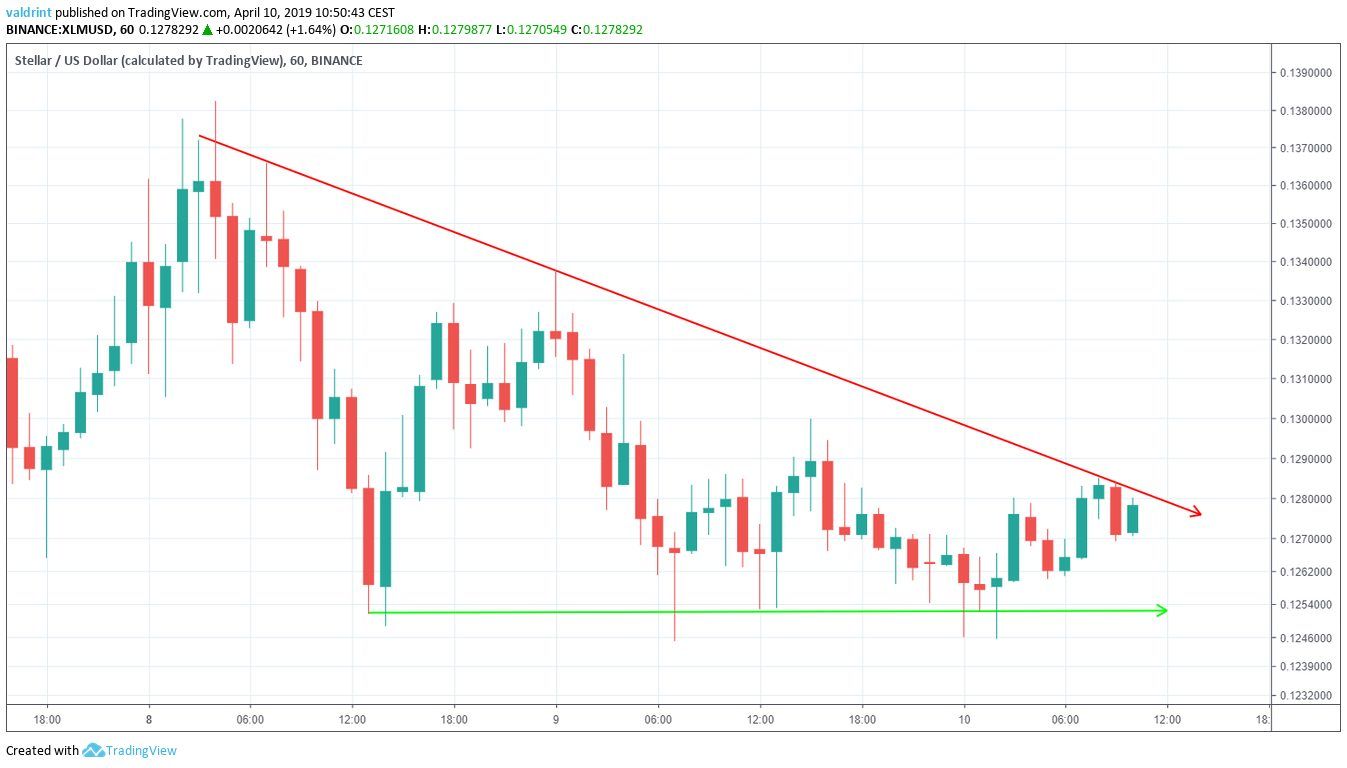
This is a bearish pattern. Price breakdowns appear more likely than price breakouts above resistance.
However, the trading pattern alone cannot predict whether a breakdown will occur. To assess this possibility, we need to take a look at some technical indicators.
Bearish Divergence
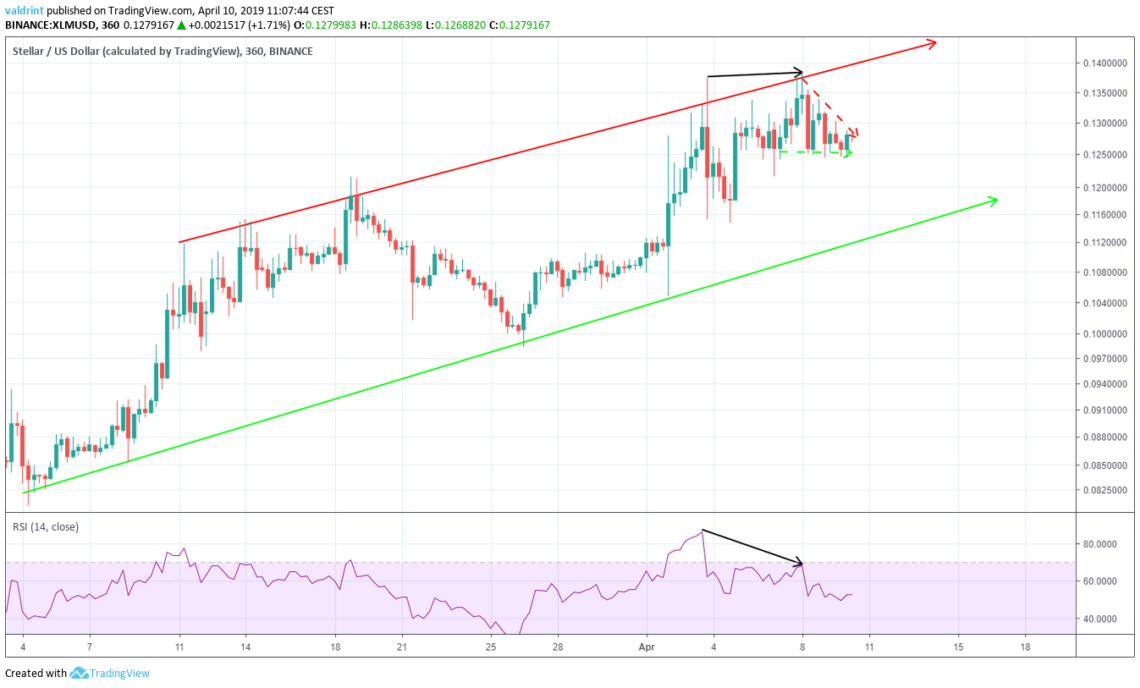
We can see that lumens has been trading inside an ascending channel since Mar 4.
Furthermore, the descending triangle outlined in the section above is a short-term trading pattern located within a long-term trading pattern. It is drawn with dashed lines inside the long-term channel.
On Apr 3, the price made a high of $0.137. It reached the same level on Apr 8. Similarly, the RSI made the first high on Apr 3. However, it has continued to generate lower values since.
This is known as bearish divergence and often precedes price decreases.
The use of this indicator suggests price losses in the future. A breakdown from the triangle appears likely.
Invest in BTC with 0 Commission Here!
Reversal Areas
To determine the actual possible future price levels, we incorporate support areas into the analysis.
Summary of Analysis
Based on this analysis, the price of XLM is likely to decrease in the near future, breakdown from the triangle, and eventually, reach the support line of the channel.
Do you think the price of XLM will break down from the triangle? Let us know in the comments.
Disclaimer: This article is not trading advice and should not be construed as such. Always consult a trained financial professional before investing in cryptocurrencies, as the market is particularly volatile.


