


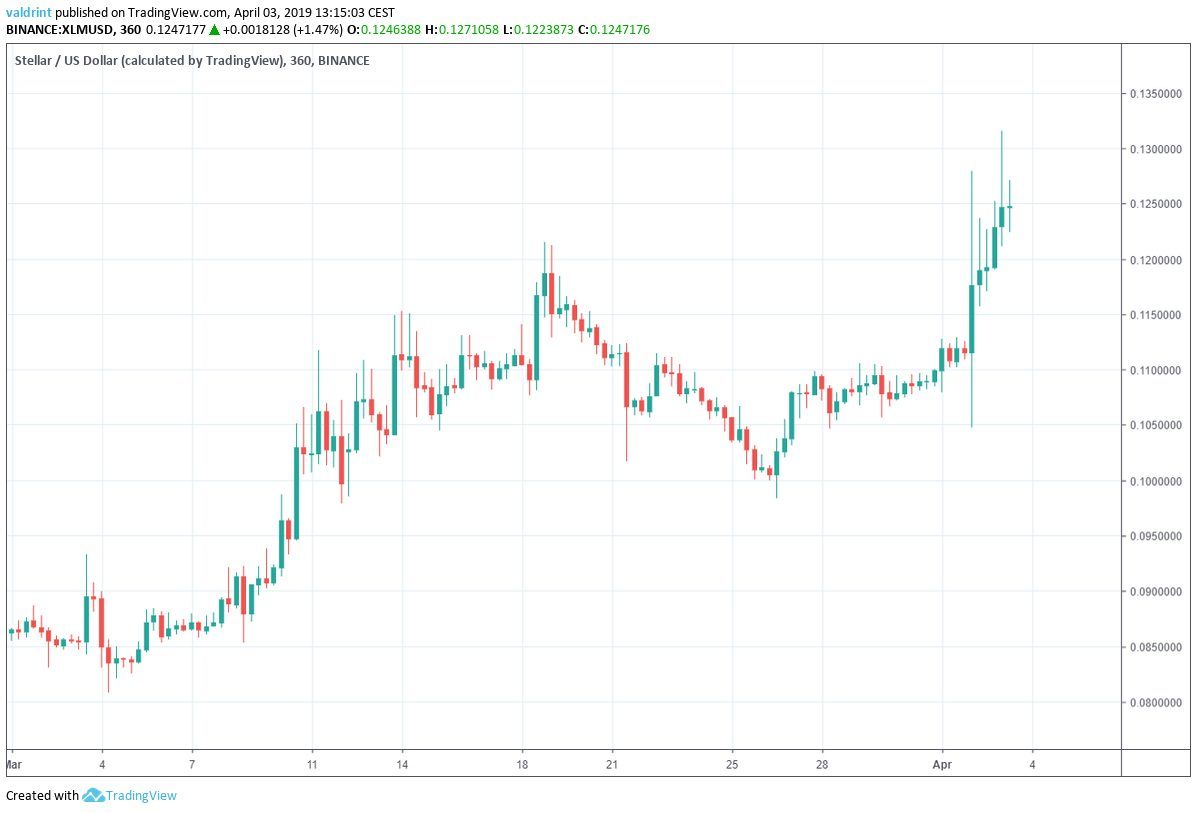
On March 4, 2019, the price of Stellar lumens reached a low of $0.080. It has been on a gradual uptrend since.
Price increases accelerated on Apr 2. At the time of writing on Apr 3, XLM/USD had reached a daily high of $0.131.
Will prices keep going up or are lumens about to face a tragic correction?
Stellar Lumens (XLM): Highlights and Trends For April 3, 2019
- The price of Stellar lumens has been on an uptrend since Mar 4.
- XLM is trading inside an ascending channel.
- There is bearish divergence developing in the RSI.
- There is support near $0.12.
Ascending Channel
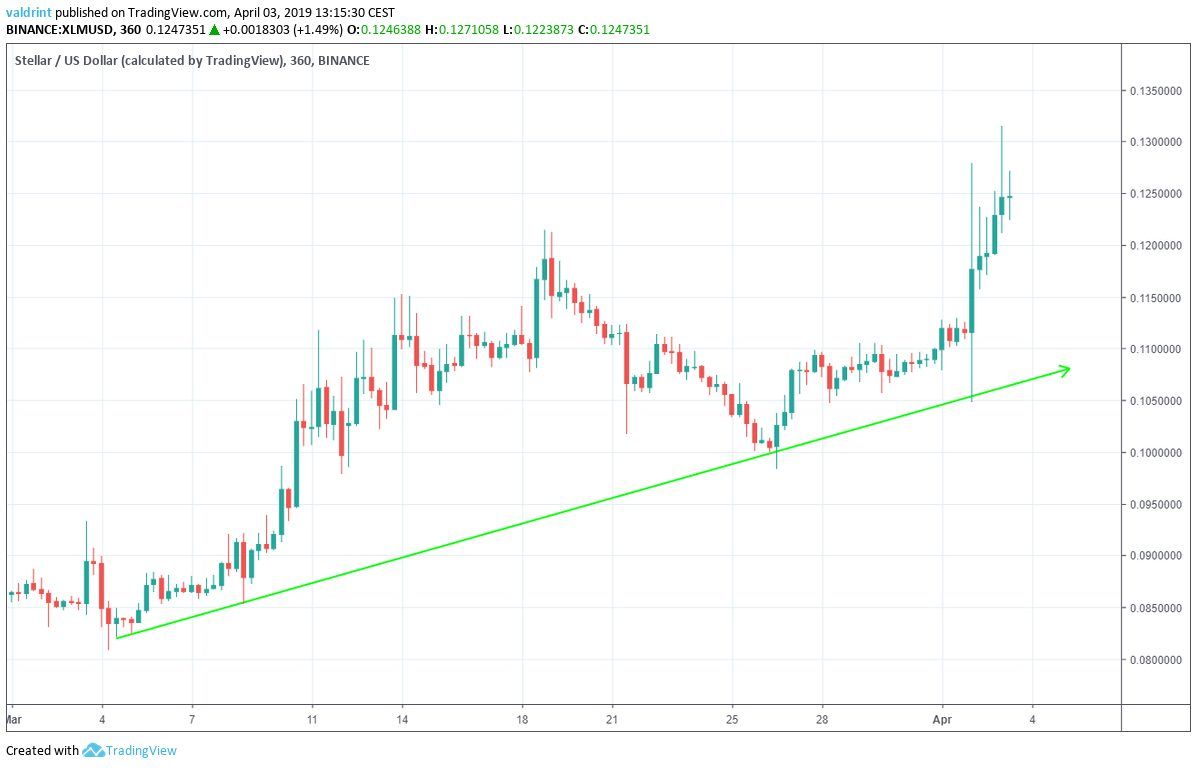
On Mar 4, the price made a low of $0.080. A rapid increase ensued, followed by a gradual decrease. The price made several lower lows.
Tracing these lows gives us an ascending support line:
On Mar 11, the price made a high of $0.111. Several market cycles have been completed since, with each high being higher than the previous one.
Tracing these highs gives us an ascending resistance line.
The resistance and support lines combine to create an ascending channel:
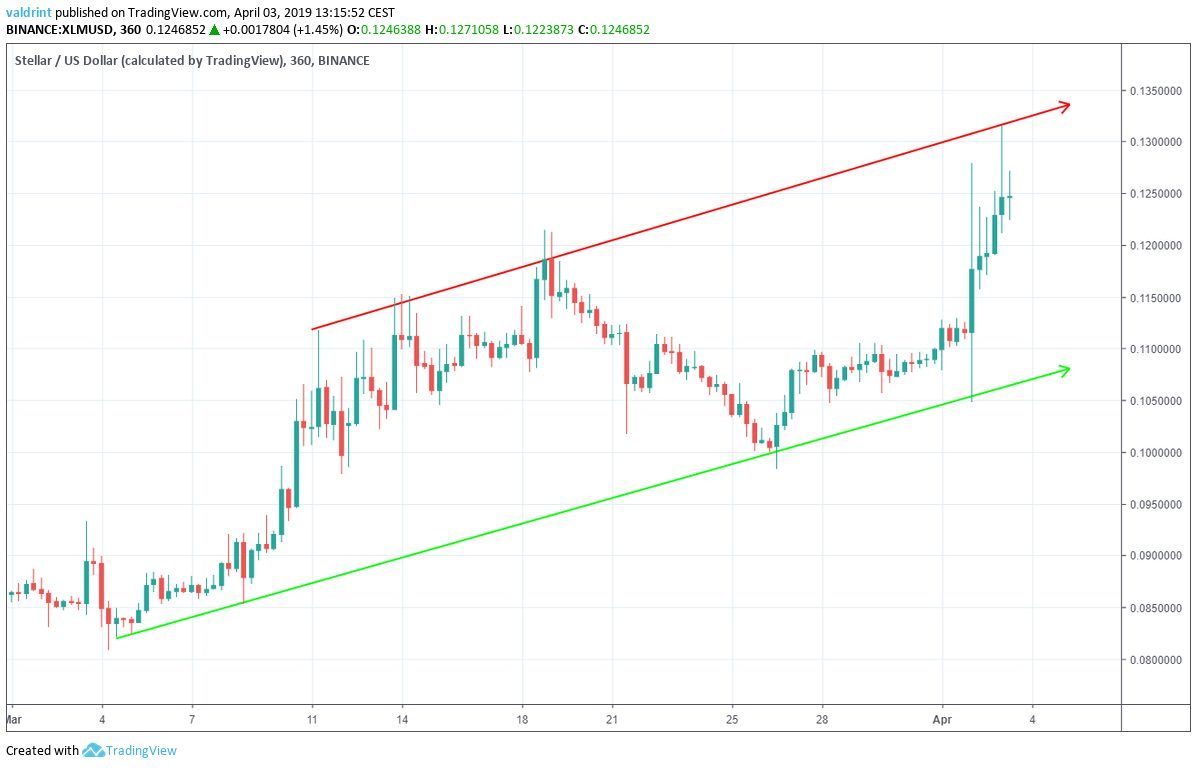
Stellar lumens have seen steady increases within this channel since Mar 4. The recent spikes brought XLM to the resistance line. However, at the time of writing, lumens had not broken out of the channel.
Furthermore, the high to touch the resistance was a wick high. Compared to the opening and closing values during this period, XLM may still see movement toward the resistance before an eventual reversal toward support.
Bearish Divergence
In order to better assess future price fluctuations, we incorporate technical indicators into our analysis.
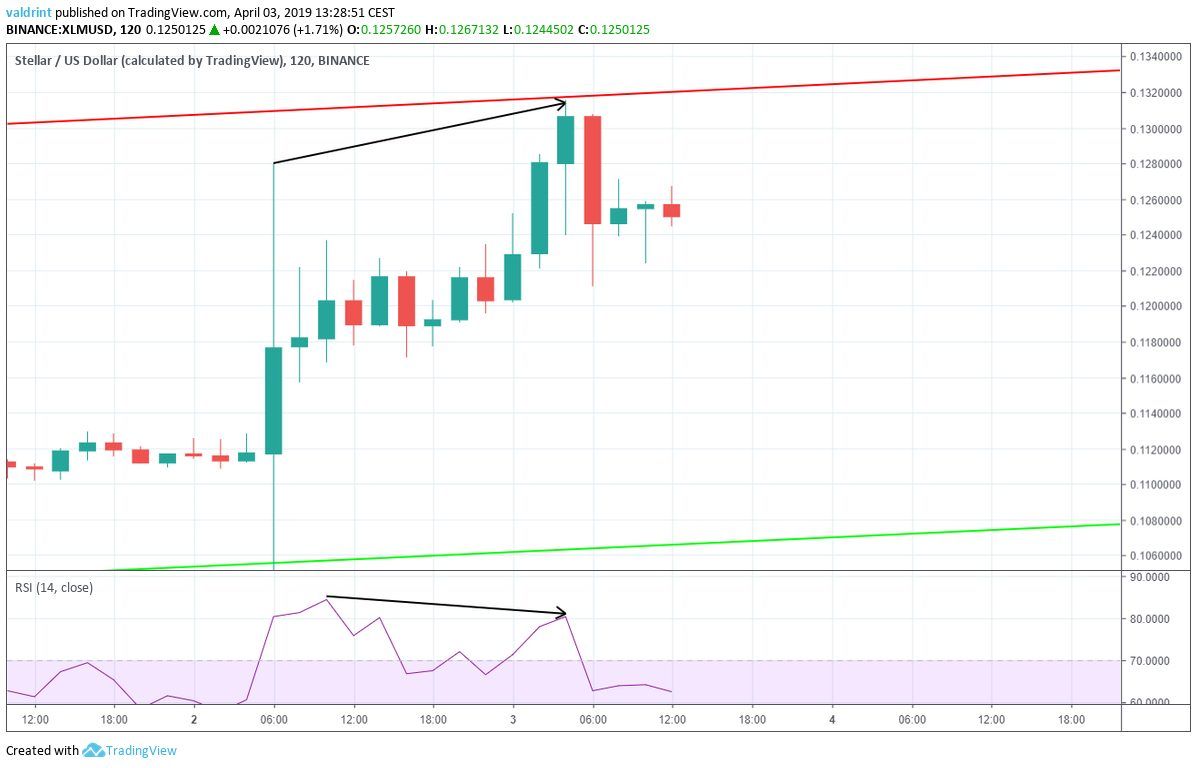
On Apr 2, the price reached a high of $0.126. It made a higher high of $0.131 on Apr 3.
Similarly, the RSI made the first high on Apr 2. However, it has continued to create lower values since.
This is known as bearish divergence and often precedes price decreases.
The use of RSI further suggests price losses toward the support line in the near future.
Invest in BTC with 0 Commission Here!
Future Movement
To better determine possible price levels in the future, we will examine resistance and support areas.
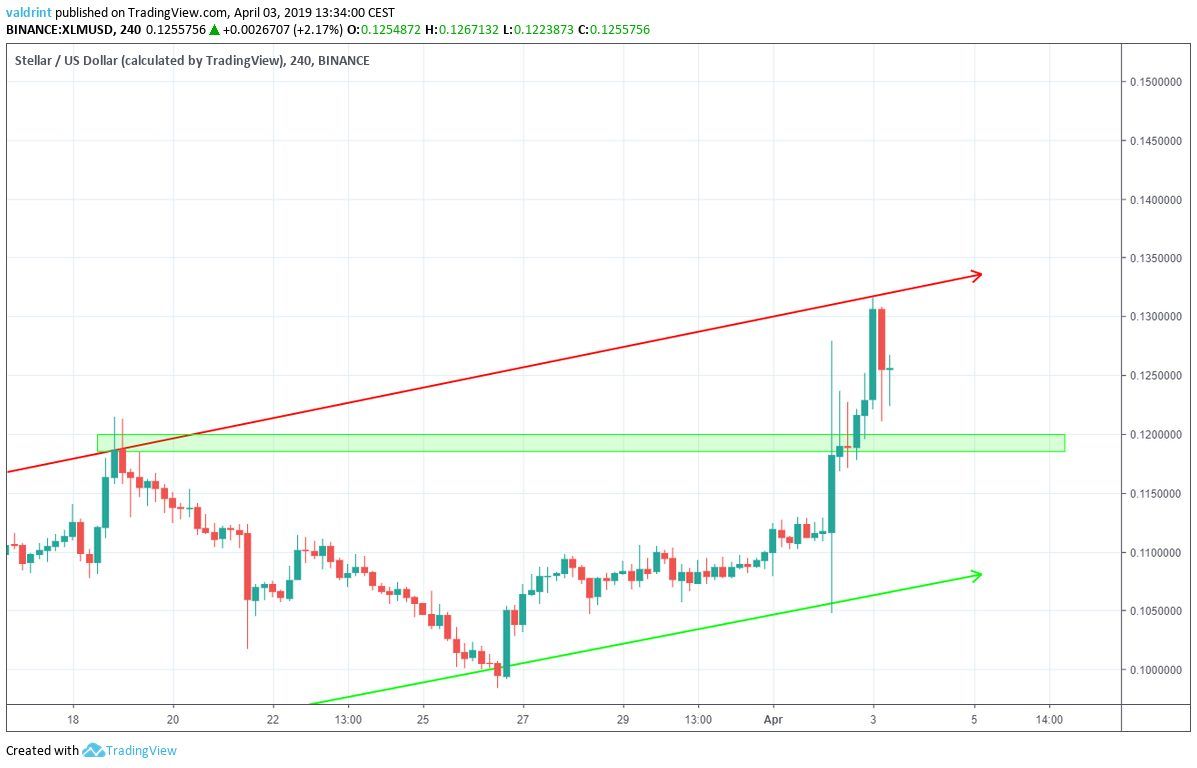
The closest support area is found near $0.12. It is formed by the highs of Feb 19. If price drops toward support as predicted, Stellar lumens may reach this support and possibly drop further.
Summary of Analysis
Based on this analysis, the price of XLM is likely to decrease in the near future, and reach the support line of the channel. It is possible that lumens will reach $0.12 and continue dropping. However, we do not currently believe that a breakdown is forthcoming.
Furthermore, while a breakout is possible, we believe this also to be unlikely.
Do you think the price of XLM will keep trading inside the channel? Let us know in the comments.
Disclaimer: This article is not trading advice and should not be construed as such. Always consult a trained financial professional before investing in cryptocurrencies, as the market is particularly volatile.


