


On Mar 27, 2019, Coinbase featured Stellar (XLM) on its “Coinbase Earn” platform. Coinbase Earn enables users to participate in online modules which will help them learn about the cryptocurrency while simultaneously earning it. The partnership is expected to give away one billion XLM.
This news may be partly responsible for gains experienced on Mar 27. After reaching a low of $0.1 on Mar 26, prices reached nearly $0.11 the following day.
However, at the time of writing, prices have since dropped near the $0.105.
Cardano has been on a gradual downtrend since $0.121 on Mar 18.
Stellar Lumens (XLM): Highlights and Trends For March 28, 2019
- The price of Stellar lumens has been on a downtrend since Mar 18.
- XLM is trading inside a possible reverse cup and handle pattern.
- The 21 and 50-period moving averages indicate that a downtrend has begun.
- There is resistance near $0.12.
- There are support areas near $0.083 and $0.075.
Reverse Cup And Handle
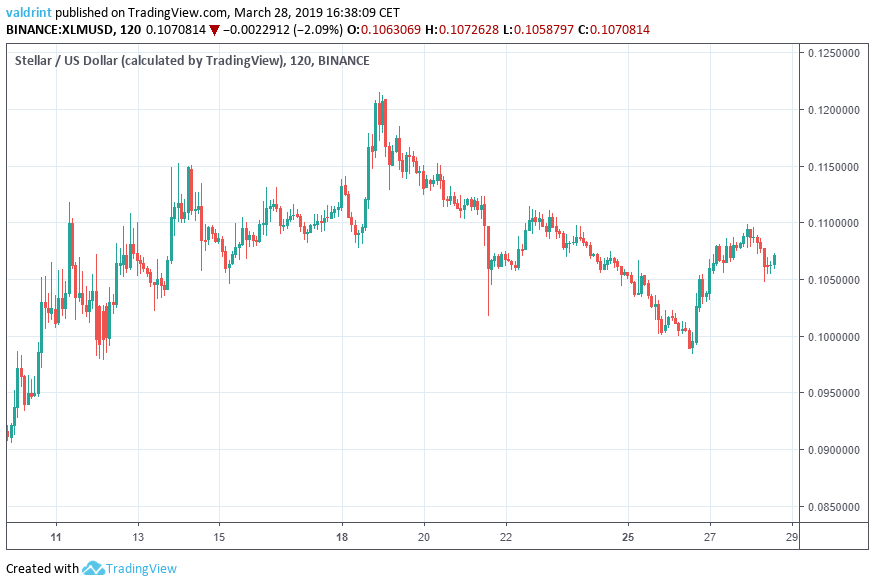
We begin by analyzing the price of XLM on Binance at two-hour intervals from Mar 11 to Mar 28. This allows us to trace the current trading pattern.
On Mar 12, the price made a low of $0.097. A rapid increase ensued, followed by a gradual decrease. The price reached the same level on Mar 26.
Tracing these lows gives us a horizontal support line.
Furthermore, on Mar 18, the price made a high of $0.121. It took roughly seven days for the price to reach this level from $0.097, and seven days for it to drop back to $0.097.
On Mar 26, it started another upward move, which possibly ended later that day at $0.11. It is currently in a short-term downtrend.
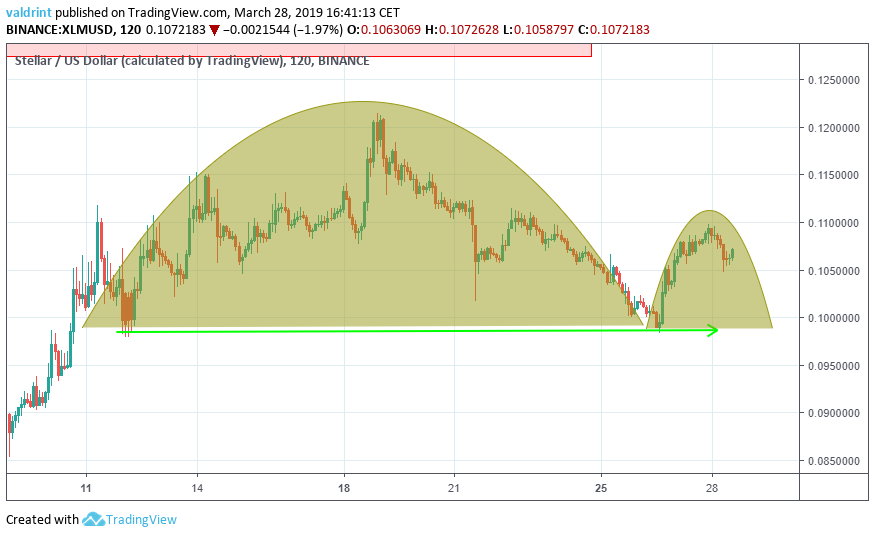
The gradual increase and decrease followed by the creation of an identical but smaller pattern are characteristics of a reverse cup and handle pattern (seen in the graph above).
This is a bearish pattern and suggest forthcoming price losses.
Bearish Cross
The price of XLM on Binance is analyzed at six-hour intervals from Mar 4 to Mar 28 using moving averages to better assess possible future price levels.
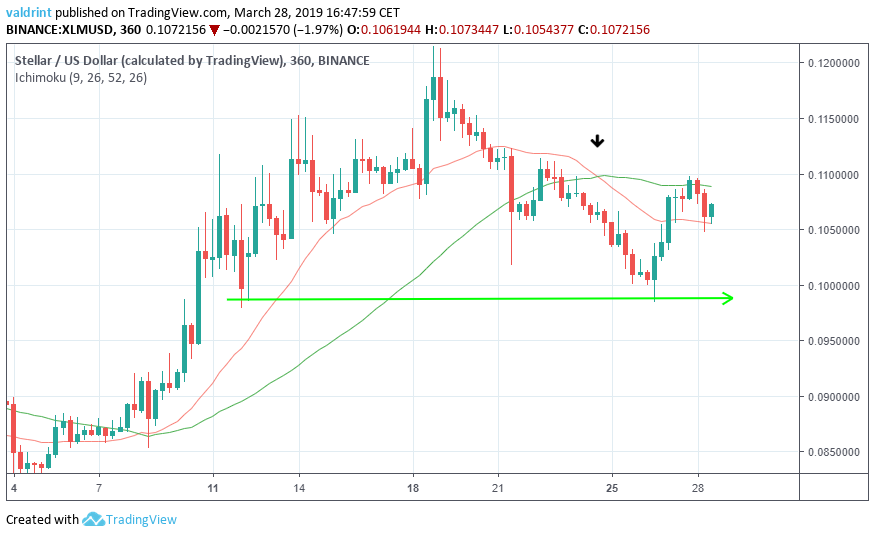
On Mar 25, the 21-period MA (Red) crossed below the 50-period MA (Green). This signifies that the current trend may be over and a new downtrend may have begun.
The use of this indicator adds further validity to the bearish cup and handle pattern seen in the last section. As a result, this seems to confirm our prediction of near-term price losses.
Future Movement
To better determine actual possible price levels in the future, we examine resistance and support areas.
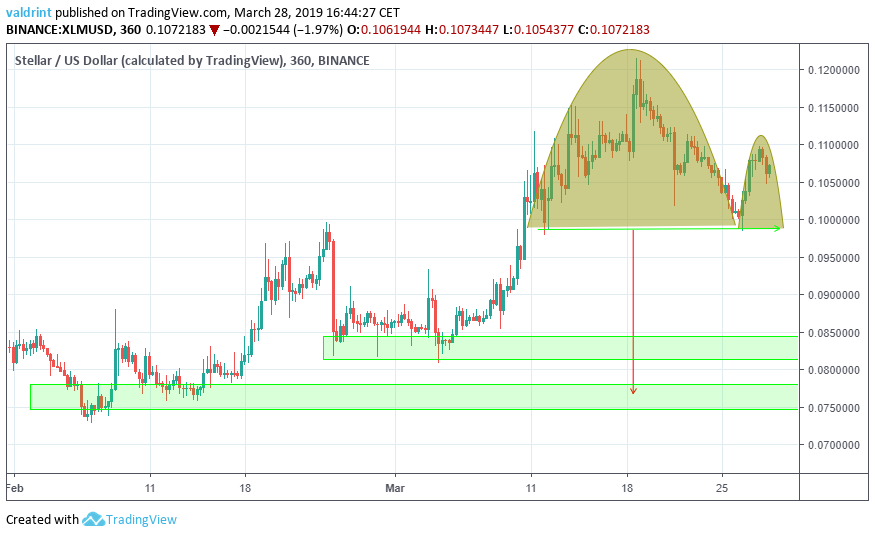
The closest support area is found near $0.083, followed by the support area near $0.075. Based on our analysis, it is likely that the price will reach at least one of these areas.
The red arrow measures the distance between the top and bottom of the pattern. If the breakdown occurs as predicted by the pattern, the price will reach the second area.
Summary of Analysis
Based on this analysis, the price of XLM is likely to decrease in the near future, and reach the support line near $0.1. From there, a breakdown remains the most likely possibility.
Do you think the price of XLM will eventually break out from the support line? Let us know in the comments.
Disclaimer: This article is not trading advice and should not be construed as such. Always consult a trained financial professional before investing in cryptocurrencies, as the market is particularly volatile.


