
At BeInCrypto, we publish regular price analyses and predictions for various cryptoassets. In our Apr 22 analysis of Stellar lumens (XLM), we predicted the price would increase. Our prediction was invalidated on Apr 24 when the price broke down from the channel we have defined below. To learn more, read our latest XLM/USD($) and XLM/EUR(€) analysis below:
Stellar Lumens (XLM): Highlights for April 24, 2019
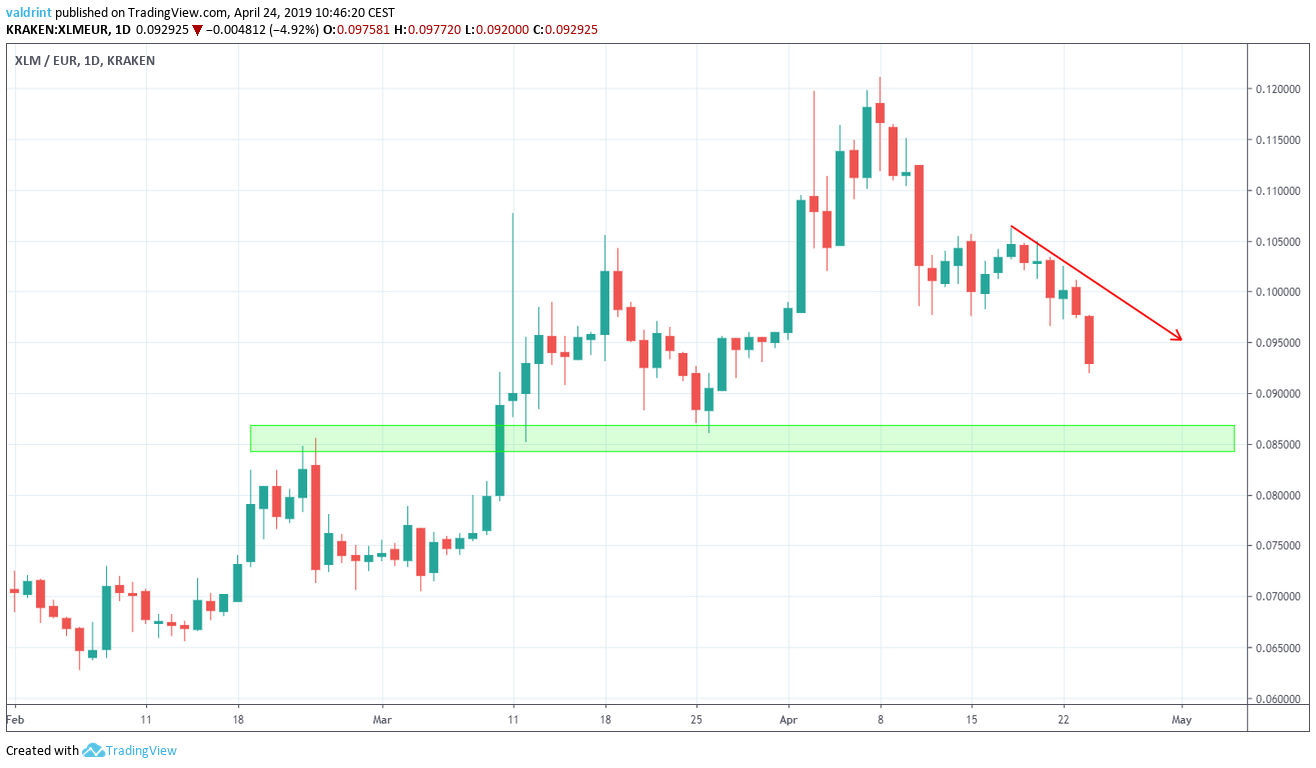
- The price of Stellar lumens has been on a downtrend since Apr 18.
- XLM is following a descending resistance line.
- The 10- and 20-day moving averages have made a bearish cross.
- There is support near $0.1 and €0.085.
Current Trading Pattern for Stellar Lumens
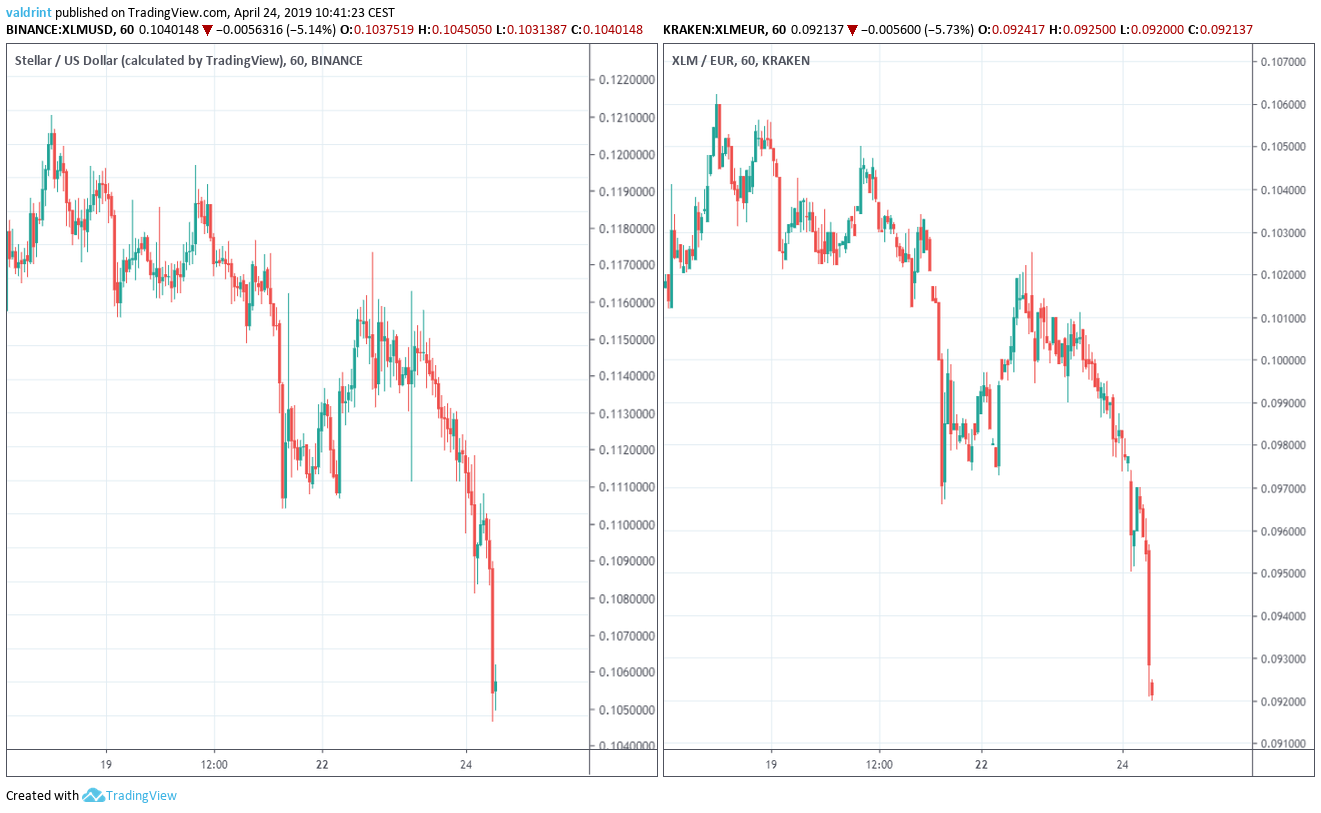
In this section, we analyze the price of XLM/USD at one-hour intervals from Apr 18 to Apr 24 to trace the current trading pattern. In order to avoid confusion, we will not be using images of the XLM/EUR pair until the summary, where the relevant resistance and support areas will be shown in dollars and euros.
On Apr 18, the price reached a high of $0.121. A downtrend ensued and the price has reached several lower highs.
Tracing these highs gives us a descending resistance line:
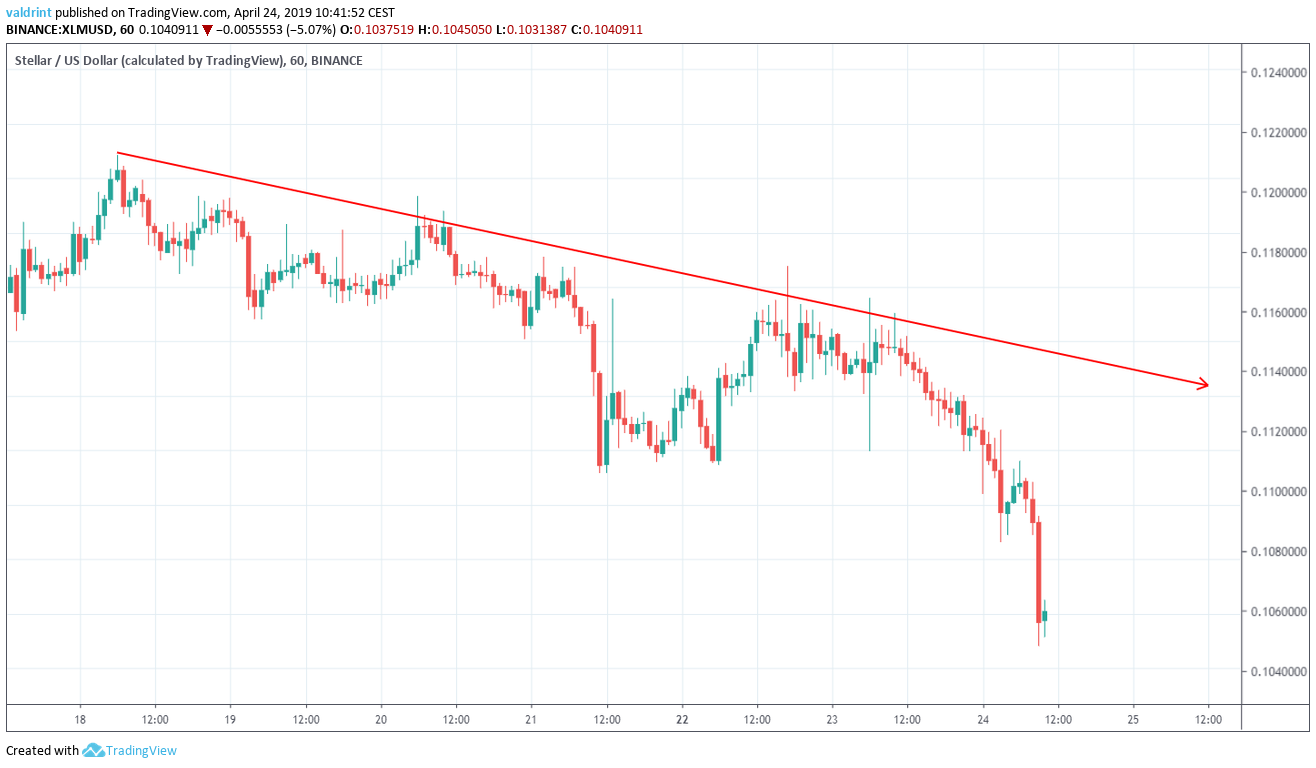 There is no visible support line. In order to try and predict price movements, we need to take a look at a longer time-frame and incorporate technical indicators.
Technical Indicators
In this section, we will analyze the price of XLM/USD is analyzed at one-day intervals from Feb 11 to Apr 24 alongside moving averages.
Moving averages are tools used in technical analysis to smooth out price action. It is a lagging indicator since it is based on past prices. The relationship between short and long-term moving averages can help in identifying the beginning and end of a trend.
The 10-, 20- and 100-day MAs are shown in the graph below:
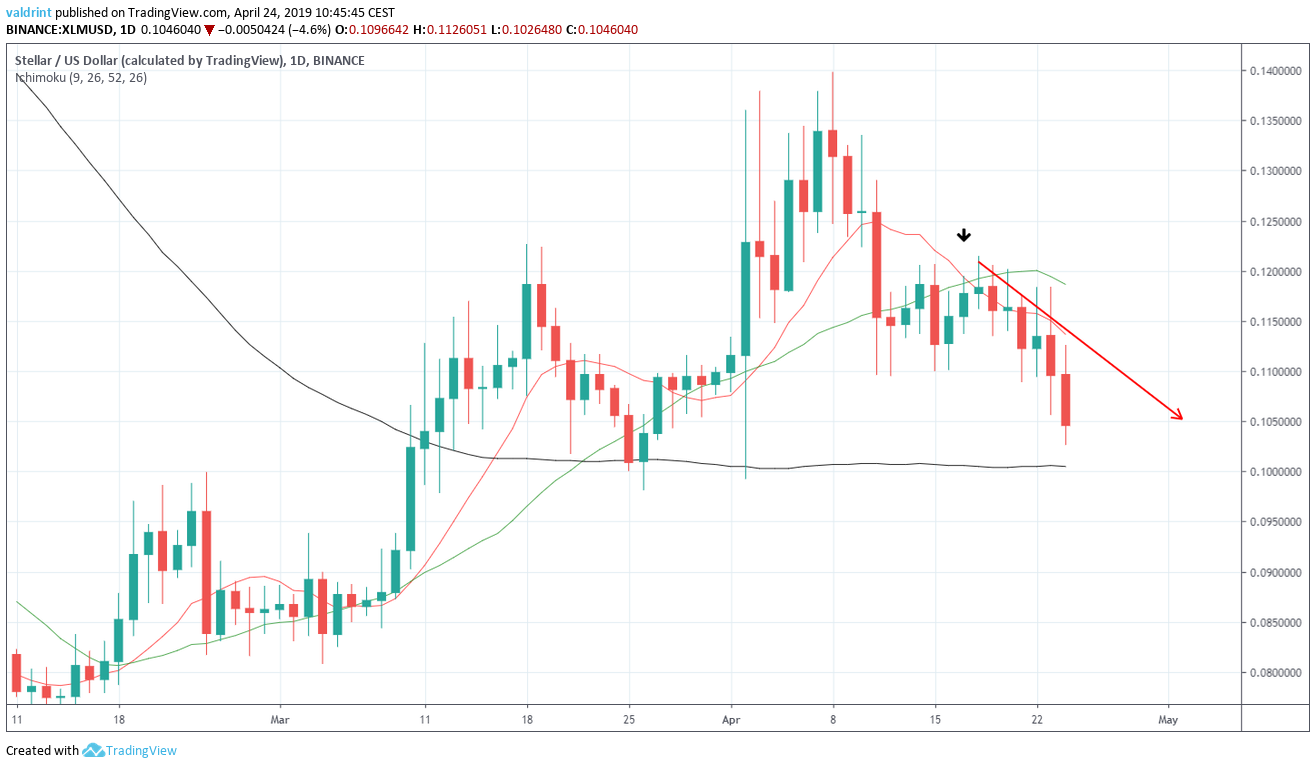 On Apr 17, the 10-day MA crossed below the 20-day MA. This might indicate that a new downtrend will begin. The downtrend began on Apr 18.
The price is trading above the 100-day moving average, which is currently at $0.1. This coincides with one support area which we will define in the following section.
The use of these indicators suggests that the price will decrease towards the 100-day moving average.
On Apr 17, the 10-day MA crossed below the 20-day MA. This might indicate that a new downtrend will begin. The downtrend began on Apr 18.
The price is trading above the 100-day moving average, which is currently at $0.1. This coincides with one support area which we will define in the following section.
The use of these indicators suggests that the price will decrease towards the 100-day moving average.
Reversal Areas
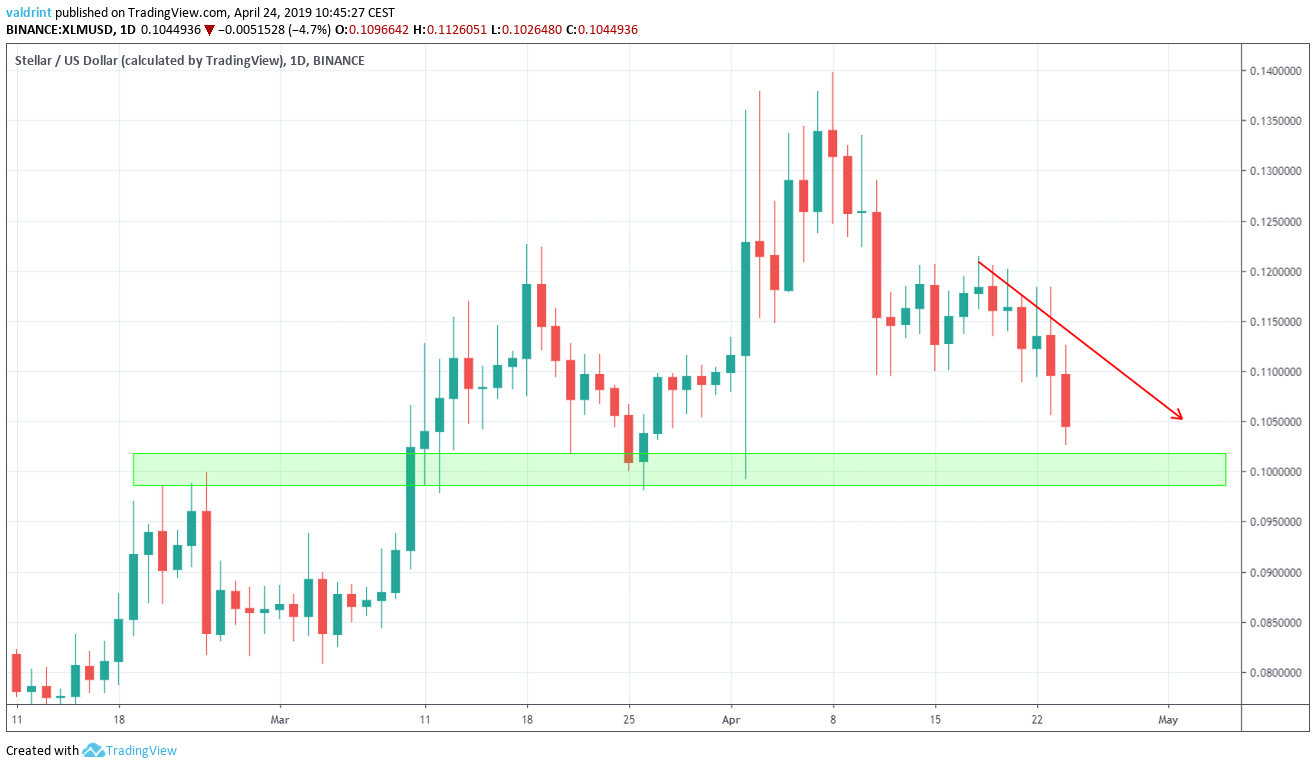
To determine the actual possible future price levels, we incorporate support areas into the analysis.Support areas are created when the price visits the same level several times. If a breakdown occurs, they can create possible areas of reversal.
These are shown in the graph below for both XLM/USD and XLM/EUR:
Summary of Analysis
Based on this analysis, the price of Stellar lumens is likely to decrease towards the support area we have outlined above. Lows around $0.1 and €0.085 may be reached in the near future. Do you think the price of XLM will begin a reversal? Let us know in the comments. If you’re interested in Stellar lumens price predictions for 2019 and 2020, click on the green button below: Disclaimer: This article is not trading advice and should not be construed as such. Always consult a trained financial professional before investing in cryptocurrencies, as the market is particularly volatile.
Top crypto platforms in the US
Disclaimer
In line with the Trust Project guidelines, this price analysis article is for informational purposes only and should not be considered financial or investment advice. BeInCrypto is committed to accurate, unbiased reporting, but market conditions are subject to change without notice. Always conduct your own research and consult with a professional before making any financial decisions. Please note that our Terms and Conditions, Privacy Policy, and Disclaimers have been updated.

Valdrin Tahiri
Valdrin discovered cryptocurrencies while he was getting his MSc in Financial Markets from the Barcelona School of Economics. Shortly after graduating, he began writing for several different cryptocurrency related websites as a freelancer before eventually taking on the role of BeInCrypto's Senior Analyst.
(I do not have a discord and will not contact you first there. Beware of scammers)
READ FULL BIO
Sponsored
Sponsored