

The Stellar (XLM) price has cleared a long- and short-term resistance level, a forewarning of a potential pump.
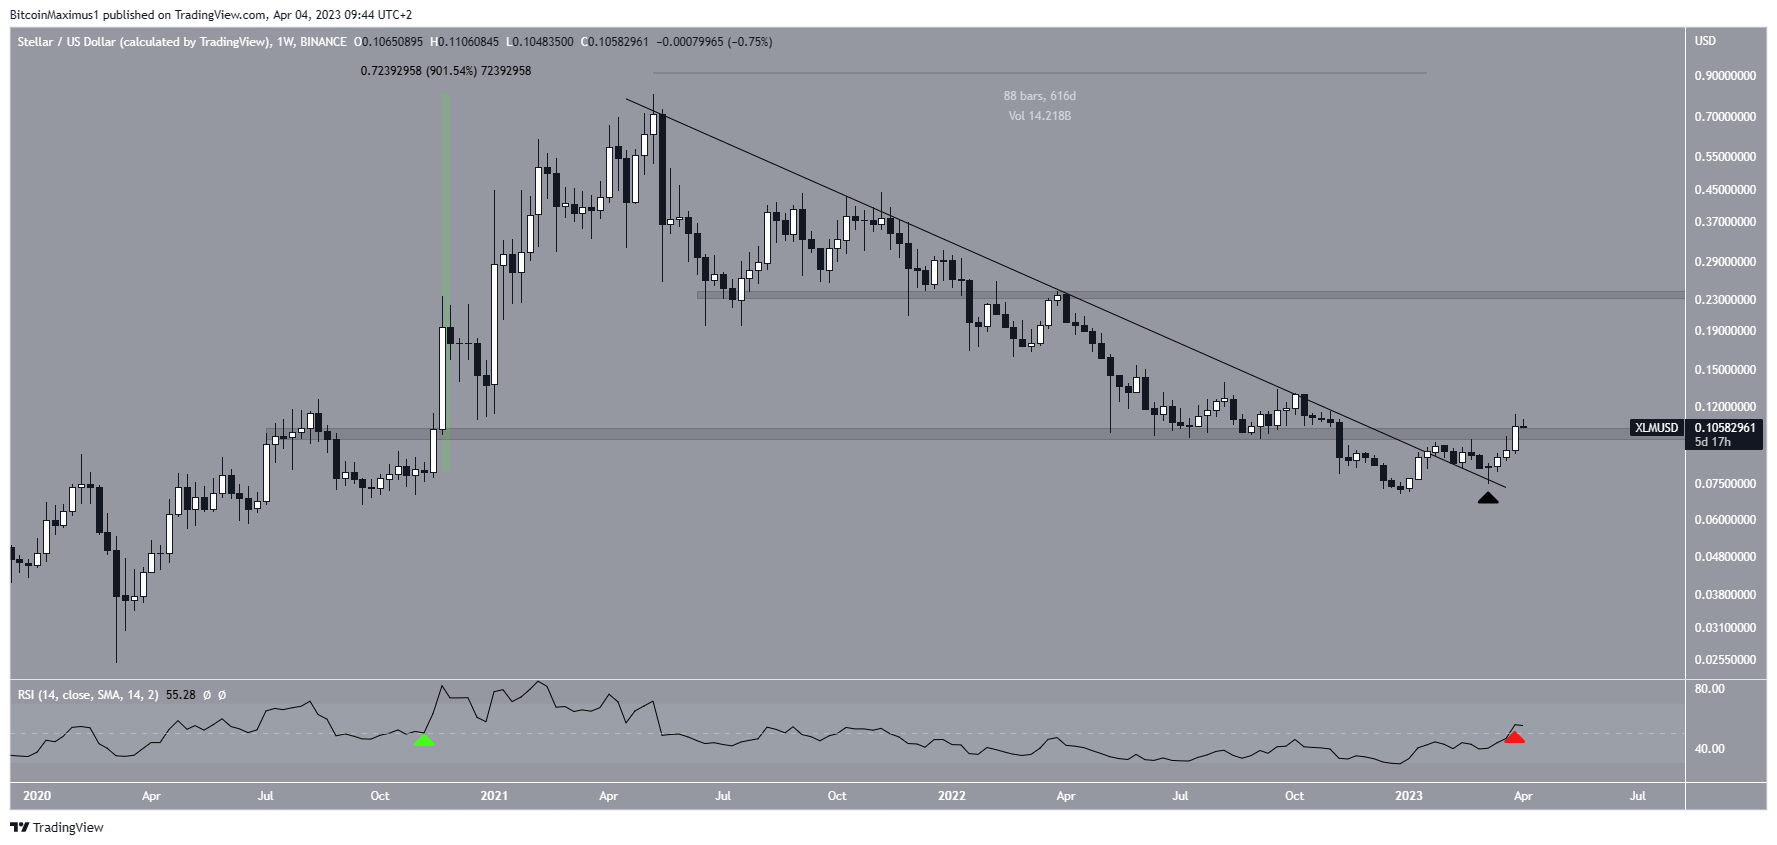
The Stellar price has increased since the beginning of the year and broke out from a descending resistance line in January. Before the breakout, the line had been in place for 616 days. Breakouts from such long-term structures usually lead to significant upward movements.
After validating the line as support (black icon), the XLM price reclaimed the $0.100 long-term resistance area. This is the next step in a bullish trend reversal. If the upward movement continues, the next resistance would be at $0.235.
The weekly RSI supports the continuation of the increase since it has finally moved above 50 (red icon). The previous time the RSI decisively broke out above 50 (green icon) was in November 2020, preceding a 900% price increase.
As a result, a similar massive price surge may follow.
Stellar (XLM) Price Surges After Breakout
The technical analysis from the daily time frame supports the bullish outlook from the weekly one. On March 21, the price broke out from a short-term descending resistance line and then moved above the $0.095 minor resistance area. Afterward, it reached a new yearly high of $0.114 on April 1. However, the XLM price has fallen since the 0.618 Fib retracement resistance level rejected it.
Nevertheless, the readings from the weekly and daily time frames are decisively bullish, supporting the continuation of the increase. As a result, the Stellar price is expected to create a higher low and resume its upward movement.
Since the increase is likely part of a five-wave upward movement (black), a fall below the wave one high (red line) of $0.099 would invalidate the bullish price forecast. In that case, the XLM price could fall toward its yearly low close to $0.070.

To conclude, the most likely XLM price forecast is bullish. The price is expected to gradually move toward the long-term resistance at $0.230. However, a fall below $0.099 would invalidate this bullish forecast and could lead to a drop toward $0.070.
For BeInCrypto’s latest crypto market analysis, click here.
Disclaimer
In line with the Trust Project guidelines, this price analysis article is for informational purposes only and should not be considered financial or investment advice. BeInCrypto is committed to accurate, unbiased reporting, but market conditions are subject to change without notice. Always conduct your own research and consult with a professional before making any financial decisions. Please note that our Terms and Conditions, Privacy Policy, and Disclaimers have been updated.
