


The Stellar (XLM) price broke out from a long-term resistance area and reclaimed an important horizontal level.
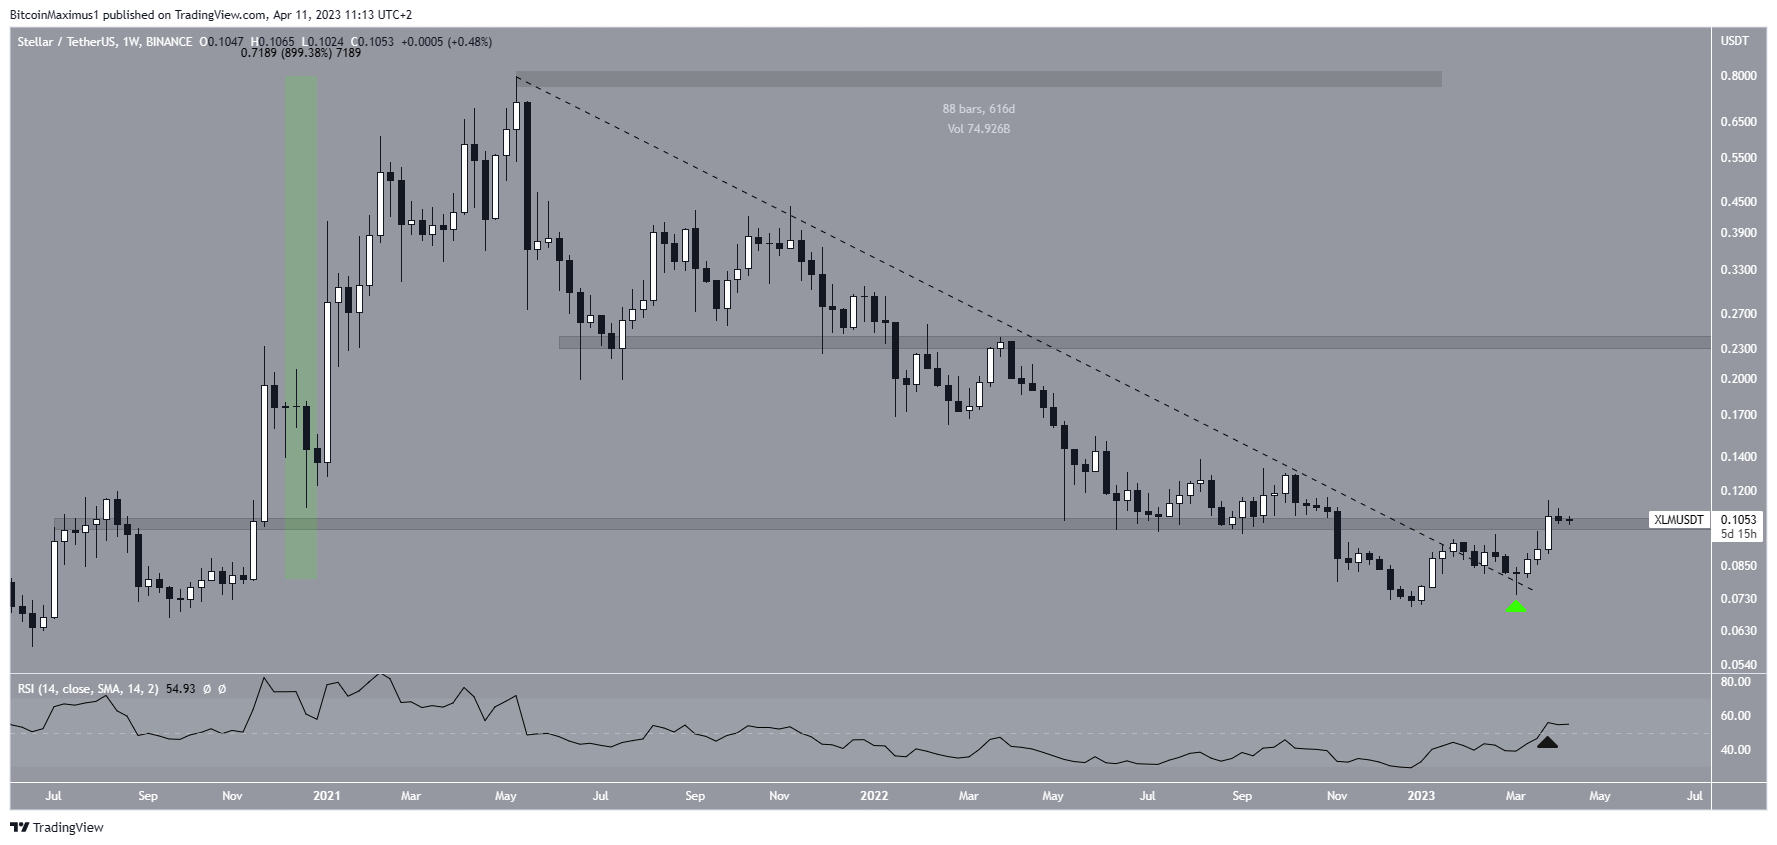
The value of Stellar has gone up since the start of the year. In January, it broke through a descending resistance line that had been in place for 616 days. Such breakouts from long-term structures usually result in significant upward movements.
After confirming the line as support (green icon), the price of XLM surpassed the long-standing resistance level of $0.100. This marks a positive development in a trend that favors buyers. If the price continues to climb, the next level of resistance will be at $0.235.
The weekly RSI supports the ongoing increase since it has surpassed the 50 level (black icon). The last time the RSI clearly went above 50 was in November 2020, which preceded a 900% price increase.
Therefore, it is possible that a similarly large price increase could occur again.
Stellar (XLM) Price Prediction for April: Possible Gains Ahead
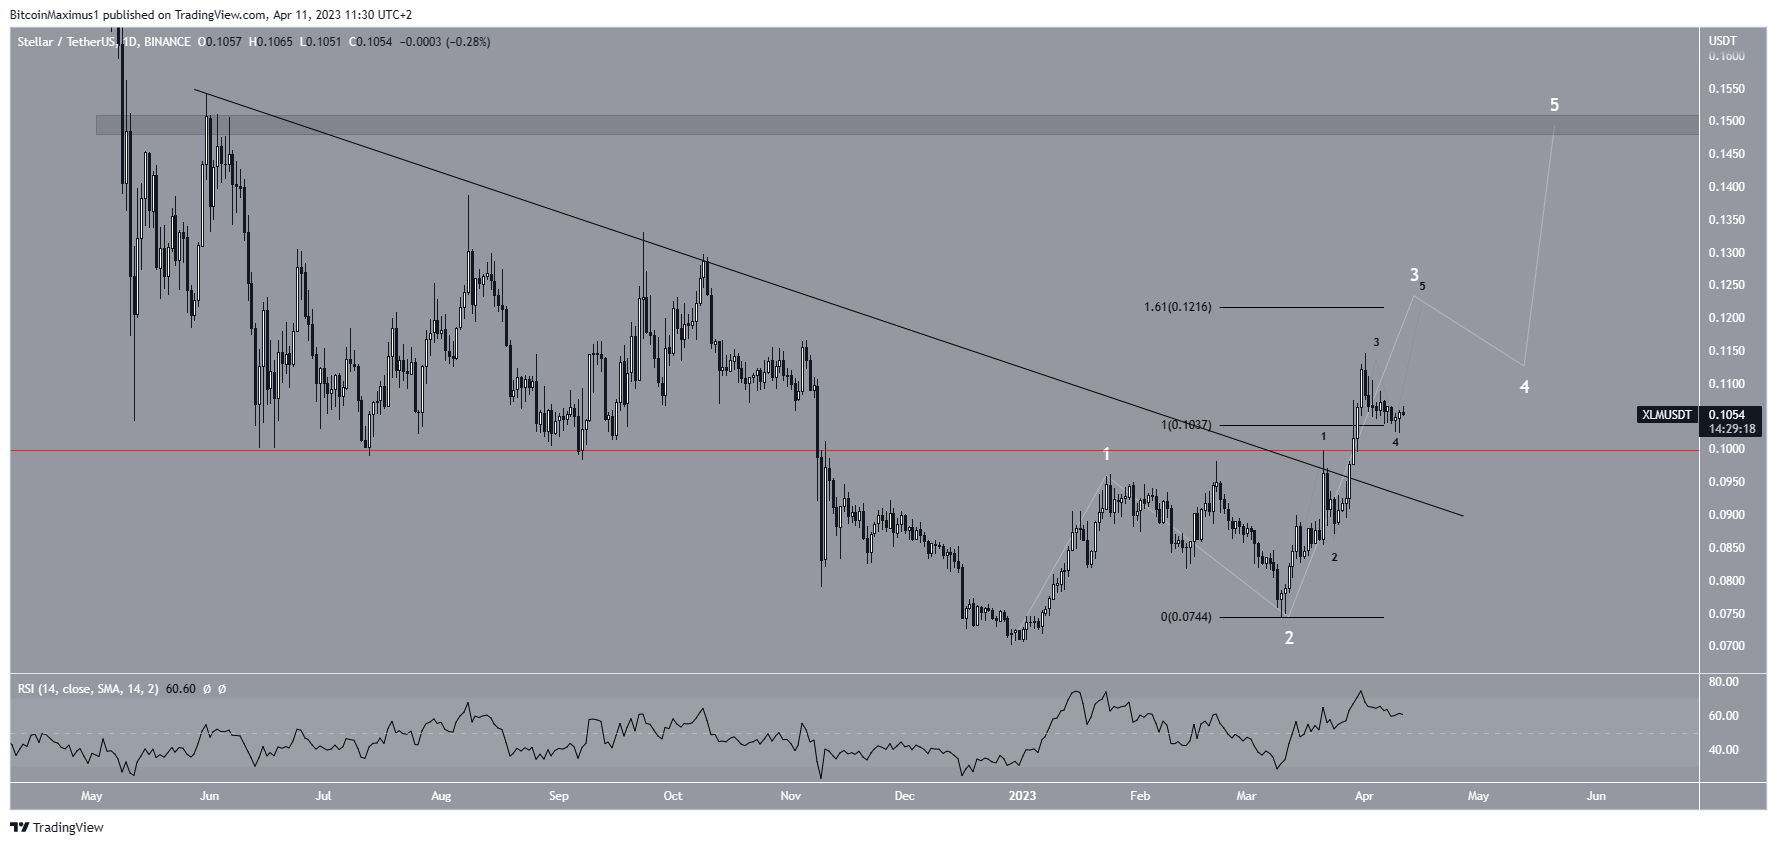
The technical analysis of the daily time frame supports the optimistic outlook of the weekly analysis. On March 21, the price broke out of a descending resistance line. Later, it reached a new high for the year of $0.114 on April 1. Even though the price has decreased since the daily RSI has not generated any bearish divergence. This allows for the increase to continue.
Next, the increase since the beginning of the year is likely part of a five-wave increase. If so, the price is currently in wave three (white). The short-term sub-wave count is given in black. The fact that wave three is longer than wave one supports the possibility that the increase is impulsive. Therefore, the next likely target for the top is at an average price of $0.121, giving waves one and three a 1:1.61 ratio. Afterward, the entire move could end near $0.150.
A decrease below the sub-wave one high (red line) at $0.099 would invalidate this Stellar price forecast. In that case, the XLM price could drop to $0.070.
To conclude, the most likely XLM price prediction for April is an increase toward at least $0.150. A drop below $0.099 would invalidate this bullish outlook and could cause a fall to $0.070.
For BeInCrypto’s latest crypto market analysis, click here.


